e-ISSN: 2278-067X, p-ISSN: 2278-800X, www.ijerd.com
Volume 14, Issue 1 (January 2018), PP.12-21
Calculation of the Reorder Point for Items with Exponential And
Poisson Distribution of Lead time Demand
Juan Manuel Izar-Landeta
1,Juan Izar-Tenorio
2,Raúl Hernández-Molinar
3 1Universidad del Centro de México2Independent Professional
3Universidad Autónoma de San Luis Potosí
Corresponding Author: Juan Manuel Izar-Landeta
ABSTRACT:- This paper aims the estimation of lead time, and the reorder point that produce minimum inventory cost, using the Exponential and Poisson distributions for each of the corresponding products under study, when a service level is required. It has been considered several important factors like account stockouts and safety stock maintenance. The estimation process explores carefully what happens to the reorder point and inventory cost when the service level changes.
It is evident that the variation of the minimum inventory cost as a function of the reorder point, has been different for both items. In this case, it is considered a linear relationship for high and low service levels for the item with exponential distribution, and a parabolic relationship for intermediate levels, and those reorder points located at extreme values of the range under study, depending on the cost structure of stockouts and inventory maintenance.
Likewise, for the item with Poisson distribution, the cost behavior has been considered non-linear, as the reorder point has been located at intermediate values of the range studied depending on the service level. Also, it has been assumed that the cost variation with service level has been different for both items. In the case of the item with exponential distribution, the behavior is non-linear, turning asymptotic for those service levels higher than 0.62, whereas for the item with Poisson distribution, the cost variation has been linear.
keywords:-
Reorder point, Lead time demand, Lead time, Safety stock, Inventory cost.--- ---
Date of Submission: 16 -01-2018 Date of acceptance: 30-01-2018
---
---I.
INTRODUCTION
Inventory plays a very important role in modern organizations and constitutes a significant part of their assets. Therefore, it has be adequately managed to serve as a function when a minimum cost is required. Inventory management involves making two basic decisions [1]: (1) the quantity to order with each order placed and (2) the point in time when the order has to be placed.The vast majority of models seek to fulfil some objectives, but one of the most usual considers the following factors [1]: Cost minimization, profit maximization, maximization of rate of return of stock investment, determination of a feasible solution and ensuring flexibility against uncertainty. It has been shown that this model is useful to obtain minimum cost Given the uncertainty of the demand level for goods and the delivery of raw materials from suppliers, the organizations tends to set a safety stock that allows them to fulfil demand and avoid facing product shortages that lead to lost sales and projects a bad image in the customers criteria. This approach has been an effective strategy for the organization because the globalization and the level of competitiveness in all industries, from manufacturing goods, transactional operations and services.
maintenance and stockouts which occurs when demand spikes. It is assumed that for both items, lead time demand is not seasonal and independent, and also the demand and lead time are not correlated.
II.
THEORETICAL FOUNDATIONS
Many studies have been realized on the application of inventory models to practical cases in order to determine safety stock, most of them seeking the minimization of inventory cost. For this research, a careful review of processes associated to determination of safety stock when lead times is a random variable, including cases about products that are purchased for retail, which is the case of a great amount of Mexican SMEs (small and medium enterprises) was made. One research suggests a Bayesian model that can be useful in selecting the reorder point, in contrast to the classical approach to calculate it using the desired service level; assuming that the probability distribution function of the lead time demand is known, although is not always the case [5]. On the other hand, others propose the estimation of the safety stock, considering the highest demand for an item, multiplied by the lead time. It has been proved that this would cause to have excess inventory in most of the cases [6].
Others [7] suggest two options to reduce inventory level without affecting the service level considering that service-level-threshold is greater than 50% showing that if a firm operates below this threshold, but reducing lead times and decreasing reorder points, it is possible to have an effect in reducing supplier lead time variability and in consequence the generation of a positive impact on the reorder points. They assert that if lead time demand follows a normal distribution, these two actions act in reducing inventory for cycle service levels above 50%, with lead time variability having a greater impact than lead time expected value. Other authors [8] mention that the two usual measures to cope with uncertainty in supply and demand of an item are mainly safety stock and safety lead time. Using simulation processes, they studied the effects of safety stock and safety lead time in a multi-product setting and they found that when supply is uncertain, a safety lead time should be used and in the case that demand is uncertain. They also mention that is better if the firm focus the attention on a safety lead time in order to have an adequate safety stock. In this same sense, others [9] state that the two parameters depend on the accuracy of the forecast used to produce them, arguing that lead time is an important factor. Thus, a safety lead time is preferable when an accurate demand forecast is possible; otherwise it is advisable to keep an adequate safety stock for customer requirements during lead time.
In a previous research work the authors suggest the use of variable safety stock for cost savings, with a higher safety stock when demand or supply is uncertain [10]. Others have studied a two-echelon supply chain with auto correlated consumer demand. When an equal variability is assumed, they mention that a negative auto correlated period-to-period oscillatory consumer demand provides shorter lead times and lower safety stocks as opposed to a positively auto correlated [11].Inventory seeks to fulfil two important goals: to provide the desired service level by the customer and to apply it at minimum cost. He considers that both objectives must be balanced in order to find an adequate solution, taking into account that lead time demand variability is having a considerable impact [12]. Other authors employ an interesting forecast based dynamic methodology using simulation to calculate the reorder point for an item with non-stationary demand and lead time uncertainty. Demand forecasts and forecast uncertainties are assumed to be known as exogenous data from which its parameters are derived using a sequential procedure for a given target cycle service level. The model has been tested on a data set from the pharmaceutical industry, demonstrating that it works appropriately and it does not require intensive computer use [13].
When lead times follow a gamma distribution for cycle service levels between 60% and 70%, an increase in the standard deviation of lead time will increase safety stock for standard deviation values between 0.5 and 0.6, but this effect is recursive and when standard deviation increase to values between 0.7 and 0.9, the safety stock decreases, which is different to the findings that have been obtained if other probability distributions are used [14]. In a single item study where independent demand forms a compound Poisson process and stochastic lead times, if lead time increases, lead time demand and safety stock also increase, however this may not necessarily result in a higher optimal average cost. On the other hand, if lead time has a high standard deviation, lead time demand and optimal average cost will be higher, and this effect depends on the inventory cost structure, namely stockout cost and maintenance cost structure [15].
conclusion about the impact of the mean or the variability of lead time on inventory cost, given it depends on whether or not both parameters are correlated [23].
In other study, the authors propose a methodology to estimate safety stock based on demand and lead time historical data and it has been proved that it does not follow a known probability distribution. This results in a lower inventory cost and closer values to the service level targeted, which confirms that traditional models tends to overestimate the reorder point [24]. Others have derived formulas to estimate safety stock and the reorder point for the case when demand and lead time are correlated, for Poisson and normal distributions [25]. Traditional models that calculate the reorder point assume that these two variables are independent, which could be far from reality, like the case where an important customer places a higher volume of orders to satisfy a higher demand and this translates into longer lead times from suppliers, where correlation between the variables is positive. Conversely if demand decreases, suppliers manufacture products less frequently resulting in longer lead times, in which case the correlation is negative. In a prior study, it has been investigated the impact of the correlation coefficient on the estimation of the reorder point when demand and lead time follow a normal probability distribution, assuming they are correlated [26]. The authors found that if the correlation coefficient has a high value (positive or negative) there will be differences in the estimation when using the traditional way or with the equations that apply if the variables are correlated.
Based on the information, this work is focused on the estimation process the reorder point that will produce the minimum inventory cost taking into account stockouts and safety stock maintenance for a given cycle service level,. The case considers the performance on two products: one having an exponential distribution of lead time demand and another one a Poisson distribution function. Also, it is analysed what is the effect in the reorder point and inventory cost when varying the service level.
III.
METHODOLOGY
In this work the reorder point PR is calculated with the equation:
(1)
B
PR
μ is the average leadtime demand and B is the safety stock. The inventory cost is obtained using the equation (2):
(2)
NfNp
C
B
C
Ct
m
f Where:Ct = Safety stock total cost, $/year
Cm = Inventory maintenance cost of one unit, $/year B = Safety stock, units
Cf = Stockout cost, $/unit Nf = Stockout units, units/order Np = Number of orders, Orders/year
Service level ns is obtained with the conventional formula related to costs ratio:
(3)
Np
C
C
Np
C
ns
f m
f
The stockout units Nf is estimated considering the expected value of the deviations of the observations from reorder Point (PR) [27]:
LSPR
dx
)
x
(
f
)
PR
x
(
Nf
(4)
Where:
x = Leadtime demand, units PR = Reorder point, units
LS = Superior limit of the probability function in units f(x) = Probability function
Since there will be stockouts each time the leadtime demand exceeds the reorder point. As we know, the exponential distribution function is given by:
(5)
1
Exp
x
When this function is integrated and replaced in equation (4), the formula to calculate the sotckout units for exponential distribution is:
(6)
(
LS
PR
)
Exp
LS
(
2
PR
)
Exp
PR
Nf
We know that the Poisson distribution function is:
(7)
!
)
(
Exp
)
x
(
f
x
In order to propose a solution, it is necessary to use numerical approximations. One alternative to estimate the stockout units is given by the following equation [28]:
(8)
n 1 i i ip
f
Nf
Where fi is the stockout units that correspond to each leadtime demand option and pi is the associated probability. Then what is done is that for each service level the reorder point that minimizes the safety stock cost for both products is obtained.
IV.
APPLYING THE EXPONENTIAL DISTRIBUTION FUNCTION TO A PRODUCT
Assume that this is a product where the leadtime demand has the exponential distribution with mean of 120 units and maximum value (upper limit) of 180 units. Ten orders are made each year and the maintenance cost of stock is $ 2,400 annually per unit and each missing unit costs $ 1,200.
Service level is calculated using the equation (3):
0.8333
)
10
)(
1200
(
2400
)
10
)(
1200
(
ns
It is evident that if safety stock is set at its minimum (zero), the reorder point is the corresponding mean value of leadtime demand which is 120 units.
Then the number of missing units is obtained using the equation (6):
38
.
72
120
120
Exp
120
)
120
)(
2
(
120
180
Exp
)
120
120
180
(
Nf
Now, the safety stock cost is calculated with equation (2):
año
/
$
18
.
663
,
464
)
10
)(
72
.
38
)(
1200
(
)
0
)(
2400
(
Ct
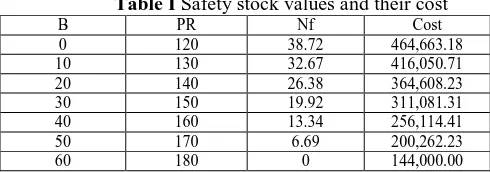
If this calculation process is repeated with other safety stock values, it is possible to generate the results shown in the Table I:
Table I Safety stock values and their cost
B PR Nf Cost
0 120 38.72 464,663.18 10 130 32.67 416,050.71 20 140 26.38 364,608.23 30 150 19.92 311,081.31 40 160 13.34 256,114.41 50 170 6.69 200,262.23
60 180 0 144,000.00
Fig. 1 Variation of inventory cost with reorder point
Then a process where the stockout cost changes is made to obtain the reorder point. Fig. 2 shows that varying the service level from 0.51 to 0.608, the resulting reorder point is 120 units (zero safety stock); For a service level of 0.608, the minimum cost reorder point reach $ 144,000 annually considering values of 120 and 180, which are the minimum and maximum values, respectively. We can observe that if the service level is above 0.608, the reorder point is set to its maximum value of 180.
Fig. 2 Change ofreorder point with service level
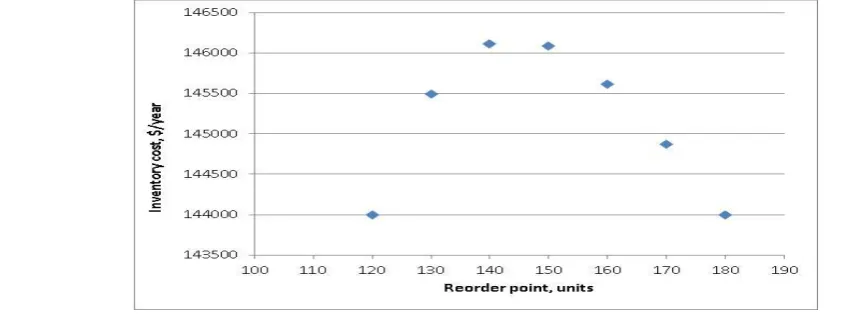
Fig. 3 presents the behavior of inventory cost when the service level is fixed to 0.608. We can observe that effectively the inventory cost is a function of the reorder point. A clear parabolic tendency of the inventory cost is observed, and the maximum value of the inventory cost for a reorder point of 140 units is produced. We can note that is an intermediate value of the range under study, and the minimum costs are $ 144,000 per year when the extreme values of the reorder point (120 and 180) are employed.
In Fig. 4 we can observe the inventory cost given the amount of service level. It is clear that when the service levels is low (in the range 0.5 to 0.6), the cost tends to be small, and for values of service level values greater than 0.6, the cost is $ 144,000 per year and presents a stable behavior.
Fig. 4 Inventory cost depending on the service level
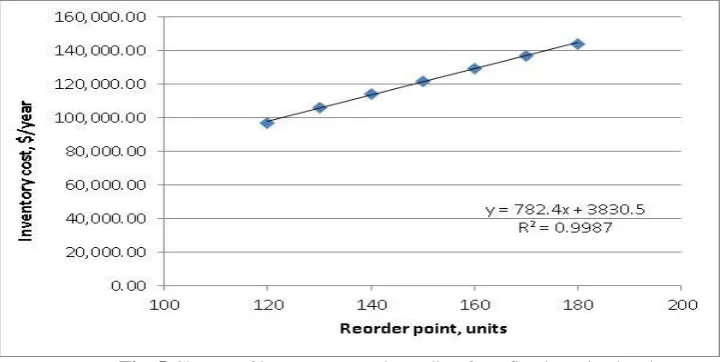
Finally, a study of the inventory cost variation was made using different values of the reorder point, fixing a service level of 0.51. The results are showed in Fig. 5.
The cost variation has been linear with an almost perfect fit given the determination coefficient is 0.9987, and the cost increases 782 pesos for each additional unit of the reorder point. In contrast to what happened for a high service level (0.8333), which is presented in Fig. 1, in this case the relationship between the cost and the reorder point is linear, whereas in that case it was inverse, which is due to significant differences in stockout and maintenance costs.
Fig. 5 Change of inventory cost depending for a fixed service level
V.
APPLYING THE POISON DISTRIBUTION FUNCTION TO A PRODUCT
A similar analysis is made for an article whose demand considering that leadtime has Poisson distribution with a mean of 80 and a maximum value of 100 and a minimum of 65 units. Given these conditions, 15 annual orders are made. Its annual maintenance cost is $ 3,000 per unit and that of each missing order (stockout order), the cost is $ 3,600.
The service level is obtained using equation (3):
0.9474
)
15
)(
3600
(
3000
)
15
)(
3600
(
ns
leadtime taking into account the probability distribution function. A range between 80 and 100 is considered, and results are shown in Table II.
Table II Leadtime demand probabilities
Leadtime demand Probability
80 0.0446
81 0.0440
82 0.0429
83 0.0414
84 0.0394
85 0.0371
86 0.0345
87 0.0317
88 0.0288
89 0.0259
90 0.0230
91 0.0203
92 0.0176
93 0.0152
94 0.0129
95 0.0109
96 0.0091
97 0.0075
98 0.0061
99 0.0049
100 0.0039
Using these values, the number of missing units can be estimated using the equation (8):
249
.
3
)
0039
.
0
(
20
)
0049
.
0
(
19
)
0061
.
0
(
18
)
0075
.
0
(
17
)
0091
.
0
(
16
)
0109
.
0
(
15
)
0129
.
0
(
14
)
0152
.
0
(
13
)
0176
.
0
(
12
)
0203
.
0
(
11
)
023
.
0
(
10
)
0259
.
0
(
9
)
0288
.
0
(
8
)
0317
.
0
(
7
)
0345
.
0
(
6
)
0371
.
0
(
5
)
0394
.
0
(
4
)
0414
.
0
(
3
)
0429
.
0
(
2
)
044
.
0
(
1
Nf
The safety stock cost is obtained with equation (2):
Ct
(3000)(0)
(3600)(3.2
49)(15)
175,446$
/
year
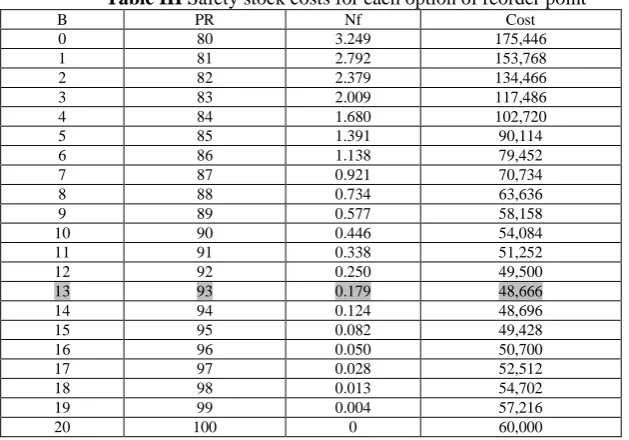
If this calculation process is repeated with other safety stock values, it is possible to generate the results shown in the Table III. The Table shows that minimum cost is $ 48,666 per year and occurs for a reorder point value of 93 units.
Table III Safety stock costs for each option of reorder point
B PR Nf Cost
0 80 3.249 175,446
1 81 2.792 153,768
2 82 2.379 134,466
3 83 2.009 117,486
4 84 1.680 102,720
5 85 1.391 90,114
6 86 1.138 79,452
7 87 0.921 70,734
8 88 0.734 63,636
9 89 0.577 58,158
10 90 0.446 54,084
11 91 0.338 51,252
12 92 0.250 49,500
13 93 0.179 48,666
14 94 0.124 48,696
15 95 0.082 49,428
16 96 0.050 50,700
17 97 0.028 52,512
18 98 0.013 54,702
19 99 0.004 57,216
20 100 0 60,000
Fig. 6 Change of inventory cost with reorder point
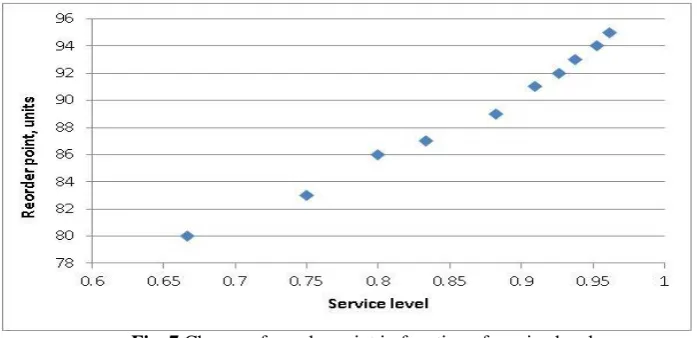
Using the same estimation process with other service levels, the graph of Fig. 7 can be produced. In this figure it can be seen that the change is almost linear. Also, it is possible to observe that if the service level rises, the reorder point is increased, which is expected, given under such conditions it is more expensive to have shortages than to keep units in inventory, which leads the increasing of the reorder point.
Fig. 7 Change of reorder point in function of service level
Fig. 8 shows the change of inventory cost with the reorder point, it has been produced a clear linear adjustment. The graph indicates that for each unit the reorder point increases, the minimum cost of safety stock rises just over two thousand pesos per year.
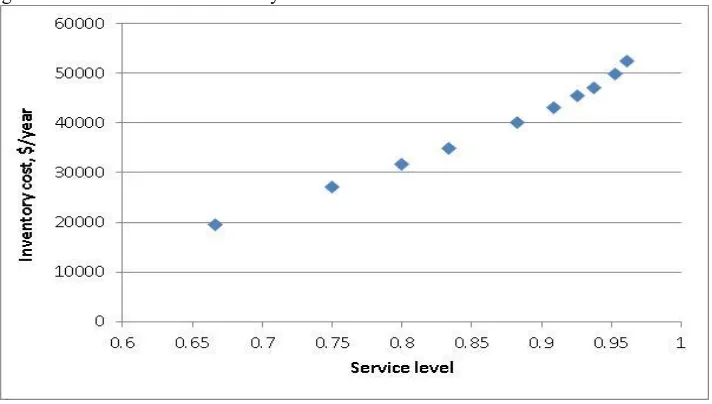
Finally fig. 9 shows the minimum inventory cost in function of service level.:
Fig. 9 Minimum inventory cost in function of service level
The change has been almost linear, if service level increases, the minimum cost of inventory rises, and is observed that the tendency is clearer on the right side of the graph.
VI.
CONCLUSIONS
It is possible to establish that the study has had some interesting findings.
Contrary to some authors [6], if one of the objectives of inventory management is to minimize its cost, the maximum demand should not be used for the estimation, but one that leads to the minimum cost, considering the stockouts and maintenance. According to others [10], the safety stock will be variable, depending on the leadtime demand and the costs incurred in its handling. This work also confirms the aspect indicated by [12] mentioning that must be fulfilled with a given service level and at a minimum cost.
Similarly, as is mentioned by [15], the optimal cost of inventory will depend on the structure of missing and maintenance costs. Based on the results obtained, we can mention that there have been found some similarities and differences between the two products analyzed in this research. The behavior of the minimum inventory cost as function of the reorder point has been different for both items, since for the one with exponential distribution was a linear behavior for low or high service levels and parabolic polynomial type for intermediate values, as was the case with a service level of 0.608, in which there are two reorder points tied with the minimum cost and precisely the minimum (120) and maximum (180) values of the leadtime demand. The reorder points for this product were always located either in the minimum or maximum value possible, depending on the inventory cost structure. For the product with Poisson distribution the cost behavior has been nonlinear, but different from the exponential, since the characteristic curve is very different. For this article the reorder point has been placed in intermediate values of the studied range, which depends on the service level. Also the variation of the cost with service level has been different for the 2 articles, since for the one of exponential distribution it is nonlinear and becomes asymptotic for values of service level greater than 0.62, whereas for the product with poissonian distribution, this variation has been almost linear. The similarity found for the two products has been in the linear variation of the minimum cost of safety stock with the reorder point in the case of low or high service levels of the product with exponential distribution, similar to Poisson, as Shown in Fig. 8. As can be seen, the reorder point is a model that seeks to minimize the inventory cost and differs according to the leadtime demand of the articles, so that a unique conclusion cannot be generalized that applies to any probability distribution of this variable.
In addition, special care should be taken to verify that demand and delivery time are independent, since if there is a correlation between both variables and that is significant, other equations should be used for reorder point calculation, not those presented in this paper, which apply if there is no correlation.
REFERENCES
[1]. E. A. Silver, “Inventory management: An overview, Canadian publications, practical applications and suggestions for future research,” Information Systems and Operational Research, vol. 46, no. 1, pp. 15-28, 2008.
[4]. A. Chikan, “The new role of inventories in business: Real world changes and research consequences,” International Journal of Production Economics, vol. 108, no. 1-2, pp. 54-62, 2007.
[5]. E. A. Silver, “Bayesian determination of the reorder point of a slow moving item,” Operations Research, vol. 13, no. 6, pp. 989-997, 1965.
[6]. E. A. Silver, and D. Costa, “Service and inventory level implications of a particular simple method of establishing the reorder point,” Information Systems and Operational Research, vol. 33, no. 2, pp. 133-144, 1995.
[7]. S. Chopra, G. Reinhardt, and M. Dada, “The effect of lead time uncertainty on safety stocks,” Decision Sciences, vol. 35, no. 1, pp. 1-24, 2004.
[8]. T. J. Van Kampen, D. P. Van Donk, and D. Van-der Zee, “Safety stock or safety lead time: coping with unreliability in demand and supply,” International Journal of Production Research, vol. 48, no. 24, pp. 7463-7481, 2010.
[9]. J. A., Buzacott, and J. G. Shanthikumar, “Safety stock versus safety time in MRP controlled production systems,” Management Science, vol. 40, no. 12, pp. 1678-1689, 1994.
[10]. J. J. Kanet, M. F. Gorman, and M. Stoblëin, “Dynamic planned safety stocks in supply networks,” International Journal of Production Research, vol. 48, no. 22, pp. 6859-6880, 2010.
[11]. R. N. Boute, S. M. Disney, M. Lambrecht, and B. Van Houdt, “Coordinating lead-time and safety stock decisions in a two-echelon supply chain with auto correlated consumer demand,” Department of Decision Science and Information Management, Katholieke Universiteit, Leuven, Belgium, pp. 1-29, 2010. [12]. P. L. King, “Crack the code: Understanding safety stock and mastering its equations,” APICS Magazine,
pp. 33-36, July/August, 2011.
[13]. M. Z. Babai, A. A. Syntetos, Y. Dallery, and K. Nikolopoulos, “Dynamic re-order point inventory control with lead-time uncertainty: Analysis and empirical investigation,” International Journal of Production Research, vol. 47, no. 9, pp. 2461-2483, 2009.
[14]. P. Wang, and J. A. Hill, “Recursive behavior of safety stock reduction: The effect of lead-time uncertainty,” Decision Sciences, vol. 37, no. 2, pp. 285-290, 2006.
[15]. J. Song, “The effect of lead time uncertainty in a simple stochastic inventory model,” Management Science, vol. 40, no. 5, pp. 603-613, 1994.
[16]. G. D. Eppen, and R. K. Martin, “Determining safety stock in the presence of stochastic lead time and demand,” Management Science, vol. 34, no. 11, pp. 1380-1390, 1988.
[17]. X. J. He, “The impact of stochastic lead time: the mean or the variance,” Proceedings of the International Multi Conference of Engineers and Computer Scientists II, pp. 1-5, 2009.
[18]. X. J. He, J. G. Kim, and J. C. Hayya, “The cost of lead-time variability: The case of the exponential distribution,” International Journal of Production Economics, vol. 97, no. 2, pp. 130-142, 2005.
[19]. J. M. Izar-Landeta, C. B. Ynzunza-Cortés, A. Castillo-Ramírez, and R. Hernández-Molinar, “Estudio comparativo del impacto de la media y varianza del tiempo de entrega y la demanda en el costo del inventario,” Ingeniería, Investigación y Tecnología, vol. XVII, no. 3, pp. 371-381, 2016.
[20]. J. C. Hayya, T. P. Harrison, and D. C. Chatfield, “Exploring the structural properties of the (D, 0) inventory model,” International Journal of Production Research, vol. 47, no. 10, pp. 2767-2783, 2009. [21]. C. Vinson, “The cost of ignoring lead-time unreliability in inventory theory,” Decision Sciences, vol. 3,
no. 2, pp. 87-105, 1972.
[22]. W. Dullaert, and L. Zamparini, “The impact of lead time reliability in freight transport: A logistics assessment of transport economics findings,” Transportation Research Part E, vol. 49, no. 1, pp. 190-200, 2013.
[23]. X. Fang, C. Zhang, D. J. Robb, and J. D. Blackburn, “Decision support for lead time and demand variability reduction,” Omega, vol. 41, no. 2, pp. 390-396, 2013.
[24]. A. J. Ruiz-Torres, and F. Mahmoodi, “Safety stock determination based on parametric lead time and demand information,” International Journal of Production Research, vol. 48, no. 10, pp. 2841-2857, 2010. [25]. P. Wang, W. Zinn, and K. L. Croxton, “Sizing inventory when lead time and demand are correlated,”
Production and Operations Management, vol. 19, no. 4, pp. 480-484, 2010.
[26]. J. M. Izar-Landeta, C. B. Ynzunza-Cortés, and E. Zermeño-Pérez, “Cálculo del punto de reorden cuando el tiempo de entrega y la demanda están correlacionados,” Contaduría y Administración, vol. 60, no. 4, pp. 864-873, 2015.
[27]. H. Taha, Investigación de Operaciones, 7th ed., Pearson Prentice Hall, México, 2004. [28]. J. M. Izar-Landeta, Investigación de Operaciones, 2nd ed., Trillas, México, 2012.