Classification Accuracy of Personal Identification Based
on Joint Motions Using 2D Information
Ryusuke Miyamoto
1*, Risako Aoki
21 Department of Computer Science, School of Science and Technology, Meiji University, Kanagawa, Japan. 2 Department of Fundamental Science and Technology, Graduate School of Science and Technology, Meiji
University, Kanagawa, Japan.
* Corresponding author. Tel.: +81(44)934-7442; email: [email protected] Manuscript submitted October 30, 2015; revised January 6, 2017.
doi: 10.17706/jcp.13.1.49-57
Abstract: This paper evaluates the classification accuracy of personal identification by a classification scheme with feature extraction based on joint motions using only two-dimensional information. Experimental results show that the feature extraction based on joint motions can achieve moderate classification accuracy when feature vectors are constructed from only two-dimensional information in an image plane. In addition, the results include interesting knowledge: the classification accuracy is not degraded drastically even if a gait is measured from right in front. In the best case, the classification accuracy becomes 78.95% in the experiment and it is 75.44% in the worst case.
Key words: Biometrics, Personal Identification, Gait Analysis,
1.
Introduction
The acquisitions of personal properties based on image processing has become a very popular topic because these properties are very useful for several applications; they can be used to construct robust security systems, to analyze consumer behavior, etc. The most popular visual cue used for this purpose is the human face, which has enables prediction of the age, sex, emotion, etc. in recent studies. In addition to these applications, face images can be used for identification for passport control and at the entrances of secured buildings, where highly accurate classification is required. As described above, face images can provide a considerable amount of information with sufficient accuracy to obtain personal properties when face image are captured at high resolution. However, it is not practical to predict personal properties by only face images if they cannot be captured at sufficient resolution owing to the distance between the camera and the target. This situation often occurs in images captured at generic outdoor scenes.
geometric measurements.
In addition to the above schemes using the whole part of the human body, there are other approaches for analyzing personal properties; a gait analysis analyzes the human motion caused by walking. Many studies on kinematics using a gait analysis are published, and they can be applied to prediction of personal properties; for gender prediction, previous studies [6], [7], and [9] have achieved an accuracy of 96%, 94%, and 83%, respectively. For personal identification, existing schemes proposed in [7], [8], and [10] show 82.5%, 72.50%, 87.5% classification accuracy, respectively. The image-based gait analysis in the above schemes is very useful for predicting personal properties because higher accuracy has been achieved without any specialized sensing devices. To improve the prediction accuracy of this type of schemes, the significant features of a gait for prediction should be determined. However, existing schemes tends to discuss about how to extract feature vectors from image and not to analyze the upper limit of classification accuracy when ideal joint positions are obtained. Therefore, we have shown the classification accuracy for gender prediction under ideal condition in [11].
The study [11] proposes gender prediction scheme based on joint motions, where a feature vector is extracted from three-dimensional coordinates corresponding to a walking period obtained from Microsoft Kinect v2 and a final classifier is constructed with the support vector machine. Experimental results using actual data obtained from 12 persons show that the proposed scheme can accurately predict gender of a target. This scheme is designed considering our basic idea about human’s gait: how to step forward when walking must be affected by skeletal structures according to their gender. The difference of skeletal structures according to individuals may less than the difference between men and women but the skeletal structures must not be the same for all humans. Therefore, we think our proposal [11] may show good performance for personal identification. To confirm this idea, this paper evaluates the accuracy of personal identification using the feature extraction scheme proposed in [11] with a multiclass classifier. In this evaluation, feature extraction using two-dimensional information obtained by projection onto a two-dimensional image plane is adopted. This projection simulates an image acquisition process of a generic camera, where three-dimensional information cannot remain.
This paper is organized as follows. Section 2 explains the feature extraction scheme proposed in [11]. Section 3 shows how to construct feature vectors using two-dimensional information and experimental results using actual data obtained from twelve humans. Finally, Section 4 concludes this paper.
2.
Feature Extraction Based on Joint Motions
The origin of the coordinates of the joint positions obtained by the Kinect v2 is the location of the Kinect v2 device itself. In order to make the joint positions independent from the distance between the target human and the Kinect v2 device, we use relative vector whose start point is the coordinates of joint 0 described by the following equation:
𝒒𝑖,𝑡 = 𝒑𝑖,𝑡− 𝒑0,𝑡 (𝑖 = 1, 2, … , 24)
= (𝑙𝑖,𝑡− 𝑙0,𝑡, 𝑚𝑖,𝑡− 𝑚0,𝑡, 𝑛𝑖,𝑡− 𝑛0,𝑡) (1)
= 𝑙′
𝑖,𝑡, 𝑚′𝑖,𝑡, 𝑛′𝑖,𝑡
where 𝑙′𝑖,𝑡, 𝑚′𝑖,𝑡, and 𝑛′𝑖,𝑡 are the x-, y-, and z-components of the vector 𝒒𝒊,𝒕, respectively. This coordinate
transformation enables feature extraction that is not affected by the distance between the target human and the Kinect v2 device. Here, we would like to construct feature vectors by concatenating the obtained coordinates of the joint positions in the time series order. In order to create a feature vector that only includes the coordinates corresponding to one period of motion of a target human, a feature vector 𝒇𝒊 for
𝒇𝑖= 𝑙′𝑖,0, 𝑚′𝑖,0, 𝑛′𝑖,0, 𝑙′𝑖,1, 𝑚′𝑖,1, 𝑛′𝑖,1, … (2)
In the rest of this paper, the following notation where 𝒒𝒊,𝒕 is used instead of 𝑙′𝑖,𝑡, 𝑚′𝑖,𝑡, 𝑛′𝑖,𝑡 is used to
represent the same equation as Eq.2:
𝒇𝑖= 𝒒𝑖,0, 𝒒𝑖,1, 𝒒𝑖,2, … (3)
Here, this notation does not mean that 𝒇𝒊 has 𝒒𝒊,𝒕 as components. Note that this notation indicates that 𝒇𝒊 is constructed by concatenating the components of 𝒒𝒊,𝒕 as in Eq.2.
For normalization, the following two operations are applied to a raw feature vector obtained by the above processes. One is a process that expands the walking period of a signal to make it constant for different persons and the other is a process that inserts sample points for the expanded signal to make the number of sample points for the signal corresponding to the walking period constant. In this normalization, the position of a new sample 𝒒 can be computed by the following equation:
𝒒 =𝑑 1
𝑙+𝑑𝑟 𝑑𝑟∙ 𝒒𝒍+ 𝑑𝑙∙ 𝒒𝒓 (4)
where 𝒒𝒍 and 𝒒𝒓 are the nearest samples on left and right sides, respectively. 𝑑𝑙 and 𝑑𝑟 represent the
distances along the axis of the time direction from a new sample 𝒒 to samples 𝒒𝒍 and 𝒒𝒓, respectively. As
shown in the equation, new sample points are generated by linear interpolation using the two nearest sample points of the extended signal.
In the proposed scheme, this normalization is applied to all joints represented by 𝒒𝒊,𝒕 (𝑖 = 1, … , 24) to
obtain a feature vector corresponding to each joint 𝑖. Therefore, the normalization in the proposed scheme can be represented by the following equation:
𝒒𝑖,𝑡 =𝑑 1
𝑙+𝑑𝑟 𝑑𝑟 ∙ 𝒒𝑖, 𝑡×𝑁new𝑁old + 𝑑𝑙∙ 𝒒𝑖, 𝑡×𝑁new𝑁old +1 (5)
where 𝑁old and 𝑁new are the numbers of samples before and after normalization, respectively. 𝑑𝑙 and
𝑑𝑟 are computed by the following equations:
𝑑l= 𝑡 × 𝑁𝑁old
new −
𝑁old
𝑁new (6)
𝑑𝑟 = 𝑡 × 𝑁𝑁old
new + 1 −
𝑁old
𝑁new (7)
Finally, a feature vector based on three-dimensional information is obtained by the following equation using 𝒒𝒊,𝒕 obtained by the above operations:
𝒇𝟑𝑫= 𝒒1,0, 𝒒2,0, … , 𝒒24,0, 𝒒1,1, 𝒒2,1, … , 𝒒24,𝑁old (8)
where 𝑁old = 𝑁new − 1, and this notation indicates that the vector 𝒇𝟑𝑫 is constructed by concatenating
the components of 𝒒𝒊,𝒕 as in Eq.2.
After this feature extraction, the classifier is constructed by a linear support vector machine with 𝒇𝟑𝑫.
Training and classification using actual data are detailed in the following section.
Kinect can obtain three-dimensional information but a generic camera cannot. To evaluate the classification performance by the feature extraction scheme proposed in [11] when a generic camera that can only obtain two-dimensional information is used, it is necessary to measure the classification performance when feature vectors are constructed with only two-dimensional information. To simulate this condition, the three-dimensional coordinates are converted to the two-dimensional coordinates on an image plane considering image acquisition of a camera. In the rest of this section explains coordinate transformation from a three-dimensional space to a two-dimensional image plane, feature extraction using two-dimensional information, how to obtain actual data for evaluation, and classification accuracy.
3.1.
Coordinate Transformation to 2D Planes Simulating A Generic Camera
Three-dimensional information obtained by the Kinect v2 is the coordinates as shown in Fig. 3. However, such information about three-dimensional locations cannot be obtained by a generic camera: it can only acquire the two-dimensional coordinates in an image plane. To obtain two-dimensional information that a generic camera can obtain, we apply coordinate transformation for the three-dimensional coordinates obtained from the Kinect v2 simulating image acquisition from a generic camera. In the field of image processing, a pinhole camera model and a perspective projection model are often adopted to model geometrical relations between a target object and an image on a plane of projection. In some cases, even lens models are used to represent such relations more accurately. These models can represent such geometrical relations strictly but needs several parameters such as the focal length, the distance between a camera and a target, etc. In this paper, such models are not adopted because the aim of this experiment is to evaluate the classification accuracy when depth information is removed that cannot be obtained from a generic camera. Therefore, the coordinate transformation described below is adopted.
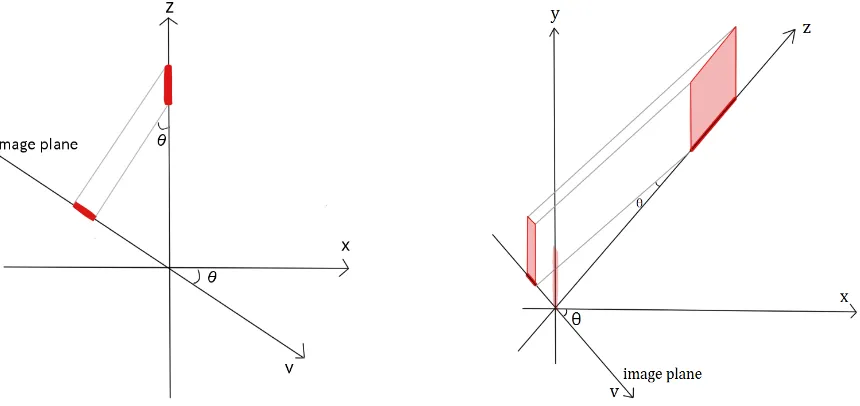
The coordinate transformation used in this evaluation can be depicted by Figs. 1 and 2. Fig. 1 shows a bird’s-eye view of a three-dimensional space and Fig. 2 is a view from the direction of the y-axis. As shown in Fig. 2, when a target is captured from a direction defined by 𝜃, an image corresponding to the target can be obtained by a orthogonal projection onto an image plane: the angle between the image plane and the
x-axis is 𝜃. The two-dimensional coordinates obtained by the orthogonal projection is computed by the following equations:
where (𝑣, 𝑤) means the two-dimensional coordinates in an image plane. 𝑣 = 𝑥 cos 𝜃 − 𝑧 sin 𝜃
𝑤 = 𝑦 (9)
3.2.
How to Create Feature Vectors Using 2D Information
When using the coordinate transformation described above, feature extraction using two-dimensional information can be executed by the following operations:
1. coordinate transformation from the three-dimensional to the two-dimensional coordinates, 2. computation of relative vector whose center is the pelvis,
3. normalization, and
4. generation of a two-dimensional feature vector f2D.
Actually, considering implementation cost for this experiment, feature extraction is performed by the following order:
1. computation of relative vector whose center is the pelvis,
2. normalization,
3. coordinate transformation from the three-dimensional to the two-dimensional coordinates, and 4. generation of a two-dimensional feature vector 𝒇𝟐𝑫.
operations and they are equivalent mathematically.
The obtained feature vector 𝒇𝟐𝑫 described by the following equation is obtained:
𝒇𝟐𝑫= 𝑣1,0, 𝑤1,0, 𝑣, 𝑤2,0, … , 𝑣24,Nold, 𝑤24,Nold
(10) where 𝑣𝑖,𝑗 and 𝑤𝑖,𝑗 are obtained by projecting a three-dimensional feature 𝒒𝒊,𝒕 onto a two-dimensional
plane corresponding to the exposure angle.
Fig. 1. A bird’s-eye view of a three-dimensional space. Fig. 2. A view from the direction of the y-axis.
3.3.
Acquisition of Actual Data for Evaluation
An overview of the experimental environment is shown in Fig. 3. In this experiment, target humans walk along the z-axis, as depicted in Fig. 3, without any restriction on clothes and shoes. Six male and six female humans in their twenties participated in the experiment. After this experiment, we can obtain three-dimensional position of 25 joints for a target human by Microsoft Kinect v2. The training and testing samples consists of three-dimensional coordinates corresponding to a walking period extracted manually as shown in Fig. 4. After unreliable data are removed from these samples based on reliability provided by the Kinect v2 device, the number of samples including both training and testing samples become 231.
3.4.
Accuracy of Personal Identification
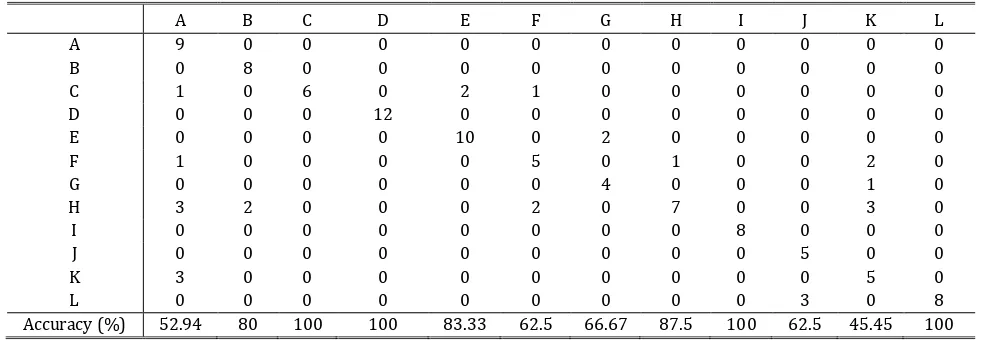
The experimental results using actual data with a multiclass classifier constructed by liblinear [12] are shown in the Tables from 1 to 6. In these confusion matrices, the column and the row of the table show predicted and actual labels, respectively. Here, Table 1 shows the classification accuracy using three-dimensional information directly: this is measured as a reference. Tables 2, 3, 4, 5, and 6 are the classification accuracy when the exposure angles are 0, 45, -45, 90, and -90, respectively. The average classification accuracy are 76.32%, 78.95%, 75.44%, 77.19%, and 77.19%, respectively: the average accuracy is calculated by dividing the number of correctly detected samples by the number of whole samples.
the motion is captured from right in front, though it seems difficult to achieve accurate classification by gait in the condition.
The average accuracy is moderate but the all of target cannot be classified accurately: the accuracy becomes 100% in the best case but it is only 45.45% in the worst case. The average accuracy can be improved to 91.03% that is better than other existing schemes if targets A, F, and K are removed from this experiments. By the results, the feature extraction scheme based on joint motions are capable to classify individual persons. To make the scheme more practical, it is indispensable to improve the scheme to deal with some targets that are not suitable for the scheme.
Fig. 3. Experimental environment. Fig. 4. Manual extraction of one walking period.
Table 1. Confusion Matrix (3D Information)
Table 2. Confusion Matrix (𝜃 = 0)
A B C D E F G H I J K L
A 9 0 0 0 0 0 0 1 0 0 0 0
B 0 8 0 0 0 0 0 0 0 0 0 0
C 1 0 6 0 2 1 0 1 0 0 0 0
D 0 2 0 12 0 0 0 0 0 0 0 0
E 0 0 0 0 10 0 2 0 0 0 0 0
F 2 0 0 0 0 7 0 0 0 0 0 0
G 0 0 0 0 0 0 4 0 0 0 1 0
H 3 2 0 0 0 0 0 4 0 0 4 0
I 0 0 0 0 0 0 0 0 8 0 0 0
J 0 0 0 0 0 0 0 0 0 5 0 0
K 3 0 0 0 0 0 0 0 0 0 6 0
L 0 0 0 0 0 0 0 0 0 3 0 8
Accuracy (%) 52.94 80 100 100 83.33 87.5 66.67 87.5 100 62.5 54.54 100
A B C D E F G H I J K L
A 9 0 0 0 0 0 0 0 0 0 0 0
B 0 8 0 0 0 0 0 0 0 0 0 0
C 1 0 6 0 2 1 0 0 0 0 0 0
D 0 0 0 12 0 0 0 0 0 0 0 0
E 0 0 0 0 10 0 2 0 0 0 0 0
F 1 0 0 0 0 5 0 1 0 0 2 0
G 0 0 0 0 0 0 4 0 0 0 1 0
H 3 2 0 0 0 2 0 7 0 0 3 0
I 0 0 0 0 0 0 0 0 8 0 0 0
J 0 0 0 0 0 0 0 0 0 5 0 0
K 3 0 0 0 0 0 0 0 0 0 5 0
L 0 0 0 0 0 0 0 0 0 3 0 8
Table 3. Confusion Matrix (𝜃 = 45)
Table 4. Confusion Matrix (𝜃 = −45)
A B C D E F G H I J K L
A 9 0 0 0 0 0 1 0 0 0 0 0
B 0 7 0 0 0 0 0 0 0 0 0 0
C 0 1 5 0 2 0 1 0 0 0 0 0
D 0 0 0 12 0 0 1 0 0 0 0 0
E 0 0 1 0 10 0 0 0 0 0 1 0
F 2 0 0 0 0 6 0 0 0 0 0 0
G 0 0 0 0 0 0 3 0 0 0 0 0
H 4 2 0 0 0 2 0 8 0 0 4 0
I 0 0 0 0 0 0 0 0 8 0 1 0
J 2 0 0 0 0 0 0 0 0 5 0 0
K 0 0 0 0 0 0 0 0 0 0 5 0
L 0 0 0 0 0 0 0 0 0 3 0 8
Accuracy (%) 52.94 70 83.33 100 83.33 75.0 50 100 100 62.5 45.45 100
Table 5. Confusion Matrix (𝜃 = 90)
A B C D E F G H I J K L
A 9 0 0 0 0 0 1 0 0 0 1 0
B 0 7 0 0 0 0 0 0 0 2 0 0
C 0 1 6 0 1 0 1 0 0 0 0 0
D 1 2 0 12 0 1 0 0 0 0 0 0
E 0 0 0 0 11 0 0 0 0 0 0 0
F 1 0 0 0 0 6 0 1 0 0 0 0
G 0 0 0 0 0 0 4 0 0 0 0 0
H 6 0 0 0 0 1 0 7 0 0 2 0
I 0 0 0 0 0 0 0 0 8 0 2 0
J 0 0 0 0 0 0 0 0 0 4 0 0
K 0 0 0 0 0 0 0 0 0 0 6 0
L 0 0 0 0 0 0 0 0 0 2 0 8
Accuracy (%) 52.94 70 100 100 91.66 75.0 66.67 87.5 100 50 54.54 100
Table 6. Confusion Matrix (𝜃 = −90)
A B C D E F G H I J K L
A 9 0 0 0 0 0 1 0 0 0 1 0
B 0 7 0 0 0 0 0 0 0 2 0 0
C 0 1 6 0 1 0 1 0 0 0 0 0
D 1 2 0 12 0 1 0 0 0 0 0 0
E 0 0 0 0 11 0 0 0 0 0 0 0
A B C D E F G H I J K L
A 9 0 0 0 0 0 0 0 0 0 1 0
B 0 8 0 0 0 0 0 0 0 3 0 0
C 0 0 6 0 1 0 2 0 0 0 0 0
D 0 1 0 12 0 1 0 0 0 0 0 0
E 0 0 0 0 11 0 0 0 0 0 0 0
F 1 0 0 0 0 6 0 0 0 0 0 0
G 0 0 0 0 0 0 4 0 0 0 0 0
H 7 1 0 0 0 1 0 8 0 0 3 0
I 0 0 0 0 0 0 0 0 8 0 1 0
J 0 0 0 0 0 0 0 0 0 4 0 0
K 0 0 0 0 0 0 0 0 0 0 6 0
L 0 0 0 0 0 0 0 0 0 1 0 8
F 1 0 0 0 0 6 0 1 0 0 0 0
G 6 0 0 0 0 0 4 0 0 0 0 0
H 0 0 0 0 0 1 0 7 0 0 2 0
I 0 0 0 0 0 0 0 0 8 0 2 0
J 0 0 0 0 0 0 0 0 0 4 0 0
K 0 0 0 0 0 0 0 0 0 0 6 0
L 0 0 0 0 0 0 0 0 0 2 0 8
Accuracy (%) 52.94 70 100 100 91.66 75.0 66.67 87.5 100 50 54.54 100
4.
Conclusion
To obtain personal properties from gait becomes popular and some researches begin to try personal identification by gait. A primary approach for a gait analysis aims to construct a feature space from input images suitable for discrimination and to improve classification accuracy using machine learning schemes with the feature extraction. However, there are few researches show what is the most significant for a gait analysis considering a skeletal structure that might strongly relate to human’s gait. Considering this background, we made a hypothesis that joint motions might be different owing to skeletal structures and confirmed the hypothesis by evaluating classification performance of personal identification with feature extraction based on joint motions using actual data. In this evaluation, two-dimensional coordinates are generated from three-dimensional coordinates obtained from the Kinect v2 to simulate image acquisition of a generic camera. Experimental results show that the feature extraction based on joint motions can achieve moderate classification accuracy when feature vectors are constructed from only two-dimensional information in an image plane. In addition, the results include interesting knowledge: the classification accuracy is not degraded even if gait is measured from right in front. The average classification accuracy by the scheme was 78.95% but the proposed scheme can perfectly classify several targets in the best case. These results indicate that the proposed scheme can be improved when it is modified to treat some targets that are not currently suitable for the scheme. We will try to improve the classification accuracy for these targets in the future.
References
[1] Cao, L., Dikmen, M., Fu, Y., & Huang, T. S. (2008). Gender recognition from body. Proceeding of ACM Int.
Conf. Multimedia (pp. 725–728).
[2] Guo, G., Mu, G., & Fu, Y. (2009). Gender form body: A biologically-inspired approach with manifold learning. Proceeding of Asian Conf. Comput. Vis. (pp. 236-245).
[3] Collins, M., Zhang, J., Miller, P., & Wang, H. (2009). Full body image feature representations for gender profiling. Proceeding of Int. Conf. Comput. Vis. Workshop (pp. 1235-1242).
[4] Adjroh, D., Cao, D., Piccirilli, M., & Ross, A. (2010). Predictability and correlation in human metrology.
Proceeding of IEEE Int. Workshop on Information Forensics and Security (pp. 162-169).
[5] Cao, D., Chen, C., Adjeroh, D., & Ross, A. (2012). Predicting gender and weight from human metrology using a copula model. Proceeding of IEEE Int. Conf. Biometrics: Theory, Applications and Systems (pp. 162-169).
[6] Yoo, J. H., Hwang, D., & Nixon, M. S. (2005). Gender classification in human gait using support vector machine. Proceeding of Int. Conf. Advanced Concepts for Intelligent Vision Systems (pp. 138-145).
[7] Lee, L., & Grimson, W. E. L. (2002). Gait analysis for recognition and classification. Proceeding of IEEE
Int. Conf. Automatic Face and Gesture Recognition (pp. 148-155).
Authentication (pp. 284-294).
[9] Mannami, H., Makihara, Y., & Yagi, Y. (2009). Gait-based categorization and feature analysis of gender and age. IEICE Trans. on Information and Systems, J92-D, (8), 1373-1382.
[10]Wang, L., Tan, T., Ning, H., & Hu, W. (2003). Silhouette analysis-based gait recognition for human identification. IEEE Trans. Pattern Anal. Mach. Intell., 25, (12), 1505-1518.
[11]Miyamoto, R., & Aoki, R. (2015). Gender prediction by gait analysis based on time series variation on joint position. Journal of Systemics, Cybernetics and Informatics, 13(3), 75-82.
[12]Fan, R. E., Chang, K. W., Hsieh, C. J., Wang, X. R., & Lin, C. J. (2008). LIBLINEAR: A library for large linear classification. Journal of Machine Learning Research, (9), 1871-1874.
Ryusuke Miyamoto received the B.E. degree in industrial chemistry, the M.S. degree in communications and computer engineering, and the Ph.D. degree in communications and computer engineering from Kyoto University, Kyoto, Japan, in 1998, 2001, and 2007, respectively. He is currently a Senior Assistant Professor with the Department of Computer Science, Meiji University, Kanagawa, Japan. His current research interests include image processing, image recognition, and real-time processing. He is a member of IEEE, IEICE, IIEEJ, and IPSJ.