Comparative Analysis of Classification
Algorithms for Student Performance
Veena N Guruprasad S
Assistant Professor Assistant Professor
Department of Information Science Engineering Department of Computer Science & Engineering BMSIT&M, Bangalore, Karnataka BMSIT&M, Bangalore, Karnataka
Abstract
This paper aims to present a model for the students performance. The predictive model was developed based on students performance in the second semester. Classification techniques from Data mining were applied to develop the models like Naïve Bayes, Support Vector Machine (SMO) and K-nearest neighbors (IBK). Comparative analysis is conducted on the three selected algorithms to find the best classification model. Moreover, this research also aims to find out the most influential subjects’ grades on their study duration. Courses, gender, and grades that serve as the independent parameters to predict the dependent parameter. The resulting models of the three algorithms show no significant difference between Naïve Bayes and SVM performances, while K-NN has the highest performance. Basic subject’s grades found to be the most influence parameter to the students’ study duration, followed by general subjects, grades, gender, and major subjects grades parameters.
Keywords: Naïve Bayes, Support Vector Machine(SMO), K-nearest neighbors(IBK), Classification Algorithms, Student Performance
________________________________________________________________________________________________________
I. INTRODUCTION
Facing the growth of academics is a challenge for a higher education institution, not only in terms of data storage management but also how to utilize the data appropriately to improve the quality of managerial decisions as well as the educational performance of students and faculty members. The huge number of data makes it difficult to analyse them manually; it takes a long time and complicated process. Data mining; also known as knowledge mining, knowledge extraction, information discovery, data analysis [1, 2], provides solutions for this problem. To transform raw data into useful information and knowledge, data mining adopts techniques and algorithms of multiple science discipline including databases, statistics, machine learning and artificial intelligence. In educational environment, data mining techniques have been widely used to extract and retrieve valuable information related to the students, faculties, and management, in order to improve the quality of educational process and institution management. Implementation of data mining in education is known as educational data mining (EDM). EDM is defined as the application of data mining techniques to extract, discover, and learn the knowledge of students’ behaviour patterns which have not been identified yet, that are stored in academic database. It aims to identify the relationships among variables related to students learning, measuring learning process, and analyses and improve students’ performance, making predictions, improve student retention, and analyse dropout rate. Data mining is data analysis methodology used to identify hidden patterns in a large data set. It has been successfully used in different areas including the educational environment. Educational data mining is an interesting research area which extracts useful, previously unknown patterns from educational database for better understanding, improved educational performance and assessment of the student learning process. Evaluating students’ performance is a complex issue, which can’t be restricted for the grading, hence modelling student performance, can be a great tool for both educators as well as students, to make correct adjustments to the curriculum activities as well as the teaching methods and by allowing the administration to improve the systems performance and managing tasks. Nevertheless, these data have not been fully utilized, while they are potentially providing valuable knowledge about students’ academic performance. The models will predict students study duration based on their academic performance, the grades. This may help faculty management staff to properly counsel the students to improve their overall academic performance, in order to complete the course on the specified duration.
II. METHODOLOGY
Fig. 1: Methodology
Understanding of the Problem Domain
This first step aims to understand the scope of the problem to be solved using data mining techniques, as well as determining objectives or expected output of data mining process
Understanding of the Data
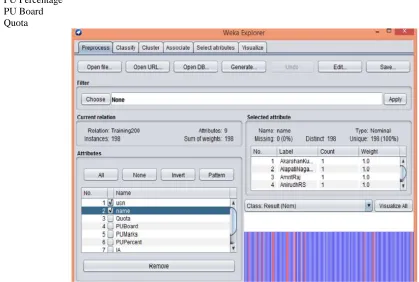
This second step did the data collection and selection. Data format and size are specified. A total of 200 data of Information Science students, who have completed their degree, are obtained from SIU database. The data contain students’ academic information from intakes. Two separate Excel files were extracted as follows[6]:
Preparation of the Data
This step includes extraction and transformation, to create student grade dataset. 1) Data Extraction.
2) Data Transformation 3) Data Mining
4) Evaluation of the Discovered Knowledge
III. RESULTS
Experimental results are discussed in this section. The goal is to develop a study duration predictive model of students, based on their performance in the second semesters, using input parameters. They are analysed using data mining classification techniques.
Table – 1 Accuracy
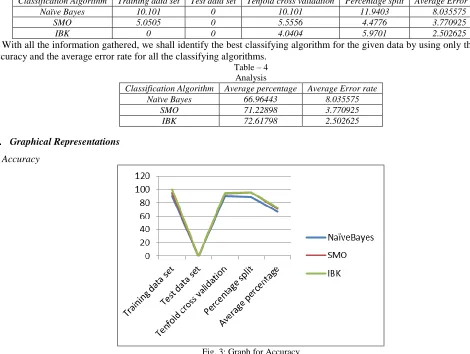
Classification Algorithm Training data set Test data set Tenfold cross validation Percentage split Average percentage
Naïve Bayes 89.899 0 89.899 88.0597 66.96443
SMO 94.9495 0 94.444 95.5224 71.22898
IBK 100 0 94.9495 95.5224 72.61798
Table – 2
Time taken to build the Model Classification
Algorithm
Training data set in sec
Test data set in sec
Tenfold cross validation in sec
Percentage split in sec
Average time taken to build a model percentage
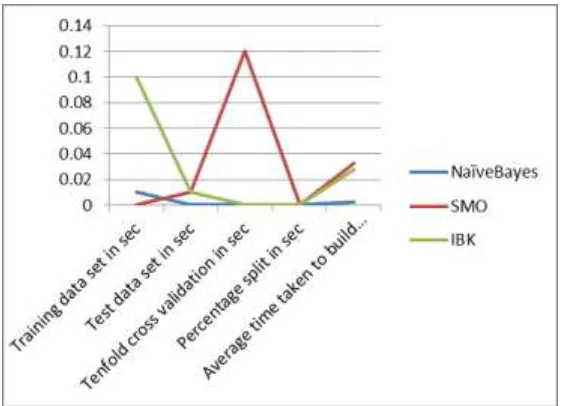
Naïve Bayes 0.01 0 0 0 0.0025
SMO 0 0.01 0.12 0 0.0325
IBK 0.1 0.01 0 0 0.0275
Table – 3 Error Rate
Classification Algorithm Training data set Test data set Tenfold cross validation Percentage split Average Error rate
Naïve Bayes 10.101 0 10.101 11.9403 8.035575
SMO 5.0505 0 5.5556 4.4776 3.770925
IBK 0 0 4.0404 5.9701 2.502625
With all the information gathered, we shall identify the best classifying algorithm for the given data by using only the average accuracy and the average error rate for all the classifying algorithms.
Table – 4 Analysis
Classification Algorithm Average percentage Average Error rate
Naïve Bayes 66.96443 8.035575
SMO 71.22898 3.770925
IBK 72.61798 2.502625
Graphical Representations
Accuracy
Time taken to build the model
Fig. 4: Graph for Time taken to build the model
Error Rate
Fig. 5: Graph for Error Rate
Average
SMO. The performance of KNN, Naïve Bayes, and SVM are given in Tables. To classify the study duration correctly from training dataset, accuracy and error rates are calculated. Table presents the performance comparison of the three algorithms via values of weighted average.
IV. CONCLUSION
Predicting student performance is mostly useful to help the educators improving their learning and teaching process. It will help the educational system to monitor the student performance in a systematic way. In future work, we will investigate more features of student data (attributes) and apply these classifiers with larger dataset and then, compare with other techniques.
As in all data mining applications, Pre-processing took most amount of resources. The original data set retrieved had to be in the right format. Weka is very particular about compatibility. Once the data was ready, it was just left to implementing the algorithms and gathering their results, and with the results we concluded that the k-nearest neighbor had the best results as compared to Naïve Bayes and SMO.
REFERENCES
[1] “Predicting Instructor Performance Using Data Mining Techniques in Higher Education”, Mustafa Agaoglu, IEEE 2016
[2] “A Review on Predicting Students’ Academic Performance Earlier, Using Data Mining Techniques”, P. Kavipriya, International Journal of Advanced Research in Computer Science and Software Engineering, December 2016.
[3] “Data Mining: Prediction for Performance Improvement of Graduate Students using Classification”, Kamal Bunkar, Rajesh Bunkar, Umesh Kumar Singh and Bhupendra Pandya, 2014.
[4] “Evaluation of Data Mining Classification Algorithms for Predicting Students Performance in Technical Trades” , Ukwueze Frederick N., Okezie Christiana C, August 2016.
[5] Evaluation of Open Source Data Cleaning Tools: Open Refine and Data Wrangler, Per k Larsson, June 2015. [6] Weka Machine Learning Project, http://www.cs.waikato.ac.nz/~ml/weka/index.html.