“TEACHER’S JOB SATISFACTION IN
PRIVATE SCHOOLS”
(A STUDY WITH SPECIAL REFERENCE TO CHEYYAR TOWN)
Dr. J. EZHILARASI
Associate Professor & Head in Commerce, Indo-American College, Cheyyar.
S. VIJAYAN
Assistant Professor in Commerce, Indo-American College, Cheyyar.
Abstract
Job satisfaction is one of the most widely discussed issues in organizational behavior and Human Resource Management. In present study the researcher investigated the present level of job satisfaction among the private school teachers. In this research all most covered private schools in cheyyar town. The obtained data were analyzed based on the descriptive statistics using SPSS Version 16. Independent sample Chi-squire test has been used in this study to analyze the job satisfaction level among Gender and job satisfaction level among Monthly income of Private school teachers. The study revealed that there is no significant difference in the level of satisfaction of Gender and there is significant difference in the level of satisfaction of Monthly income. Furthermore, it was again revealed that there is no significant difference in the level of satisfaction of Private school teachers.
I.INTRODUCTION
Job satisfaction is the contribution of two words -„job‟ and „satisfaction‟. Job is an occupational activity performed by an individual in return for is ward. Job satisfaction portrays the perception of the person towards his or her job, job related activities and environment. It is a combination of psychological and emotional experiences at work. Satisfaction refers to inner containment or happiness for the person engaged in
any job. It shows the relationship between „what one expects‟ and „what one achieves‟, No task can effectively be accomplished unless a person derives enough of satisfaction out of it because the work plays an important role in the life of a man. Job satisfaction is determined by how well the result of the job meets the expectations of the employee or they exceed the expectations. Some important factors influencing job satisfaction may be classified in two categories.
Environmental factors:-Job content, Occupational level, Pay and Promotion, Work group and Supervision.
Personal factors: - Age, Sex, Educational level, Marital status and Experience.
Weiss (2007) has argued that job satisfaction is an attitude but points out that researchers should clearly distinguish the objects of cognitive evaluation which are affect (emotion), beliefs and behaviors. This definition suggests that we from attitudes towards our jobs by taking into account our feelings, our beliefs, and our behaviors. Determinants of Job satisfaction:
Several elements contribute to job satisfaction. These are enumerated below:-
Nature of job , Nature of supervision, Working
Job and personal security and Employee morale Dissatisfaction of an individual
Review of Literature
Khatoon and Hasan (2000)probed the job satisfaction of secondary school teachers in relation to their religion. The findings revealed that the majority of teachers liked their jobs and female teachers had a greater degree of job satisfaction than the male teachers. The fresher teachers drawing less salary were more satisfied than their seniors who were experienced and drawing higher salaries. It was found that the teachers‟ training influenced job satisfaction negatively whereas religion did not have any effect on the teachers‟ job satisfaction.
Vyas (2002) studied the job satisfaction of school teachers with reference to sex, marital status and educational qualifications. The objective was to assess the job satisfaction of male and female married and unmarried teachers with higher and minimum educational qualification. The findings indicated that sex was not related to job satisfaction and married teachers possessed more positive towards job satisfaction than the unmarried teachers. Also, educational qualifications were not found to be related to job satisfaction of teachers.
Mary and Raj (2005) studied job satisfaction of government school teachers with respect to a) gender, b) medium of instruction, c) locality, d) educational qualifications, e) salary, f) subjects, g) type of schools, h) age, and i) experience. No significant difference was found in the job satisfaction of teachers with respect to the above said variables. It indicated that the job satisfaction of government school teachers of overall and at all levels in the region was not high and they possessed average level of job satisfaction. However, the mean scores revealed that the female teachers had average job
satisfaction and medium of instruction, locality and religion contributed significantly to job satisfaction. Kumar & Bhatia (2011) mentioned that the level of job satisfaction and attitude of the teachers towards teaching is least affected by the gender, the marital status, minimum qualification and income group of physical Education teachers to compare the job satisfaction among Physical Education teachers and their attitude towards teaching.
Gupta, Pasrija and Bansal (2012)made a comparison of job satisfaction of secondary school teachers in relation to their some demographic variables such as gender, locality, qualifications, experience and type of schools. The findings reported significant differences in job satisfaction between male and female teachers indicating that female teachers were more satisfied than their male counterparts. Similarly, it revealed that more experienced teachers and teachers belonging to rural areas had better job satisfaction their counterparts. Further, the teachers having post-graduate qualifications and working in private schools were reported to be significantly better than their counterparts
II.OBJECTIVES
1. To identify the nature & Scope of Job Satisfaction.
2. The level of job satisfaction of teachers with references to their teaching experience. 3. The level of job satisfaction of teachers
according to their qualification.
4. To analyze the factors of job satisfaction. Research Design
Selection of study Area
Cheyyar Town was selected for conducting this survey.
Sample Size
The sample of the study consisted of the teachers working in Private schools restricted to Cheyyar town in the District of Tiruvannnamalai and the state of Tamil Nadu. The total sample is 100.
Primary Data
Primary data are those, which collected for the first time. The researcher collected the data from the respondent by contacting them using questionnaire prepared for the study.
Secondary data
Secondary data are those, which have already been collected by someone else. For the study secondary data were selected from documents provided by the firm.
Data Analysis
Gender
In India, the social set up has undergone rapid changes. Females have education; seek employment they want to be economically independent and also working various fields.
The respondents were asked to mention their sex in the questionnaire. Based on that, the following table has been formed. The composition of the sex of the respondents is shown in the table 4.1 given below
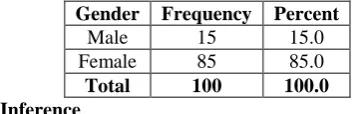
Table - 4.1 Gender wise Classification of the Respondents
Gender Frequency Percent
Male 15 15.0
Female 85 85.0
Total 100 100.0 Inference
From the above table it was founded that 15% of the respondents are Male and 85% of the respondents are Female.
Monthly Income
Individual or family income is another social – economic variable, frequently used in approximate social – class standing. Researchers, who take income as a measure of social class, use either amount or source of income as a popular estimate of social class standing.
The sample respondents were asked to indicate their monthly income of the family in the questionnaire. Based on the information, income groups identified are as follows: up to Rs.5,000, Rs.5,000–10,000, Rs.10,000-15,000 and above Rs.15,000. The composition of the income groups of the respondents is shown in the following table 4.5
Table – 4.5 Monthly Incomes of the Respondents
Income Frequency Percent
Below Rs.5,000 41 41.0
Rs.5,000 to 10,000 48 48.0
Rs.10,000 to 15,000 5 5.0
Above Rs.15,000 6 6.0
Total 100 100.0
Inference
From the above table, it was found that 41% of the respondents belongs to the income of up to Rs.5000, 48% of the respondents belongs to the income of Rs.5000 – 10000, 5% of the respondents belongs to the income of Rs.10000 – 15000 and remaining 6% of the respondents belongs to the income of Rs.15000 above.
Work Experience
The experience of the employees determines the perfection in the work, quality of work and productivity. An employee with lots of experience in a particular field can do any work with lot of perfection.
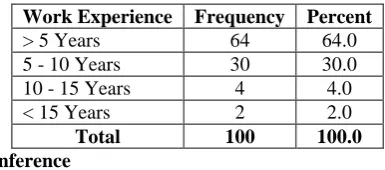
Table – 4.7 Frequency Distribution of Work Experience
Work Experience Frequency Percent
> 5 Years 64 64.0
5 - 10 Years 30 30.0
10 - 15 Years 4 4.0
< 15 Years 2 2.0
Total 100 100.0
Inference
Table 4.7 gives an analysis the work experience of the teachers. Out of 100 respondents, 64% of the respondents have less than five year experience, 30% of the respondents have work experience between 5 to 10years, 4% of the respondents have 10 to 15year work experience and remaining 2% of the respondents have more than 15years work experience.
Gender and Job Satisfactions
Is there is any association between gender of sample respondents and satisfaction with their job? The researcher is very much interested in finding answer to this question. For, he set a null hypothesis (H0) “There is no association between gender and satisfaction with their job”. The views of sample respondents are analysed. The null hypothesis is tasted with the help of 𝑥2 test and the
result is brought out in Table 4.25 as given below. Table No.4.25 Cross table for Gender and Job Satisfaction
Job Satisfaction Gender Total Male Female
Highly Satisfied 7 28 35
Satisfied 5 49 54
Dissatisfied 0 1 1
No comments 3 7 10
Total 15 85 100
Table No.4.25.1 Chi-Square Tests
Chi-Square Value df
P Value Pearson Chi-Square 4.023a 3 .259
Likelihood Ratio 3.979 3 .264
Linear-by-Linear
Association .127 1 .722
N of Valid Cases 100
a. 3 cells (37.5%) have expected count less than 5. The minimum expected count is .15.
Since p value (0.259) is more than 0.05, the H0 is accepted at 5% level of significance. That means, there is no association between gender and satisfaction with their job. This is because all the employees whether they are male or female derive the same amount of satisfaction from what they do. Satisfaction implies inner feelings towards some job, people with interest in a particular job will feel in the same way whether they are male or female.
Monthly Income and Job Satisfaction
If there is any significant between monthly income of sample respondents and satisfaction with this job, the researcher is very much interested in finding answer to the question. For, he set a null hypothesis (H0) “There is no association between monthly income and satisfaction with this job”. The views of sample respondents are analysed. The null hypothesis is tasted with the help of 𝑥2
test and the result is brought out in Table 4.26 as given below.
Table No.4.26 Cross table for Monthly Income and Satisfaction with this Job
Satisfied with this job
Income level (Monthly)
Total Below
Rs.5,000
Rs.5,000 to 10,000
Rs.10,000 to 15,000
Above Rs.15,000
Highly Satisfied 17 17 0 1 35
Satisfied 22 27 2 3 54
Dissatisfied 0 1 0 0 1
No comments 2 3 3 2 10
Table No.4.26.1 Chi-Square Tests
Chi-Square Value df
P Value Pearson Chi-Square 21.664a 9 .010 Likelihood Ratio 16.286 9 .061 Linear-by-Linear
Association 9.747 1 .002
N of Valid Cases 100
a. 12 cells (75.0%) have expected count less than 5. The minimum expected count is .05.
Since p value (0.010) is less than 0.05, the H0 is rejected at 5% level of significance. That means, there is association between monthly income of sample respondents and satisfaction with this job. The above result indicates that respondents‟ monthly income hope to do the job
well, so all the respondents are satisfied with job irrespective of monthly income.
Work Experience and Satisfied with this Job
Is there is any difference between work experiences and satisfied with this job? The researcher is very much interested in finding answer to the question. For, he set a null hypothesis (H0) “There is no significant difference between work experiences and satisfied with this job”. The views of sample respondents are analysed. The null hypothesis is tasted with the help of 𝑥2 test and the result is brought out in Table
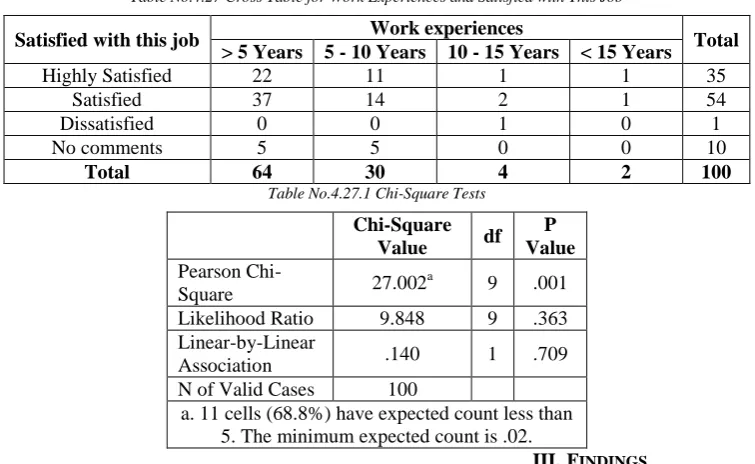
4.27 as given below. Table No.4.27 Cross Table for Work Experiences and Satisfied with This Job
Satisfied with this job Work experiences Total > 5 Years 5 - 10 Years 10 - 15 Years < 15 Years
Highly Satisfied 22 11 1 1 35
Satisfied 37 14 2 1 54
Dissatisfied 0 0 1 0 1
No comments 5 5 0 0 10
Total 64 30 4 2 100
Table No.4.27.1 Chi-Square Tests
Chi-Square Value df
P Value Pearson
Chi-Square 27.002
a 9 .001
Likelihood Ratio 9.848 9 .363 Linear-by-Linear
Association .140 1 .709
N of Valid Cases 100
a. 11 cells (68.8%) have expected count less than 5. The minimum expected count is .02.
Since p value (0.001) is less than 0.05, the H0 is rejected at 5% level of significance. That means, there is significant difference between work experiences and satisfaction with this job. This is because all the employees with different years of experience in a particular job gain the different amount of satisfaction from the work what they do. Experience does make much difference in the level of satisfaction of employees. People with plenty of experience can get more amount of satisfaction from their job like people with less experience get.
III.FINDINGS
An overwhelming majority of the respondents are
female.
A sizable percentage of sample respondents (48%)
monthly income level between Rs.5000 to 10000. A majority (64%) of the respondents is having less
than five year teaching experience.
There is no association between gender and
satisfaction with their job.
There is no association between monthly income
and satisfaction with this job.
There is no significant difference between work
IV.SUGGESTIONS &CONCLUSION
This Study shows that private school teachers are very sensitive as regards security of job and salary payment. The Private Sector should revise the salary structure. The authorities should include teachers at the time of restructuring their salary.
Analysis also reveals that the private school teachers show low satisfaction level regarding the factor “Work load & Working Time”. Therefore, Authorities should organize provide rewards and incentives should be given for extra working time and work load at the same time teacher‟s efforts should be highly appreciated by the school principal.
Study further shows that level of satisfaction among the private school teachers is low regarding “Opinion counts in the organization”. Authorities should arrange regular formal meeting with teachers to consider their suggestions and also try to value it.
Analysis also reveals that the private school teachers show low satisfaction level regarding the factor “opportunity for career development”. For increasing the satisfaction level of the teachers in this regards authorities should try to provide opportunity for career development to the teachers in this connection.
In this study area of Job satisfaction of Private School teachers, it helped to know that the theoretical back ground about the job satisfaction, how to measured and improve the job satisfaction of the teachers. World Wide Web also worked as a highly important information source as it provides updated information for the research related to various areas.
Most of the teachers felt that the security of job, Scale of salary, Working Time, Work load, opinion counts in the organization and opportunity for career Development is low satisfied of the
private schools and all other activities very much satisfied. So, Authorities should try revising the salary structure, rewards and incentives provided for extra work load and time, arrange regular formal meetings with teachers to consider their suggestions for opinion counts in the organization and Short courses and seminar should be organized on weekly or monthly basis to refresh and Motivate teachers for opportunity for career Development in this connection.
V.REFERENCE
1) Tilak raj. Dr & Lalita (2013). “Job Satisfaction among teachers of Private and Government school”. International Journal of Social Science & Interdisciplinary Research, 2(9), 151-158.
2) Gupta, C.B.(2009). Human Resource Management. New Delhi: Sultan Chand & Sons. P 30.2-30.7.
3) Smritikana Mitra Ghosh (2015). “ Job Satisfaction among Government and Private School Teachers”. The International Journal of Indian Psychology, 2(2), 87-93.
4) Farah Deeba Chugahati, Uzma Perveen (2013). “ A Study of Teachers workload and Job Satisfaction Public and Private Schools at Secondary level in Lahore city Pakistan”, Asian Journal of Social Sciences & Humanities, 2(1), 202-214.