MODELING MOTORCYCLE ACCIDENT SEVERITY IN THE
PHILIPPINES USING HELMET USE, RIDING EXPERIENCE,
AND DRIVING BEHAVIOUR
Rosemary R. Seva1
1 Industrial Engineering Department, Gokongwei College of Engineering De La Salle University, 2401 Taft Avenue, Malate, Manila, Philippines
Received 8 January 2017; accepted 12 June 2017
Abstract: The study aims to characterize motorcyclists’ behaviour in the Philippines and its relationship in predicting the type of injury sustained during an accident. It is hypothesized that violations are likely predictors of serious injury. A survey questionnaire was used to gather data on accident experience and severity, demography, driving experience, and helmet use. Driver behaviour was characterized using the Manchester Driver Behaviour Questionnaire. Logistic regression (LR) was used to model the chance of suffering from serious or minor injury during a MC accident. Significant predictors of serious injury are drunk driving, non-usage of helmets, and underestimating the speed of oncoming vehicle when overtaking. The first two are violations that have already been addressed enactment of laws. However, current behaviour showed that these laws did not change the behaviour of MC riders as expected. Results indicate that the use of helmets had been effective because most of the injuries were concentrated in the lower limbs. The length of MC driving experience did affect the seriousness of injury.
Keywords: motorcycle accident, Manchester driver behaviour questionnaire, logistic regression, crash typing.
1 Corresponding author: rosemary.seva@dlsu.edu.ph
1. Introduction
The rise in MC ownership in the Philippines led to the increase in the number of accidents related to its use. From 2004-2006, around 6.7% of trauma admission at the Philippine General Hospital (PGH) are victims of MC accidents (Consunji et al., 2013) and in a case study conducted in 2013 at the Manila Doctors Hospital 40.4% of injuries in the sample of 156 patient records were related to MC accidents (O’Connor and Ruiz, 2014).
accidents. Fatalities and injuries are recorded but data on MCs are not segregated for further analysis.
A comparative study of different vehicle users showed that MC riders are likely to experience craniocerebral injuries during accidents (Markogiannakis et al., 2006). Data collected from 70 countries on MC riders showed that the primary contributor to death rates is the helmet non-usage percentage (Abbas
et al., 2012). Thus, many countries enforce a helmet law to protect MC riders. Studies showed that use of helmets is associated with reduced mortality due to head and neck injury (Crompton et al., 2010; Rice et al., 2016). However, poor implementation of the law and the use of substandard quality of helmets adversely affect injury prevention. The use of novelty helmets that are lightweight and do not have energy absorbing liner may not give adequate protection against head injury (Erhardt et al., 2016).
The Philippine government has effected the Mandatory Helmet Act in 2010 that penalizes MC riders not using helmets. The Bureau of Product Standards was also mandated to test helmets that are sold in the country (Malig, 2010). Only helmets that have the Philippine Standard (PS) mark or the Import Commodity Clearance (ICC) provided by the Department of Trade and Industry (DTI) must be used. From a survey conducted by the Metro Manila Development Authority (MMDA), 98% use helmets but only 57% use it properly and 42% did not pass the helmet standards set by authorities (World Health Organization, 2016). The Land Transportation and Traffic Code of 1991 also prohibits driving under the influence of liquor and narcotics. The effectiveness of these interventions has yet to be evaluated.
The limited experience in riding a MC had been attributed by many researchers to accidents. A study of MC accidents in a hospital in Brazil showed that young riders with less than 5 years of experience are more likely to encounter accidents (Zabeu et al.,
2013). The same pattern was also observed among young riders in Norway (Bjornskau et al., 2012). Driving experience alone does not determine safe driving as Crundall (2013) discovered that MC riders with advance training had the fastest hazard response times compared to experienced riders. Similarly, Di Stasi et al., (2011) concluded that training improved the riding ability of novice users. Magazzu et al., (2006) also found out that MC riders that have experience driving cars are more likely to drive safely because of empathy.
In order to identify other methods of improving MC rider safety in the Philippines, the causes and circumstance of accident must be investigated further using current and unbiased data. The earlier claim that MC accidents are underreported in MMARAS was confirmed by the fact that in 2009, only 7% of accidents was attributed to MCs although most of them were fatal (Metro Manila Development Authority, 2011). One way of analyzing the how and why of an accident is by means of crash typing (Preusser et al., 1995). This type of analysis groups crash events based on causes such as driver behaviour, environment, and vehicle movement. Crash typing can determine the factors relevant to a crash type so that more appropriate laws for minimizing fatal accidents can be considered.
during an accident. It is hypothesized that violations are likely predictors of serious injury. Driver behaviour refers to lapses, errors, and violations (Lajunen et al., 2004). They can further be broken down into speeding violation, traffic errors, control errors, inattention errors, use of safety equipment, and stunts. The lack of data that characterizes driving behaviour of Filipinos at the moment makes it difficult for local authorities to identify appropriate interventions to prevent road accidents. The current study may be useful in creating awareness on the contribution of certain behaviours to major accidents. The data obtained in the study may also be used to contextualize the training programs given to MC drivers by companies and rider associations.
2. Method
2.1. Survey Questionnaire
Participants were interviewed using a questionnaire. They were asked regarding personal information, type of injury, MC experience, use of helmet, cause of accident and response to the Manchester Driver Behaviour Questionnaire (Lajunen
et al., 2004). The internal reliability of the questionnaire was measured using Cronbach ’s alpha and the computed value is 0.86. The MDBQ is a widely-used instrument for self-reported driving behaviour in literature including MC riders (Bener et al., 2007; Lajunen and Summala, 2003; Özkan et al., 2006). It measures three aspects of behaviour: errors (E), lapses (L) and violations (V) . The questionnaire was translated into the vernacular so it will be
easier for the interviewees to understand the questions. The questionnaire was piloted to determine if the questions had been appropriately translated and understood by potential survey respondents.
Data were collected from a convenience sample of MC riders in Metro Manila. Only drivers with at least one year experience in driving an MC were included in the survey. The survey method was chosen so that even minor accidents can be considered unlike the data reported in the MMARAS. For drivers who have encountered multiple accidents, the most severe accident encountered was asked to be recalled during the interview.
2.2. Variables and Measurements
In this study, there is only one response variable which is the type of injury sustained by the driver. Injuries were classified as serious and minor. Serious injury involves being hospitalized or failing to report for work for at least two days. Minor injury, on the other hand, involves having scratches, sprain, and small wound that do not hinder a person from working.
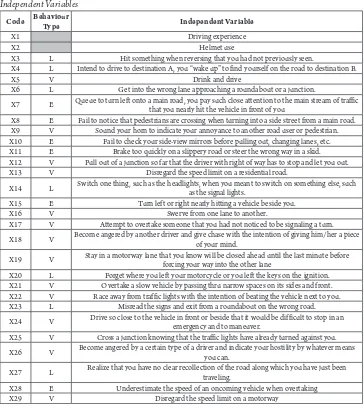
Independent variables used in the study include MC driving experience, helmet use, and response to the Manchester Driver Behaviour Questionnaire (MDBQ ). The list of independent variables and their codes in the model are summarized in Table 1. Driving experience is quantified in years while helmet use is a categorical variable with three levels, namely; 1-never, 2-occasional and 3-all the time. Variables X3-X29 are
Table 1
Independent Variables
Code Behaviour Type Independent Variable
X1 Driving experience
X2 Helmet use
X3 L Hit something when reversing that you had not previously seen.
X4 L Intend to drive to destination A, you “wake up” to find yourself on the road to destination B.
X5 V Drink and drive
X6 L Get into the wrong lane approaching a roundabout or a junction.
X7 E Queue to turn left onto a main road, you pay such close attention to the main stream of traffic that you nearly hit the vehicle in front of you
X8 E Fail to notice that pedestrians are crossing when turning into a side street from a main road.
X9 V Sound your horn to indicate your annoyance to another road user or pedestrian.
X10 E Fail to check your side-view mirrors before pulling out, changing lanes, etc.
X11 E Brake too quickly on a slippery road or steer the wrong way in a skid.
X12 V Pull out of a junction so far that the driver with right of way has to stop and let you out.
X13 V Disregard the speed limit on a residential road.
X14 L Switch one thing, such as the headlights, when you meant to switch on something else, such as the signal lights.
X15 E Turn left or right nearly hitting a vehicle beside you.
X16 V Swerve from one lane to another.
X17 V Attempt to overtake someone that you had not noticed to be signaling a turn.
X18 V Become angered by another driver and give chase with the intention of giving him/her a piece of your mind.
X19 V Stay in a motorway lane that you know will be closed ahead until the last minute before forcing your way into the other lane
X20 L Forget where you left your motorcycle or you left the keys on the ignition.
X21 V Overtake a slow vehicle by passing thru narrow spaces on its sides and front.
X22 V Race away from traffic lights with the intention of beating the vehicle next to you.
X23 L Misread the signs and exit from a roundabout on the wrong road.
X24 V Drive so close to the vehicle in front or beside that it would be difficult to stop in an emergency and to maneuver.
X25 V Cross a junction knowing that the traffic lights have already turned against you.
X26 V Become angered by a certain type of a driver and indicate your hostility by whatever means you can.
X27 L Realize that you have no clear recollection of the road along which you have just been traveling.
X28 E Underestimate the speed of an oncoming vehicle when overtaking
X29 V Disregard the speed limit on a motorway
2.3. Participants
Three hundred participants were recruited for the study. They were not given any incentive to respond to the survey. They are MC riders that have at least one year experience. Ninety-one percent (91%) of
2.4. Procedure
Participants were recruited from all over Metro Manila. Prospective participants were courteously asked about the length of their experience as MC drivers in order to exclude those with less than one year experience. They were asked about their interest to participate in a safety survey and were assured that their responses will be kept confidential. Only 50% of all drivers approached expressed willingness to answer the survey.
Drivers who agreed to participate were briefed regarding the overall objective of the survey and were asked to recall the most serious accident they experienced while riding the MC. Those without accidents were also allowed to answer the survey. A briefing script was prepared to ensure the uniformity of instructions.
Three hundred drivers participated in the survey but only 233 encountered accidents and were injured. All willing participants were interviewed using the survey form developed in both English and Filipino.
2.5. Statistical Model
Logistic regression (LR) was used to model the chance of suffering from serious or minor injury during a MC accident. The logistic regression model was deemed appropriate for
analyzing the results because the dependent variable is categorical with only two levels (DeMaris, 1992). In this LR model, the “event” predicted is a serious injury. The dependent variable INJS estimates the odds (logit) of a serious injury expressed in Eq. (1):
(1) The model’s goodness of fit was ascertained using Hosmer- Lemeshow (HL) test that follows chi- square distribution (Hair et al.,
2010). As such, the p-value must be large to indicate the model’s capability to predict actual outcome.
3. Results
3.1. Profile of Participants
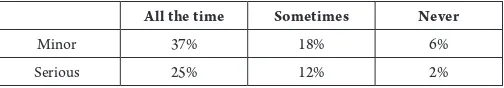
The average experience of participants is 8.1 years with a maximum of 40 years. Table 2 shows the relationship between type of accident and frequency of helmet use. It can be seen that most participants (61%) encountered only minor injuries and majority (62%) always wore helmet. Of those not wearing helmets, the most common reason given is uncomfortable, hot, and heavy (74%). Those who wore helmets complied mainly due to safety reasons (80%) and the Helmet law (20%) recently implemented. Only one participant had training on safe and proper MC riding.
Table 2
Contingency Table for Helmet Use
All the time Sometimes Never
Minor 37% 18% 6%
3.2. MDBQ Statistics
Responses obtained from the MDBQ were categorized based on the type of injury sustained. Table 3 shows the means and standard deviation of ratings obtained per question. It can be seen that the average rating given to MDBQ ranged from 2 (hardly ever) to 3 (occasionally). Median rating obtained for all questions independent of injury is 2.
Considering the descriptive statistics obtained on MDBQ responses, majority of the respondents do not engage in risky behaviour.
Serious injury sustained are concentrated on the legs (36%) and knee (35%) while minor injuries were concentrated on the knee (48%). Head trauma was only suffered by 6% of participants with serious injuries.
Table 3
Descriptive Statistics for MDBQ Responses
CODE Behaviour
Type
Overall Mean
MINOR (n=142) SERIOUS (n=91)
mean SD mean SD
X3 L 1.75 1.73 0.64 1.78 0.71
X4 L 2.02 2.01 0.75 2.03 0.81
X5 V 2.33 2.21 0.82 2.51 0.89
X6 L 2.29 2.26 0.81 2.33 0.90
X7 E 2.28 2.31 0.82 2.24 0.91
X8 E 2.24 2.27 0.78 2.18 0.75
X9 V 2.52 2.54 0.88 2.51 0.96
X10 E 2.26 2.22 0.86 2.33 1.03
X11 E 2.06 2.06 0.74 2.08 0.76
X12 V 2.08 2.13 0.74 2.01 0.85
X13 V 2.54 2.48 0.93 2.64 0.91
X14 L 2.12 2.15 0.81 2.08 0.78
X15 E 2.37 2.40 0.71 2.33 0.68
X16 V 2.46 2.46 0.85 2.46 0.97
X17 V 2.28 2.22 0.81 2.38 0.83
X18 V 2.06 2.04 0.72 2.08 0.81
X19 V 2.18 2.15 0.70 2.22 0.85
X20 L 2.26 2.31 0.88 2.18 0.84
X21 V 2.34 2.32 0.81 2.37 0.86
X22 V 2.33 2.25 0.79 2.45 0.85
X23 L 2.11 2.11 0.68 2.11 0.81
X24 V 2.26 2.28 0.74 2.23 0.82
X25 V 2.22 2.23 0.78 2.20 0.73
X26 V 2.26 2.22 0.78 2.33 0.80
X27 L 2.09 2.10 0.82 2.07 0.80
X28 E 2.16 2.08 0.73 2.29 0.79
3.3. Causes of Accident
Participants were asked for the cause of accident and as shown in Table 4, the most common reason is recklessness in driving. This is closely followed by
environment-related factors such as unsafe road conditions, poor street lighting at night, presence of humps and potholes and sudden appearance of road distractions. Only 9% of participants attributed their accident to drunk driving and 4% to poor vehicle maintenance.
Table 4
Causes of Accidents
Causes Percentage
Reckless 23
Environment 22
Slipped on the road 17
Other Drivers 12
Drunk 9
Personal 6
Poor vehicle maintenance 4
Total 100
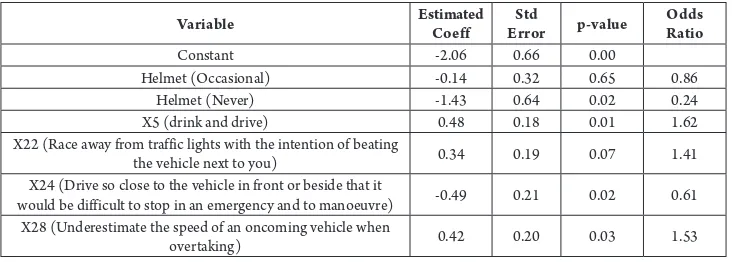
3.4. Logistic Regression
The estimated coefficients, standard error, and odds ratios of the logistic regression model is shown in Table 5. Outcome of logistic regression showed that the use of helmet, drinking and driving (X5), driving so close to the vehicle in front or beside that it would be difficult to stop in an emergency and to maneuver (X24), and underestimating the speed of an oncoming vehicle when
overtaking (X28) are significant variables in the model (LLL=-145.4, G=20.77, df=6, p<0.01). Hosmer-Lemeshow test yielded a p-value of 0.208.
The base level used for helmet in the model is wearing it all the time. The negative parameter estimate indicates that occasional and not wearing helmets when riding a MC affect the chance of suffering from serious injury.
Table 5
Estimated Coefficients, Standard Error, and Odds Ratios of Reduced Logit Model
Variable Estimated Coeff ErrorStd p-value Odds Ratio
Constant -2.06 0.66 0.00
Helmet (Occasional) -0.14 0.32 0.65 0.86
Helmet (Never) -1.43 0.64 0.02 0.24
X5 (drink and drive) 0.48 0.18 0.01 1.62
X22 (Race away from traffic lights with the intention of beating
the vehicle next to you) 0.34 0.19 0.07 1.41
X24 (Drive so close to the vehicle in front or beside that it
would be difficult to stop in an emergency and to manoeuvre) -0.49 0.21 0.02 0.61
X28 (Underestimate the speed of an oncoming vehicle when
The logit model obtained is shown in Eq. (2):
(2)
4. Discussion
The result of the study confirmed earlier studies that wearing helmet reduces the injury of MC riders in case of accidents (Savolainen and Mannering, 2007). The studies done on helmets showed its effectiveness in the prevention of fatal injuries. Fatal injuries usually involved the head and face (Fernandes et al., 2013) but the injuries suffered by the injured participants in the current study were mostly in the knees and arms which are the most common site of most MC accidents (Wladis et al., 2002). Since most of the participants interviewed wore helmets head trauma incidence was very minimal at 6% of the total number of participants. Only a small percentage (8%) did not wear helmets at all. The high compliance in wearing helmets can be traced to the recently implemented Helmet Law. In a recent report of WHO on road safety the Philippines was given a rating of 6/10 on the enforcement of this law (World Health Organization, 2015). This was not the case in 2004-2006 when only 13% of MC accident patients admitted at PGH wore helmets (Consunji et al., 2013). The high significance and the negative coefficient of the variable “never wearing a helmet” in Table 5 indicates its detrimental effect in comparison to the base level (always wearing a helmet). Although the mean ratings obtained from MDBQ were relatively low as can be seen in Table 3, riders tended to disregard speed limit on a residential road, sound horn to express disannoyance, swerve from one lane to another, and disregard speed limit
Organization gave the Philippines a rating of 1 out of 10 in the enforcement of this law in 2015 (World Health Organization, 2015). Participants that underestimated the speed of oncoming vehicles when overtaking are more likely to suffer serious injury. Such miscalculation will cause the MC to crash with the oncoming vehicle and the severity increases in relation to speed. Leung and Starmer (2005) discovered that the speed of slower vehicles are more likely to be underestimated. A slow moving vehicle gives confidence to the rider that the gap is acceptable. Such confidence lead the rider to overtake only to realize that the time is not enough. Careless overtaking had been observed among young riders (Leung and Starmer, 2005). However, in the current study there is no significant difference in the age of participants that suffered minor and serious injury.
Driving too close to the vehicle in front or beside is a significant predictor of the chance of serious injury in the model. The behaviour of driving too close had been observed in most MC riders especially younger ones (Steg and Brussel, 2009). The negative coefficient indicates that it negatively contributes to the chance of serious injury probably because this behaviour is only exhibited during traffic jams and not when driving high speeds. Thus, when accidents occur most riders suffer only minor injury. Based on the outcome of this study several policy recommendations can be given. Results showed that significant predictors of serious injury are violations except one error which is underestimating the speed of oncoming vehicle while overtaking. Despite the implementation of the helmet law only
62% of riders always wore helmets in the sample. WHO reported that the helmet wearing rate in the Philippines is only 51% which is low compared to its neighboring countries of Indonesia (80%), Malaysia (97%), and Vietnam (96%) (World Health Organization, 2015). Helmet wearing rate can be increased by strictly implementing the law and user education. MC riders especially younger ones are unmindful of the dangers of not wearing helmets or improperly wearing it. Thus information campaign can dwell on these two issues. Since young people tend to exhibit more risky behaviour such campaigns can be done in social media by local authorities to reach the target audience. MC riding seminars can also be conducted in large universities and offices to increase awareness on riding safety.
5. Conclusion
Significant predictors of serious injury are drunk driving, non-usage of helmets, and underestimating the speed of oncoming vehicle when overtaking. The first two are violations that have already been addressed enactment of laws. However, current behaviour showed that these laws did not change the behaviour of MC riders as expected. The passing of the Helmet Law slightly increased the compliance rate though. Results indicate that the use of helmets had been effective because most of the injuries were concentrated in the lower limbs. The length of MC driving experience did affect the seriousness of injury. The driver behaviour of Filipinos was characterized in this study and the results were related to the severity of accidents that MC riders experience. Authorities may be prompted by the results to identify suitable interventions that can curb unsafe behaviour on the road and target specific groups. The government can consider policies on continuous training of MC drivers in MC handling and safe road behaviour. At present, the country does not impose mandatory training of MC drivers much so re-training them after sometime.
Future studies on motorcycle accidents can focus on understanding specific concerns of MC drivers. The current study showed that there is a problem underestimating the speed of oncoming vehicle, thus, the next study can focus on the causes of this error. Government institutions can also help consolidate data on severity of MC injuries and profile of accidents in hospitals for accident researchers to use.
6. References
Abbas, A.K.; Hefny, A.F.; Abu-Zidan, F.M. 2012. Does wearing helmets reduce motorcycle-related death? A global evaluation, Accident Analysis & Prevention 49: 249-252.
Alavaren, A. 2016. MMDA taps MB as partner in implementing anti-drunk driving law. Available from internet: <http://mb.com.ph/>.
Bener, A.; Crundall, D.; Haigney, D.; Bensiali, A.K.; Al-Falasi, A.S. 2007. Driving behaviour, lapses, errors and violations on the road: United Arab Emirates study,
Advances in Transportation Studies an international Journal Section A 12: 5-14.
Bjornskau, T.; Naevestad, T.O.; Akhtar, J. 2012. Traffic safety among motorcyclists in Norway: a study of subgroups and risk factors, Accident Analysis & Prevention
49: 50-57.
Consunji, R.J.; Larona, A.J.L.; Jumangit, I.; Ambrosio C.; Ameratunga, S.N. 2013. Motorcycle-related Trauma in the Philippines Resulting in Hospital Admission: the Epidemiolog y of Cases at the Philippine General Hospital, Acta Medica Philippina
47(3): 11-14.
Crompton, J.G.; Oyetunji, T.; Stevens, K.A.; Efron, D.T.; Haut, E.R.; Haider, A.H. 2010. Motorcycle helmets save lives, but not limbs: a National Trauma Data Bank analysis of functional outcomes after motorcycle crash,
Journal of surgical research 158(1): 1-5.
Crundall, D.; van Loon, E.; Stedmon, A.W.; Crundall, E. 2013. Motorcycling experience and hazard perception,
Accident Analysis & Prevention 50: 456-464.
DeMaris, A. 1992. Logit modeling: Practical applications.
Di Stasi, L.L.; Contreras, D.; Cándido, A.; Cañas, J.J.; Catena, A. 2011. Behavioral and eye-movement measures to track improvements in driving skills of vulnerable road users: First-time motorcycle riders, Transportation Research Part F: Traffic Psychology and Behaviour 14(1): 26-35.
Erhardt, T.; Rice, T.; Troszak, L.; Zhu, M. 2016. Motorcycle helmet type and the risk of head injury and neck injury during motorcycle collisions in California,
Accident Analysis & Prevention 86: 23-28.
Fernandes, F.A.O.; Alves de Sousa, R.J. 2013. Motorcycle helmets - A state of the art review, Accident Analysis & Prevention 56: 1-21.
Francisco, K. 2015. Road deaths in PH: Most are motorcycle riders, pedestrians. Available from internet: <http://www.rappler.com/nation/110789-road-safety-report-2015-who-philippines>.
Hair, J.F.; Black, B.; Babin, B.; Anderson, R.E.; Tatham, R.L. 2010. Multivariate Data Analysis. 7th ed. Prentice Hall, Englewood Cliffs, NJ. 846 p.
Imperio, C. 2015. Motorcycle crash deaths on the rise - study. Available from internet: <http://www.philstar. com/metro/2015/11/29/1527074/motorcycle-crash-deaths-rise-study>.
Lajunen, T.; Parker, D.; Summala, H. 2004. The Manchester Driver Behaviour Questionnaire: a cross-cultural study, Accident Analysis and Prevention 36: 231-238.
Lajunen, T.; Summala, H. 2003. Can we trust self-reports of driving? Effects of impression management on driver behaviour questionnaire responses, Transportation Research Part F: Traffic Psychology and Behaviour 6(2): 97-107.
Leung, S.; Starmer, G. 2005. Gap acceptance and risk-taking by young and mature drivers, both sober and alcohol-intoxicated, in a simulated driving task, Accident Analysis and Prevention 37(6): 1056-1065.
Libres, G.T.C.; Galvez, M.L.I.; Cordero, C.J.N. 2008. Analysis of Relationship between Driver Characteristic and Road Accidents along Commonwealth Avenue. Available from internet: <http://www.ncts.upd.edu.ph>.
Magazzu, D.; Comelli, M.; Marinoni, A. 2006. Are car drivers holding a motorcycle licence less responsible for motorcycle-car crash occurrence? A non-parametric approach, Accident Analysis and Prevention 38(2): 365-370.
Maistros, A.; Schneider, W.H.T.; Savolainen, P.T. 2014. A comparison of contributing factors between alcohol related single vehicle motorcycle and car crashes, Journal of safety research 49: 129-135.
Malig, J. 2010. Motorcycles rule Philippine roads. Available from internet: <http://www.abs-cbnnews. com/lifestyle/10/14/10/motorcycles-rule-philippine-roads>.
Markogiannakis, H.; Sanidas, E.; Messaris, E.; Koutentakis, D.; Alpantaki, K.; Kafetzakis, A.; Tsiftsis, D. 2006. Motor vehicle trauma: analysis of injury profiles by road-user category, Emergency Medicine Journal 23(1): 27-31.
McLellan, B.A.; Vingilis, E.; Larkin, E.; Stoduto, G.; Macartney-Filgate, M.; Sharkey, P.W. 1993. Psychosocial Characteristics and Follow-Up of Drinking and Non-Drinking Drivers in Motor Vehicle Crashes, Journal of Trauma and Acute Care Surgery 35(2): 245-250.
Metro Manila Development Authority. 2011. Motorcycle Traffic Accidents. Metro Manila Development Authority, Metropolitan Safety Unit.
O’Connor, L.R.; Ruiz, R.A.L. 2014. Alcohol and Hospitalized Road Traffic Injuries in the Philippines,
The Yale Journal of Biology and Medicine 87(3): 307-319.
Preusser, D.F.; Williams, A.F.; Ulmer, R.G. 1995. Analysis of fatal motorcycle crashes: crash typing,
Accident Analysis & Prevention 27(6): 845-851.
Rafael, E. 2015. Institutionalizing PUV traffic discipline in the Philippines. Available from internet: <http://www.rappler.com/move-ph/ispeak/110574-instituionalize-puv-traffic-discipline>.
Rice, T.M.; Troszak, L.; Ouellet, J.V.; Erhardt, T.; Smith, G.S.; Tsai, B.W. 2016. Motorcycle helmet use and the risk of head, neck, and fatal injury: Revisiting the Hurt Study, Accident Analysis & Prevention 91: 200-207.
Sauler, E. 2017. LTO, MMDA fielding more enforcers vs drunk driving. Available from internet: <http:// newsinfo.inquirer.net/849935/lto-mmda-fielding-more-enforcers-vs-drunk-driving>.
Savolainen, P.; Mannering, F. 2007. Probabilistic models of motorcyclists’ injury severities in single- and multi-vehicle crashes, Accident Analysis and Prevention 39(5): 955–963.
Steg, L.; Brussel, A.V. 2009. Accidents, aberrant behaviours, and speeding of young moped riders,
Transportation Research Part F: Traffic Psychology and Behaviour 12(6): 503-511.
Williams, M.J.; Hoffman, E.R. 1979. Alcohol use and motorcycle accidents, Accident Analysis and Prevention
11(3): 199-207.
Wladis, A.; Boström, L.; Nilsson, B. 2002. Injuries in 8927 patients admitted after motor-cycle crashes in Sweden 1987–1994 inclusive, European Journal of Surgery
168(3): 187-192.
World Health Organization. 2015. Global Status Report on Road Safety 2015. Available from internet: <http://www.who.int/violence_injury_prevention/ road_safety_status/2015/en/>.
World Health Organization. 2016. WHO supports helmet law implementation in the Philippines. Available from internet: <http://www.wpro.who.int/philippines/ areas/injury_violence/story_helmet_law/en/>.
Zabeu, J.L.A.; Zovico, J.R.R.; Júnior, W.N.P.; Neto, P.F.T. 2013. Profile of Motorcycle Victims from the Emergency Service of a University Hospital, Revista Brasileira de Ortopedia (English Edition) 48(3): 242-245.