R E S E A R C H
Open Access
Improving program targeting to combat
early-life mortality by identifying high-risk
births: an application to India
Antonio P. Ramos
1*, Robert E. Weiss
1and Jody S. Heymann
2Abstract
Background:It is widely recognized that there are multiple risk factors for early-life mortality. In practice most
interventions to curb early-life mortality target births based on a single risk factor, such as poverty. However, most premature deaths are not from the targeted group. Thus interventions target many births that are at not at high risk and miss many births at high risk.
Methods:Using data from the second wave of Demographic and Health Surveys from India and a hierarchical
Bayesian model, we estimate infant mortality risk for 73.320 infants in India as a function of 4 risk factors. We show how this information can be used to improve program targeting. We compare our novel approach against common programs that target groups based on a single risk factor.
Results:A conventional approach that targets mothers in the lowest quintile of income correctly identifies only
30% of infant deaths. By contrast, using four risk factors simultaneously we identify a group of births of the same size that includes 57% of all deaths. Using the 2012 census to translate these percentages into numbers, there were 25.642.200 births in 2012 and 4.4% died before the age of one. Our approach correctly identifies 643.106 of 1.128. 257 infant deaths while poverty only identifies 338.477 infant deaths.
Conclusion:Our approach considerably improves program targeting by identifying more infant deaths than the
usual approach that targets births based on a single risk factor. This leads to more efficient program targeting. This is particularly useful in developing countries, where resources are lacking and needs are high.
Keywords:Early-life mortality, Program targeting, Risk factors, Bayesian hierarchical model
Background
Inequality in early-life mortality (ELM) is a funda-mental dimension of social inequality. For example, the Millennium Development Goals (MDG) include reduction in ELM among its goals [1, 2]. For the 195 countries with available data, 68% failed to achieve the reductions in ELM established by Goal 4 by 2015 [3, 4]. Earlier studies have suggested that the MDG would be difficult to achieve precisely because of high levels of inequality in ELM that plague many coun-tries [5–7].
Within countries, inequality in ELM is usually de-fined in terms of differences in average mortality across different levels of a single risk factor. For example, dis-parities have been documented across income groups, race and ethnic groups and place of residency [8–13]. Current ELM health policies often target births based on a single risk factor, most commonly poverty, for simplicity and because infants in poor households have higher average mortality rates compared to infants in richer households [6, 8, 14–18]. Essentially, this ap-proach uses membership in a group defined by a single risk factor as a proxy for being a birth at a higher risk of premature death.
The most common interventions that target births based on poverty are perhaps Cash Transfer Programs (CTP), now widely implemented in many low- and middle-income
* Correspondence:[email protected]
1Department of Biostatistics, Fielding School of Public Health, UCLA, Los
Angeles, CA, USA
Full list of author information is available at the end of the article
countries [19–21]. However, there are many other types of child health interventions that target births from poor fam-ilies [22–24]. While births from the poorest families have higher mortality rates than other births, targeting births based solely on poverty–or based on any other risk factor – ignores within-group heterogeneity, where births from the same group may have very different mortality risks [5, 25–27]. Targeting groups that are highly heteroge-neous in mortality risk is inefficient for program target-ing because it allocates resources to lower-risk births not in need of program resources. In particular, groups with highest average mortality are not exclusively popu-lated by high-risk births, and high-risk births exist in other groups despite lower average mortality. As an ex-ample, our own calculation using data from the Demo-graphic and Health Surveys for 50 countries from 1970 to 2005 shows that the poorest 20% in each country only contains 30% of all infant deaths from that period.
We develop methodology that improves program target-ing by simultaneously combintarget-ing information from several risk factors. We also set out allocation rules to guide pro-gram targeting. We illustrate our approach with a statis-tical analysis of data from India. We include risk factors identified in the literature that are potentially available for policymakers in other high-mortality and low-resource settings [28,29]. Further, we purposely have chosen only a few risk factors to demonstrate the power of our approach even when limited information is available, and to facilitate actual policy interventions as several risk factors can make targeting more complex. Our objective is to elucidate methods useful for policymakers who will design policy in-terventions in high-mortality and low-resource settings.
Methods Data source
We analyze data on 73,320 births from the second wave of the National Family Health Surveys (NFHS) in India, also known as the Demography and Health Surveys (DHS), (https://dhsprogram.com/). This is a nationally representative survey, conducted in 1998–1999, and the last wave in which participants’ district level was re-ported. Because geographic location is an important risk factor, we use this wave rather than the most recent to illustrate our methodology. We use infant mortality as our outcome and analyze the last five years of births.
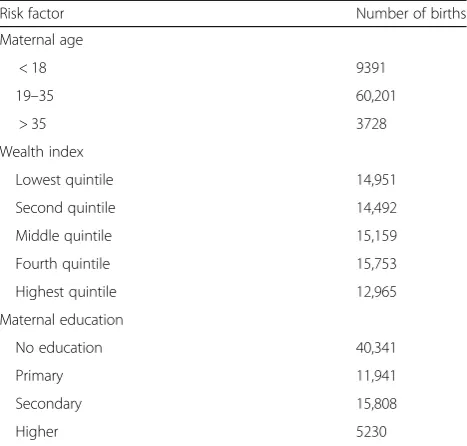
In our statistical model we use districts (436), which are the districts in which the infant was born; wealth quintiles (five categories) of the household in which the mother lived at the time of the survey; maternal educa-tion (four categories), which is the highest attained level of education of the mother at the time of the interview; and the age of the mother at the birth of the infant. Table1summarizes the data.
Statistical analysis
Our analysis is a two-step procedure. As mortality risk is a latent variable, we estimate it for each birth in our data using a statistical model. Second, we classify births into small sub-groups to identify groups for program targeting. We use a Bayesian hierarchical model to predict mortality risk for each birth. The outcome Yiis whether the fifth birth survived to the age of 1 or not. The model predictsi, the underlying mortality risk for birth i. We include as predic-tors the main effects for maternal age, maternal education, household wealth, and district and all two-, three-, and four-way interactions. The main effects and interactions in the regression model are modeled as either fixed or random effects. If a particular effect, either main or interaction, has more than 20 unique levels, we include it as random effect. For example, the main effect of district and the 3-way inter-action of age x education x wealth are modeled as random effects. Otherwise, the effects are treated as fixed effects. For random effects, we estimate the prior variance of the random effects. For the fixed effect, we take its prior vari-ance x a known value. We use R and the package MCMCglmm to t our statistical models [30,31].
After estimating mortality risk, we cross-classify births into small subgroups by geographical location and risk fac-tors. We rank subgroups by average mortality risk, from highest to the lowest mortality risk. The conventional ap-proach targets infants in the lowest wealth quintile, which comprises 20% of the births. Thus, to construct a compar-able intervention group with our method, we allocate sub-groups, starting with the highest mortality subsub-groups, until the total percentage adds up to 20% of all births. We con-sider three scenarios: 1) district: policymakers are allowed Table 1Summary statistics for the births in our data set
Risk factor Number of births Maternal age
< 18 9391
19–35 60,201
> 35 3728
Wealth index
Lowest quintile 14,951 Second quintile 14,492 Middle quintile 15,159 Fourth quintile 15,753 Highest quintile 12,965 Maternal education
No education 40,341 Primary 11,941 Secondary 15,808
Higher 5230
to flexibly target different subpopulations in each district; 2) state: target subpopulations can vary by state but all dis-tricts within the same state must target the same groups; 3) national: the same groups must be targeted for the entire country. District is the preferred scenario as it allows great-est flexibility in program targeting. However, we also consider state and national scenarios to illustrate the use-fulness of our approach even when policy is subject to con-straints. Details of our allocation mechanism can be found in the Additional file1.
Results
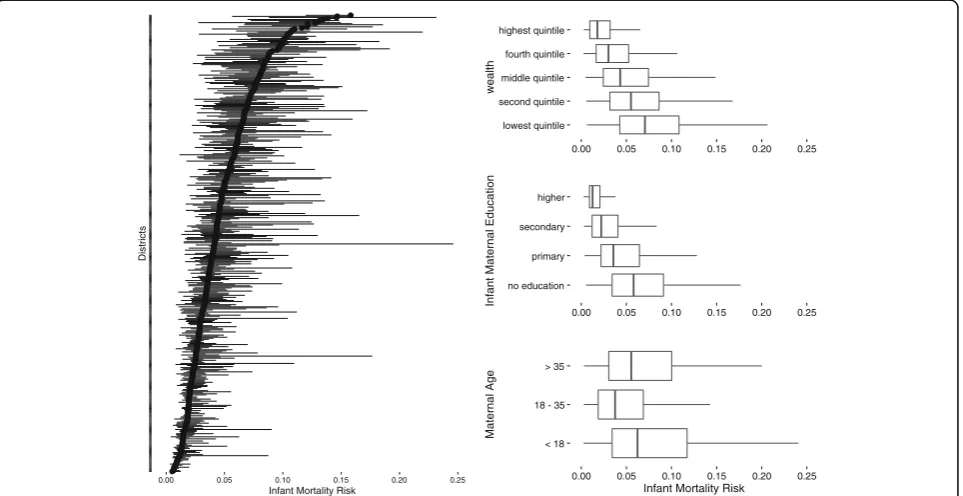
We evaluate first how much variation in mortality risk exists within and between groups defined by levels of single risk factors. Figure 1 on the right displays dot plots of estimated infant mortality risk by risk factors: maternal education, wealth, and maternal age. Districts is a box plot on the left.
Lower income quintiles have higher average mortality risk than the wealthier quantiles. The average risk for the poorest quintile is 8%. However, 15% of all births in other richer quintiles have mortality risk higher than the average risk for the poorest quintile. Maternal education categories exhibit substantial overlap in mortality risk. Average mortality risk for births from women with no education is 6%. However, 27% of infants of mothers from the other educational categories have mortality risk higher than 6%. On the left of Fig.1, we use a dot plot
to display mortality risk by district. Each horizontal line represents a district, and districts are ordered by median risk within district. For each district, the solid line shows the interquartile range of mortality risk, extending from the 25th percentile to the 75th percentile. District me-dian levels of mortality risk range from nearly zero up to 15%. Generally, districts with lower median mortality risk also have lower within-district variation. Within dis-tricts, the width of the interquartile range varies from zero up to 10% for districts with wide variation in mor-tality risk. Thus, districts vary greatly in their level of in-equality. Overall, these results suggest that groups defined by levels of a single risk factor have large vari-ability in mortality risk and this makes program target-ing based on a starget-ingle risk factor inefficient.
Table2compares the traditional single risk factor program targeting approach to our approach. Using poverty (lowest wealth quintile) as a risk factor to predict mortality, the trad-itional approach correctly identifies 30% of all deaths. How-ever, our multifactor approach correctly identifies 57% (district), 40% (state) and 38% (national) of all deaths.
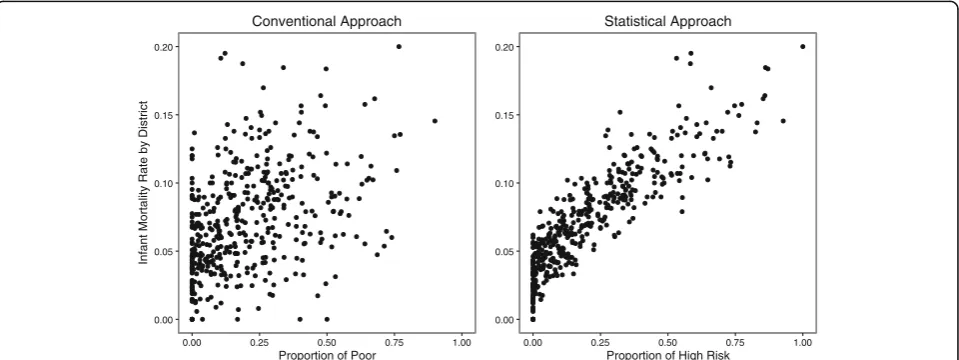
Figure2illustrates the efficiency gains from our multi-factor approach against the conventional approach by looking at the data at the district level. Each point in a dot plot is a district, where the y-axis represents the ac-tual proportion of deaths in that district and the x-axis represents the estimated proportion of high-risk births by districts, for each approach. In the left graph, the
0.00 0.05 0.10 0.15 0.20 0.25
Infant Mortality Risk
D
is
tr
ict
s
lowest quintile second quintile middle quintile fourth quintile highest quintile
0.00 0.05 0.10 0.15 0.20 0.25
wealth
no education primary secondary higher
0.00 0.05 0.10 0.15 0.20 0.25
Infant Maternal
Educ
a
ti
o
n
< 18 18 - 35 > 35
0.00 0.05 0.10 0.15 0.20 0.25
Infant Mortality Risk
M
atern
a
l A
g
e
relationship is weak between infant mortality rates by dis-trict and the proportion of deaths in the lowest wealth quintile. By contrast, the estimated mortality risk by dis-trict from our statistical model predicts actual deaths at the district level much more precisely. The maps in Fig.3 contrast poverty (births from the poorest 20% of mothers) and the 20% of highest-risk infants based on our statistical model and infant mortality, all by district.
Discussion
Our results show that poverty alone is an inefficient guide for program targeting. In contrast, combining information from multiple risk factors significantly improves program targeting efficiency. This is an important finding because program targeting usually uses information from a single risk factor, such as poverty or maternal education, to define the targets [8, 14, 32]. The typical assumption is that be-cause a given group has the highest average mortality risk, most births with high mortality risk belong to that group. However, we have shown that (1) not all births from the highest risk group are at higher mortality risk, and (2) high-risk births also exist in significant numbers across other groups. In agreement with previous literature,
geographic location is a particularly important predictor for India, and the relative importance of each risk factor and their interactions varies across districts [28, 29]. Thus, allowing geographic flexibility in designing program inter-ventions can greatly improve policymakers’ability to target.
Although we used data from India in 1998, we believe our findings are directly applicable to other high-mortality, low-resource settings. First, ELM conditions in India in 1998 are similar to that of many developing countries today. For example, infant mortality rate in 1988 in India was 65 deaths per thousand births, which is lower than 2016 figures for countries like Sierra Leone (83 deaths per thousand births), Central Africa Republic (90 deaths per thousand births), Democratic Republic of Congo (72 deaths per thousand births), Somalia (83 deaths per thou-sand births), and many other countries. In addition, using data from 100 DHS surveys from 50 lower-middle income countries (LMICs) from 1970 to 2010, we find that the dis-tribution of ELM across the spectrum of income is similar to that in India. Births from the 20% poorest families ac-count for approximately 30% of all deaths, while roughly 70% of all infant deaths occur outside the 20% poorest families. Thus, it seems that targeting based only on in-come in most LMICs will generate program targeting inef-ficiencies that our methodology can improve upon. The relative importance of different risk factors and the nu-ances of program targeting are different in different coun-tries, but these differences can be accommodated within our methodology.
Second, many interventions in global health target the poor. The most common interventions are perhaps Cash Transfer Programs (CTP), currently widely implemented in many LMICs. Many of these programs also intervene Table 2Classi_cation rates comparing statistical approaches
against the convetional approach that target poverty (lowest quintile)
Target group % of correctly classified deaths Poorest quintile 30%
District 57%
State 40%
National 38%
0.00 0.05 0.10 0.15 0.20
0.00 0.25 0.50 0.75 1.00
Proportion of Poor
Infant Mortality Rate by District
Conventional Approach
0.00 0.05 0.10 0.15 0.20
0.00 0.25 0.50 0.75 1.00
Proportion of High Risk
Statistical Approach
in infant and child health [19,20]. For example, in Burkina Faso, families enrolled in conditional cash transfer schemes were required to obtain quarterly child growth monitoring at local health clinics for all children under 60 months of age [21]. The famous randomized controlled trial (RCT) “Lentils for Vaccines” in India targeted the poor, as do most RCTs that aim to increase vaccine up-take, good nutrition, or general child health [22]. Many anti-poverty programs target child health, such as in Peru [23]. Finally, it is often recommended that poor births should be the target of global health interventions [24].
It is important to stress that our approach is not a cri-tique of programs that target the poor, as we believe that the poor are targeted for good reasons. However, we also believe that our approach can increase program effi-ciency in high-mortality, low-resource settings.
Finally, even if a given program already targets births based on multiple risk factors (e.g. poor families from rural areas) our approach can still be useful in increasing program efficiency. This is the case because our ap-proach allows policymakers to combine multiple risk factors simultaneously to estimate mortality risk more accurately. Using our approach, policymakers do not need to decide ex-ante which factors define higher-risk groups. Instead, policymakers can use our approach to let the data decide which demographics have higher mortality risk to guide their targeting decisions.
In this paper we explore the role of a few risk factors in predicting early mortality, which were purposely chosen to produce implementable policy recommenda-tions. However, there are a number of other variables that have been linked to ELM, such as sanitation, water supply, birth spacing, and so on. These data are rou-tinely collected by health surveys and governments.
Future studies should explore these factors to establish which ones are most useful in improving program tar-geting. Flexible statistical models including Bayesian semi-parametric and machine learning models can han-dle a large number of risk factors and interactions, allowing us to investigate numerous risk factors simul-taneously [33,34]. These statistical methods have proven useful in many contexts where predicting a rare event was a key scientific objective. However, the challenge with more data and more complex models is to make clear policy recommendations.
Finally, our approach can be applied to other health out-comes. For example, maternal mortality is closely related to ELM and is a major health problem in LMICs, where more than 289,000 women die during pregnancy and childbirth from preventable causes every year [35, 36]. Among the 122 million women who have a live birth an-nually, 10% suffer complications and disability. Developing countries account for 99% of global maternal deaths, the majority of which are in sub-Saharan Africa and southern Asia. Programs usually target mothers based on a single or a few risk factors [35]. Our methodology adapts natur-ally to improve program targeting by exploring combina-tions of risk factors for maternal mortality and health.
fewer risk factors. However, policy recommendations from these models may not necessarily be feasible for policy-makers to implement. Policypolicy-makers might not be allowed to target certain demographic groups due to political, cul-tural, or historical reasons, even if they are at higher risk of mortality. Moreover, targeting certain groups can be difficult for logistical reasons. For example, if high-risk births are geographically spread out in such a way that each location has only few high-risk births, it may be costly for policymakers to target births under these circumstances.
Conclusion
We propose new program targeting methodology that uses information from multiple risk factors simultan-eously and a statistical model to better define the target high-risk population. We use India to illustrate our ap-proach, showing that it leads to significant improve-ments in program targeting over the conventional targeting approach that equates high-risk with the worst level of a single risk factor. We estimate the unobserved mortality risk for each infant in our data, and, using these estimates, we show that the distribution of the mortality risk is highly variable across groups defined by a single factor. This suggests that groups defined by a single risk factor are very heterogeneous in terms of mortality risk, which leads to inefficient targeting. We contrast our approach with the conventional approach to more efficiently identify infant deaths. We compare the 20% poorest births with the 20% highest risk infants. Using poverty as a single risk factor correctly identifies 30% of deaths, while our statistical model correctly iden-tifies 57%. Using India data from 2010 to translate these percentages into numbers, the statistical models cor-rectly identify 506,409 more deaths than the conven-tional approach.
This study supports the view that monitoring inequality in ELM across births is useful for policy purposes, answer-ing initial skepticism [16,25,37]. Our study suggests that looking at national averages is not enough to achieve progress in early-life mortality [5,7,25,38]. Our method-ology can be used by policymakers in high-mortality, low-resource settings to improve program intervention and thus help countries to reduce inequality in ELM and meet the Sustainable Development Goals.
Additional file
Additional file 1:Supplementary Materials. (PDF 116 kb)
Acknowledgments
We thank Chad Hazlett for suggestions regarding the methodology and Annalijn Conklin for suggestions regarding the presentation of the findings.
Funding
APR was supported by the Eunice Kennedy Shriver National Institute of Child Health & Human Development of the National Institutes of Health under Award Number K99HD088727. The funders of the study had no role in study design, data collection, data analysis, data interpretation, or writing of the report. The corresponding author had full access to all the data in the study and had final responsibility for the decision to submit for publication.
Availability of data and materials
The datasets generated and analyzed during the current study are available athttps://dhsprogram.com/. All computer code necessary to reproduce the results are available from the corresponding author.
Authors’contributions
APR developed the methodology, conducted the empirical analysis and drafted the paper. REW and JSH guided the method development and edited the paper. All authors read and approved the final manuscript.
Ethics approval and consent to participate
The project involves only secondary analysis of existing survey data obtained from Demographic and Health Surveys. All datasets are publicly available and human subjects are anonymous. The DHS Program uses strict standards and procedures to protect the privacy and confidentiality of survey respondents. These procedures include obtaining verbal informed consent which the interviewers record in the questionnaire and also sign to attest that the prescribed consent statement was read to the respondent. The DHS Program was reviewed and approved by the ICF International Institutional Review Board to ensure compliance with the US Department of Health and Human Services regulation for the protection of human subjects (45 CFR 46).
Consent for publication
Not applicable.
Competing interests
The authors declare that they have no competing interests.
Publisher’s Note
Springer Nature remains neutral with regard to jurisdictional claims in published maps and institutional affiliations.
Author details
1Department of Biostatistics, Fielding School of Public Health, UCLA, Los
Angeles, CA, USA.2WORLD Policy Analysis Center, Fielding School of Public Health, UCLA, Los Angeles, CA, USA.
Received: 14 July 2017 Accepted: 10 August 2018
References
1. Moser A, Leon D, Gwatkin D. How does progress towards the child mortality millennium development goal affect inequalities between the poorest and least poor? Analysis of Demographic and Health Survey data. BMJ: Br Med J. 2005;331:1180–3.
2. Stuckler D, Basu S, Mckee M. Drivers of inequality in Millennium Development Goal progress: a statistical analysis. PLoS Medicine. 2010;7(3): e1000241.
3. Molyneux M, Molyneux E. Reaching Millennium Development Goal 4. The Lancet Global Health. 2016;4:146–7.
4. Victora C, Requejo JH, Barros AJ, Berman P, Bhutta Z, Boema T, et al. Countdown to 2015: a decade of tracking progress for maternal, newborn, and child survival. The Lancet. 2016;387(10032):2049–59.
5. NIMS, ICMR and UNICEF. Infant and Child Mortality in India: Levels, Trends and Determinants. New Delhi: National Institute of Medical Statistics (NIMS), Indian Council of Medical Research (ICMR), and UNICEF India Country Office; 2012.
6. Houweling TA, Kunst AE. Socio-economic inequalities in childhood mortality in low- and middle-income countries: a review of the international evidence. Br Med Bull. 2010;93:7–26.
8. Victora C, Wagstaff A, Schellenberg J, Gwatkin D, Claeson M, Habicht J. Applying an equity lens to child health and mortality: more of the same is not enough. The Lancet. 2003;362(9379):233–41.
9. Sastry N. Trends in socioeconomic inequalities in mortality in developing countries: the case of child survival in Sao Paulo, Brazil. Demography. 2004; 41(3):443–64.
10. Wagstaff A. Socioeconomic inequalities in child mortality: comparisons across nine developing countries. Bulletin of The World Health Organization. 2000;78(1):19–29.
11. Brockerhoff M, Hewett P. Inequality of child mortality among ethnic groups in sub-Saharan Africa. Bulletin of The World Health Organization. 2000;78(1): 30–41.
12. Antai D. Regional inequalities in under-5 mortality in Nigeria: a population-based analysis of individual- and community-level determinants. Population Health Metrics. 2011;9(1):1–10.
13. Jankowska MM, Benza M, Weeks JR. Estimating spatial inequalities of urban child mortality. Demographic Research. 2013;28(2):33–62.
14. Gwatkin D, Bhuiya A, Victora C. Making Health Systems more equitable. The Lancet. 2004 October;364:1273–80.
15. Black R, Morris S, Bryce J, Venis S. Where and why are 10 mil- lion children dying every year? Commentary. The Lancet. 2003;361:2226–34.
16. Braveman P, Starfield B, Geiger J. World Health Report 2000: how it removes equity from the agenda for public health monitoring and policy. Br Med J. 2001;323:678–81.
17. Bryce J, el Arifeen S, Pariyo G, Lanata C, Gwatkin D, Habicht J. Reducing child mortality: can public health deliver? The Lancet. 2003;362(9378):159–64. 18. Jones G, Steketee R, Black R, Bhutta Z, Morris S. How many child deaths can
we prevent this year? The Lancet. 2003;362:65–71.
19. Glassman A, Duran D, Fleisher L, Singer D, Sturke R, Angeles G, Charles J, et al. Impact of Conditional Cash Transfers on Maternal and Newborn Health. J Health, Popul Nutr. 2013;31.4(Suppl 2):S48–66.
20. Basset L. Can Conditional Cash Transfer Programs Play a Greater Role in Reducing Child Undernutrition? World Bank; 2008.
21. Akresh R, de Walque D, Kazianga H. Alternative Cash Transfer Delivery Mechanism: Impacts on Routine Preventive Health Clinic Visits in Burkina Faso. Natl Bur Econ Res. 2015;17785
22. Banerjee A, Duflo E, Glennerster R, Kothari D. Improving immunization coverage in rural India: clustered randomized controlled evaluation of immunization campaigns with and without incentives. Br Med J. 2010;340: c2220.
23. Huicho L, Segura ER, Huayanay-Espinoza CA, Guzman JN, Restrepo-Mendez MC, Tam Y, et al. Child health and nutrition in Peru within an antipoverty political agenda: a Countdown to 2015 country case study. The Lancet Global Health. 2016;4(6):e414–26.
24. Gakidou E, Oza S, Fuertes CV, Li AY, Lee DK, Sousa A, et al. Improving Child Survival Through Environmental and Nutritional Interventions The Importance of Targeting Interventions Toward the Poor. J Am Med Assoc. 2007;298(16):1876–87.
25. Gakidou E, King G. Measuring total health inequality: adding individual variation to group-level differences. Int J Equity in Health. 2002;1(1):3–3. 26. Gakidou E, King G. Determinants of inequality of child survival: results from
39 countries. In: Murray CJL, editor. Health Systems Performance Assessment: Debates, Methods and Empiricism. World Health Organiza-tion; 2003. p. 194–216.
27. World Health Organization. Health systems: improving performance. World Health Organization; 2000.
28. Pandey A, Choe MK, Luther NY, Chand J. National Family Health Survey Subject Report No 11. International Institute for Population Sciences, Mumbai, India East-West Center Program on Population, Honolulu, Hawaii, USA; 1998.
29. Pandey A, Bhattacharya BN, Sahu D, Sultana R. Are too early, too quickly and too many births the high risk births: An analysis of infant mortality in India using National Family Health Survey. Demography India. 2004;33(2): 127–56.
30. R Core Team. R: A Language and Environment for Statistical Computing. Vienna, Austria
31. Hadfield JD. MCMC Methods for Multi-Response Generalized Linear Mixed Models: The MCMCglmm R Package. J Stat Softw. 2010;33(2):1–22. 32. Marmot M. Health in an unequal world. The Lancet. 2006;368:2081–94. 33. Hastie T, Tibshirani R, Friedman J. Elements of Statistical Learning: Data
Mining, Inference, and Prediction. 2nd ed. Springer; 2009.
34. Gelman A, Carlin J, Stern HS, Dubson DB, Vehtari A, Rubin D. Bayesian Data Analysis. 3rd ed. New York: Chapman & Hall/CRC Press; 2013.
35. WHO, UNICEF, UNFPA ,The World Bank, and United Nations Population Division. Trends in maternal mortality 1990-2013. Geneva: WHO; 2014. 36. Bustreo F, Say L, Koblinsky M, Pullum T, Temmerman M. Ending preventable
maternal deaths: the time is now. The Lancet Global Health. 2013;1:176–7. 37. Murray C. Commentary: comprehensive approaches are needed for full
understanding. Br Med J. 2001;323(7314):680–1.