R E S E A R C H
Open Access
Gait-based age estimation using
multi-stage convolutional neural network
Atsuya Sakata
1*†, Noriko Takemura
2†and Yasushi Yagi
1Abstract
Gait-based age estimation has been extensively studied for various applications because of its high practicality. In this paper, we propose a gait-based age estimation method using convolutional neural networks (CNNs). Because gait features vary depending on a subject’s attributes, i.e., gender and generation, we propose the following three CNN stages: (1) a CNN for gender estimation, (2) a CNN for age-group estimation, and (3) a CNN for age regression. We conducted experiments using a large population gait database and confirm that the proposed method outperforms state-of-the-art benchmarks.
Keywords: Convolutional neural network, Age estimation, Gait feature
1 Introduction
Age estimation methods based on image processing have been extensively studied for various applications. Most of these studies focus on the images of faces, which tend to become more wrinkled and sag with age [1–6]. However, because high-resolution full-face images are required for these age estimation methods, they can only be used in situations where human images are captured at a short distance, e.g., age confirmation for purchasing alcohol and cigarettes or in digital signage applications.
In contrast, gait features, which represent a human’s manner of walking, can be captured at a distance from an uncooperative subject. The way a human walks differs depending on his/her attributes, such as gender, physique, muscle mass, and age. From the medical view point, there are some studies on gait analysis to measure fatigue and detect disease [7,8]. In the field of informatics, in contrast, gait-based human identification has been intensively stud-ied for various applications such as access control, surveil-lance, and forensics [9–11]. Gait differs depending on not only attributes but also individuals. For instance, individ-ual features greatly depend on posture, stride length, arm-swinging width, and the asymmetry of walking, which is formed from habits such as holding a shoulder bag on a fixed side. Moreover, gait identification has already been
*Correspondence:[email protected]
†Atsuya Sakata and Noriko Takemura contributed equally to this work. 1The Institute of Scientific and Industrial Research, Osaka University, Ibaraki,
Osaka, 5670047 Japan
Full list of author information is available at the end of the article
used in practical cases in criminal investigations [12– 14]. Hence, we expect that gait features will be useful for age information, and we investigated gait-based age estimation.
Gait-based age estimation expands the scope of real-world applications such as wide-area surveillance and the detection of lost children and wandering elderly peo-ple, as well as marketing research in large-scale facilities (e.g., shopping malls, terminals, and airports). There are several studies on gait-based age estimation. Makihara et al. [15] proposed an age regression algorithm based on Gaussian process regression (GPR). Lu et al. [16] pro-posed a multilabel-guided subspace to better characterize and correlate age and gender information, and Lu et al. [17] proposed an ordinary preserving manifold analysis (OPLDA) for gait-based age estimation. These methods unfold an image-based gait feature into a feature vector, where each dimension corresponds to each pixel. Because spatial proximity in the image structure is never consid-ered, these methods can easily result in overtraining. To prevent this, we propose an age estimation approach using a convolutional neural network (CNN) that considers spa-tial proximity using a convolution operation and has had great success in many image recognition research areas.
Ideally, it is possible to achieve end-to-end learning by CNNs, i.e., any model can be trained by feeding raw images to the CNN. However, in practice, it is not easy to train networks in such an ideal situation. For this reason, existing researchers have proposed some designs in which pre-processed images are fed into the network instead of
Table 1Layer configurations ofSingle-CNN
Layer #Kernels Size/stride #Output nodes
conv1 81 5×5/1 –
pool1 – 3×3/2 –
conv1 45 7×7/1 –
pool2 – 2×2/2 –
fc3 – – 1024
fc4_age – – 1
the raw images and constraints are added to the inter-mediate layers. In addition, recently, multi-task learning has attracted attention [18]: this method improves the accuracy of a target task by simultaneously learning tar-get and other recognition tasks related to the tartar-get task. However, this method can instead worsen the accuracy of target tasks if other tasks adversely affect them because the model is trained to improve all the recognition tasks simultaneously.
Thus, in this paper, we propose sequential multi-task learning instead of conventional parallel multi-task learn-ing. Each CNN for non-target tasks is trained one by one in sequence and the CNN for the target task is trained last. In this way, we can train the network to aim for the target task while taking other tasks into consideration.
Although the network architecture of sequential multi-task learning should be a deep CNN formed by chaining each CNN, we separately train each CNN, which has the same structure as those in parallel multi-task learning, in sequence to simply compare sequential with parallel multi-task by excluding the influence of the depth of the network. In other words, we predict a subject’s gender and generation beforehand and then predict an age-by-age regression model trained on the data for each gender and generation combination separately.
We conducted a performance evaluation using the world’s largest gait database, the OU-ISIR Gait Database, Large
Population Dataset with Age (OULP-Age) [19], which i nclud-es ages ranging from 2 to 90 years and males an d females to confirm the effectiveness of the proposed method.
2 CNN-based age estimation
In this paper, the gait energy image (GEI) [20], which is a gait feature commonly used for gait-based person identi-fication, is used as input to our CNNs. A GEI represents both dynamic features (i.e., swinging hands and legs while walking) and static features (i.e., human shapes and pos-tures). We explain how to extract a GEI as follows. First, human silhouette sequences are obtained by background subtraction-based graph-cut segmentation. Second, we normalize silhouettes by size. Third, the gait period is detected from the normalized silhouette sequences, and finally, we generate a mean silhouette image based on the gait period.
2.1 Single CNN-based age estimation
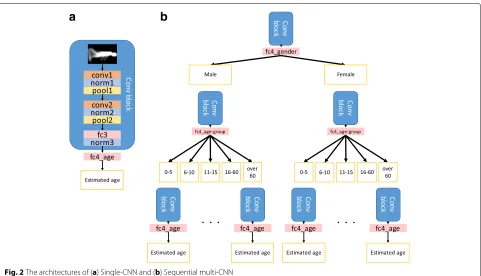
Figure2a shows the network structure for the CNN-based age estimator, and Table1shows the layer configurations. GEIs are fed into the CNN that contains two triplets of a convolution (conv) layer, batch normalization (norm) layer, and max pooling (pool) layer. It also consists of a pairs of a fully connected (fc) layer and a norm layer, and a fc layer for recognition task. The conv layers and fc lay-ers are followed by a ReLU activation function. We call a chain of layers from the input to norm3 inSingle-CNN (a blue block shown in Fig.2a) theConv block.
We initialize the weight parameters of the CNN in all layers using He’s method [21] and neuron biases with a constant of 0. We train our models using Adam with an initial learning rate of 0.001. We use dropout in the fc3 and fc4 layers with a probability of 0.8 and 0.5, respectively. The output of the final layer is considered to be the predicted age. We train the age estimator to minimize the
a
b
Fig. 2The architectures of (a) Single-CNN and (b) Sequential multi-CNN
mean absolute error (MAE) between the predicted and ground truth ages.
As mentioned in [9], in recognition tasks, variations in the input GEIs are smaller than those for a common object recognition task. Therefore, even such a shallow network can represent the feature of a subject’s age.
2.2 Multistage CNN-based age estimation
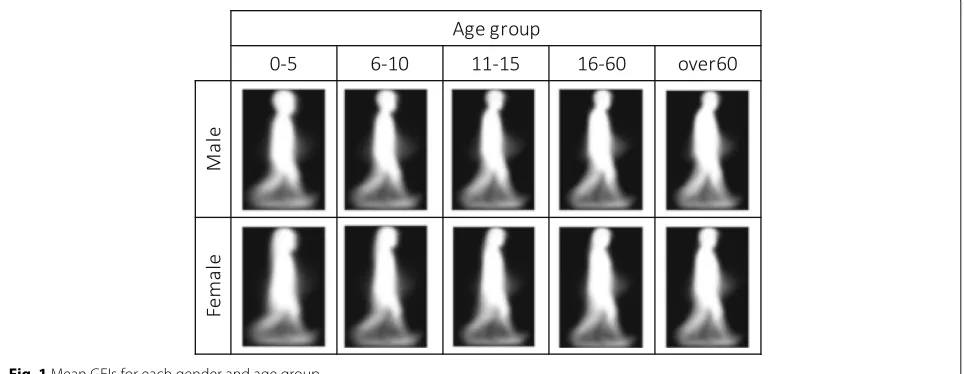
Figure1shows the mean GEIs in the gait database ( OULP-Age) for each gender and age group. It shows that gait fea-tures, e.g., human head-to-body ratio, hairstyles, shapes, and postures, vary depending on a subject’s gender and generation.
Fig. 4Data example inOULP-Age(cited from [19])
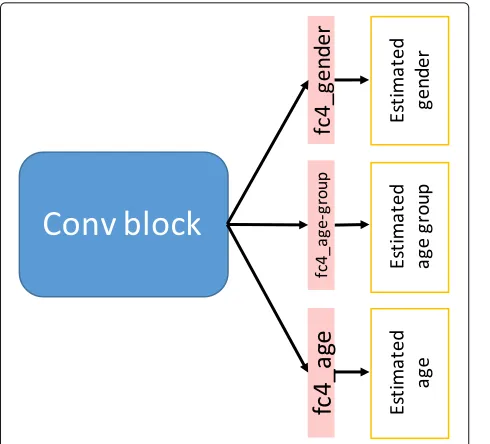
Thus, age estimation accuracy should improve in an age estimator based on specific genders and generations. In this paper, we attempt to improve age estimation using a multistage CNN composed of three CNN-based esti-mators, i.e., a gender estimator, age-group estimator, and age estimator (see Fig. 2b). Note the order of gender discrimination.
As shown in Fig.2b, we usedConv blocksfor all three estimators. For the gender estimator, the sigmoid normal-ized cross-entropy is employed as the loss function. For the age-group estimator, the number of outputs of the fc4 layer is changed to five (the number of age groups) and the softmax normalized cross-entropy is employed as a loss function.
2.2.1 Learning method
The learning procedure for multi-CNN age estimation (sequential multi-task CNN) is as follows (Fig.2):
1 Train a gender estimator on a training set that includes all genders and all age groups
2 Predict gender by feeding the same training data set of (1) into the trained gender estimator
3 Train an age-group estimator for each predicted gender using the gender-predicted data from (2) 4 Predict the age group for each predicted gender by
feeding the gender-predicted data from (2) into the trained age-group estimator for that gender
5 Train an age estimator for each predicted gender and each predicted age group using the data predicted in (4)
We train age estimators for each of the predicted gen-der and age-group estimators. Because of the decrease in the number of training data caused by this approach, overfitting can occur easily. To prevent this, we fine-tune pre-trained models. Specifically, the age-group estimator for each gender is trained by fine-tuning the age-group
estimator trained on all gender data, and the age estimator for each gender and each age group is trained by fine-tuning the age estimator trained on the all age-group data for each age.
2.2.2 Definition of age-group classes
We describe how we define group classes for the age-group estimator in multi-CNN age estimation. Gait data inOULP-Ageare divided into several age groups based on GEI similarity.
First, we dividedOULP-Ageinto intervals of 5 years and generated a mean GEI for each group. Note that samples over 60 years old were put into the same group because of a shortage of elderly persons’ data. Second, we calculated the L2 distance between the mean GEIs of adjacent groups (Fig.3). The L2 distance is calculated as
dL2(x,y)=
W−1
w=0
H−1
h=0
xw,h−yw,h2, (1)
wherexandyare the mean GEIs of adjacent groups with heightH and width W, respectively. Finally, we defined groups with an L2 distance that is less than a threshold as the same class and designed five classes: 0–5, 6–10, 11–15, 16–60, and over 60 years.
As we mentioned in Section2, a GEI represents both dynamic features (i.e., swinging hands and legs while walk-ing) and static features (i.e., human shapes and postures). Because people under 15 years old are growing swiftly, they change their static features substantially, and their GEIs have remarkable differences according to age. In contrast, as shown in Fig. 3, GEIs extracted from peo-ple who are between 15 to 60 years old almost do not appear to have changing features because they have almost stopped growing up. In other wards, differences between statistic feature of GEI are more significant than those of dynamic feature. Poor accuracy during age-group estimation affects the next age regression stage, so we decided to split the age range into five age groups so that the CNNs can estimate age from the GEIs fairly precisely.
Table 2The number of subjects in the training set
Age group Male Female Total
0–5 418 412 830
6–10 2349 2391 4740
11–15 2108 2265 4373
16–60 10,269 10,874 21,143
Over 60 452 385 837
Total 15,596 16,327 31,923
Table 3The number of subjects in the testing set
Age group Male Female Total
0–5 405 425 830
6–10 2351 2389 4740
11–15 2119 2254 4373
16–60 10,220 10,923 21,143
Over 60 402 435 837
Total 15,497 16,426 31,923
3 Performance evaluation
3.1 Database
The OU-ISIR Gait Database, Large Population Dataset with Age (OULP-Age) [19] was used to evaluate the per-formance of the age estimation method.OULP-Ageis the world’s largest gait database that includes age and gen-der information. It consists of 63,846 gait images (31,093 males and 32,753 females) with ages ranging from 2 to 90 years. Figure4shows examples of the data, and Fig.5 shows the distribution of subjects’ age and gender in
OULP-Age. Each subject walking from the right side to the left side along the walking course is captured by a USB camera set at a position 4 m away from the walking course. More information about the data capture is given in detail in [22]. GEIs of 88 ×128 pixels extracted for a side-view gait are provided for each subject. We split the database into testing, training, and validation set at the ratio of 5:4:1, respectively. Note that 20% of the training set is used as the validation set. Tables2and3show the number of subjects among age groups and genders in the training set and testing set, respectively.
3.2 Training settings
The loss function for gender estimation and age-group estimation is cross entropy, which is calculated as
L(w)= − N
n=1
M
m=1
tnmlogy(In;w)m, (2)
wherewdenotes the weight parameter matrix of the net-work, In is the input image, N is the number of data,
Mis the number of classes,y(In;w)m is themth element of the output vector, and tnm denotes the ground truth class. The age estimation task is optimized by minimizing the mean absolute error between the ground truth and predicted age and is calculated as
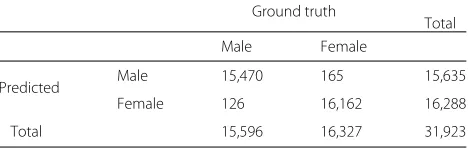
Table 4Results for gender estimation with the training set
Ground truth
Total
Male Female
Predicted Male 15,470 165 15,635
Female 126 16,162 16,288
Table 5Result for age-group estimator on the training set
Ground truth
Total 0–5 6–10 11–15 16–60 Over 60
(a) Predicted as male
Predicted 0–5 404 74 1 0 0 479
6–10 10 2200 161 2 0 2373
11–15 0 76 1459 77 5 1617
16–60 0 7 485 10,120 119 10,731
Over 60 0 0 3 73 359 435
Total 414 2357 2109 10,272 483 15,635
(b) Predicted as female
Predicted 0–5 405 19 0 0 0 424
6–10 11 2316 57 1 0 2385
11–15 0 35 1919 83 0 2037
16–60 0 13 288 10,776 40 11,117
Over 60 0 0 0 11 314 325
Total 416 2,383 2,264 10,871 354 16,288
L(w)= 1
N
N
n=1
tn−y(In;w), (3)
wherewdenotes the weight parameter matrix of the net-work, In is the input image, N is the number of data,
y(In;w) is the predicted age, andtn is the ground truth age of thenth sample. For training each network included in the proposed method with back-propagation, we use Adam [23]. We also use a batch size of 128 samples, and the initial learning rate is 0.001, which is the default value for Adam. The maximum number of epochs is 100, although we used the weights of the network at the epoch when the validation error is the minimum. Table4shows the distribution among the gender, and Table5shows the distribution among the age groups.
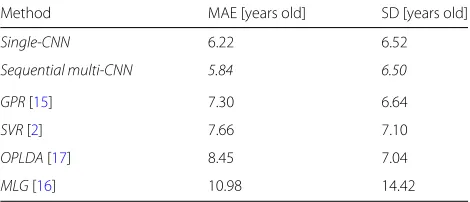
Table 6MAEs and SDs for comparing the proposed methods with existing methods not based on CNNs
Method MAE [years old] SD [years old]
Single-CNN 6.22 6.52
Sequential multi-CNN 5.84 6.50
GPR[15] 7.30 6.64
SVR[2] 7.66 7.10
OPLDA[17] 8.45 7.04
MLG[16] 10.98 14.42
The best result is indicated by the italic font
3.3 Evaluation method
The MAE, standard deviation (SD), and cumulative score (CS) are used as the evaluation criteria for the performance evaluation. MAE is calculated as
MAE= 1
N
N
n=1
|tn−yn|, (4)
where tn andyn are the ground truth and predicted age values for thenth test sample, respectively, andN is the number of test samples. SD is calculated as follows.
SD=
1
N−1 N
n=1
(|tn−yn| −MAE)2 (5)
CS is calculated as
CS(l)= Nl
N ×100%, (6)
whereNlis the number of samples whose MAE is withinl year.
3.4 Comparison with existing methods not based on CNNs We compared the two proposed methods with four com-parison methods using the protocol described in [19].
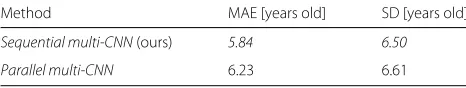
Table 7MAEs and SDs for comparing the proposed method with a conventional multi-task CNN
Method MAE [years old] SD [years old]
Sequential multi-CNN(ours) 5.84 6.50 Parallel multi-CNN 6.23 6.61 The best result is indicated by the italic font
Single-CNN : Proposed method with a single CNN
Sequential multi-CNN : Proposed method with multi-ple CNN stages
GPR[15] : GPR-based method
SVR[2] : Support vector regression-based method
OPLDA[17] : OPLDA-based method
MLG[16] : A method that learns a multilabel-guided (MLG) subspace for human age
The MAEs and SDs of both versions of the proposed method and benchmarks are shown in Table6. According to Table6, the results of our CNN-based methods ( Single-CNN andSequential multi-CNN) are much better than those of the benchmarks. Furthermore, comparing the proposed methods, Sequential multi-CNN, which con-siders gender and age groups, improves the performance more thanSingle-CNN. In terms of SD, while the result of the proposed method is better than that of the exist-ing method, there is no difference between our method and Single-CNN. This is because our method does not estimate age well for elderly people.
The CSs ofSingle-CNN andSequential multi-CNNfor each age group are shown in Fig. 6. As shown in the graph, Sequential multi-CNN significantly outperforms
Single-CNN, especially in the 6–10, 11–15, and over 60 year groups.
3.5 Sequential multi-CNNvs.parallel multi-CNN
We compared the proposed method with multiple CNN stages (Sequential multi-CNN) with a conventional
multi-task CNN [24] (Parallel multi-CNN). In Parallel multi-CNN, multiple tasks are learned at the same time, while exploiting commonalities and differences across tasks to improve the estimation accuracy for the task-specific models. Figure 10 shows the network architecture of
Parallel multi-CNN. Note thatParallel multi-CNN con-sists of the sameConv block withSequential multi-CNN
and each loss weight is 1.0, except that the last layer is branched for each task (gender, age group, and age), to compare only the learning strategy, namely, sequential multi-task learning vs. parallel multi-task learning.
Table7shows the MAEs and SDs ofSequential multi-CNNandParallel multi-CNNestimated in the same man-ner as in Section3. The result ofSequential multi-CNNis better than that ofParallel multi-CNN. The CSs of Par-allel multi-CNN andSequential multi-CNNfor each age group are shown in Fig.7. The graph demonstrates that
Sequential multi-CNN outperformsParallel multi-CNN, as is the case for the comparison with Single-CNN.
In the training phase,Sequential multi-CNNis trained to minimize a loss for each task in the order of gender, age group, and age, i.e., the target task is the last one, whereas
Parallel multi-CNN is trained so as to minimize multi-task losses simultaneously. Thus,Sequential multi-CNN
can be trained more intensively and efficiently for the tar-get task. This seems to be why the result ofSequential multi-CNNis better.
4 Discussion
4.1 Distribution of the estimated ages corresponding to the actual age
Figure8presents a scatter plot of the estimated ages of
Sequential multi-CNN with respect to the ground truth age. Each point is colored according to the estimated age groups. According to Fig.8, when age-group estimation fails, age estimation also fails, i.e., the MAE is larger, especially when the estimated age groups are 11–15 and over 60 years.
Fig. 8Scatter plot of the estimated ages ofSequential multi-CNNwith respect to the ground truth age. The dotted line indicates where the estimated age equals the ground truth age
4.2 Order of learning tasks inSequential multi-CNN InSequential multi-CNN, CNNs are trained in the order of gender, age group, and age. The reasons why learning is performed in this order are as follows:
• Age is trained last because age estimation is the target task.
• Age group is trained second to the last because age group has a stronger relationship with age.
• Gender is trained first because gender is easier to recognize than age group.
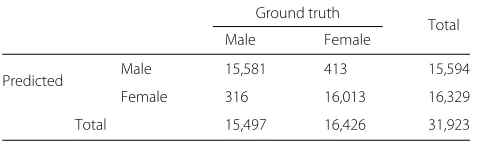
Tables8and9show the confusion matrices of the results of gender and age-group estimation using the test set, respectively. These matrices show that the recognition rate of gender is higher than that of age group. More specifically, there are more than a few cases of incor-rect recognition, especially for age-group estimation for pedestrians over 60 years. The proposed method has the problem that the failure of each estimation task causes successive failures in the next tasks. To avoid this, we need further studies to determine how to combine the CNNs at each stage into a single network so that it can effectively minimize the error of all the stages.
Table 8Results for gender estimation with the testing set
Ground truth
Total
Male Female
Predicted Male 15,581 413 15,594
Female 316 16,013 16,329
Total 15,497 16,426 31,923
4.3 Difference of accuracy between male and female Table 10 shows the gender-specific MAEs and SDs of
Sequential multi-CNN, and Fig. 9 shows the graph of gender-specific CSs. As shown in Table 10 and Fig. 9, both MAE and SD of female subjects are worse than those of male subjects overall, especially over 60. Moreover, the CSs of Sequential multi-CNN is worse than that of
Single-CNNin the case of 11–15 age group.
This is because the female-specific personal features such as hairstyle and clothes (e.g., skirt and one-piece)
Table 9Results for age-group estimation with the testing set
Ground truth
Total 0–5 6–10 11–15 16–60 Over 60
(a) Male
Predicted 0–5 266 212 1 1 0 480
6–10 36 1912 350 4 9 2311
11–15 0 213 1209 120 15 1557
16–60 0 17 604 9969 244 10,834
Over 60 0 0 9 137 266 412
Total 302 2354 2173 10,231 534 15,594
(b) Female
Predicted 0–5 334 132 1 0 0 467
6–10 108 2178 317 17 0 2620
11–15 0 182 1099 271 3 1555
16–60 0 66 756 10,367 257 11,446
Over 60 0 2 5 81 153 241
Table 10Gender-specific MAEs and SDs ofSequential multi-CNN
Gender MAE [years old] SD [years old]
Male 5.60 6.19
Female 6.07 6.77
The best result is indicated by the italic font
affect the accuracy of age estimation. It is easy to estimate age of both male and female children due to distinctive features such as height. Adult female, in contrast, have more variations in hairstyle and clothes than adult male. Therefore, it is more difficult to estimate the age of female than that of male in adult generation.
4.4 Applicability of sequential multi-task learning to other tasks
In this paper, it was confirmed that sequential multi-task learning is more effective for age estimation than CNN-based single task learning and parallel multi-task learning (Fig.10). The framework of sequential multi-task learning can be applied not only to age estimation but also to other recognition tasks, e.g., person identification and health estimation. Therefore, various applications of the
sequential multi-task learning can be expected in both the medical and information-science fields.
5 Conclusion
In this paper, we proposed a gait-based age estima-tion method using CNNs. To estimate ages based on differences in gait features depending on gender and generation, we proposed a method composed of three stages of CNNs: a gender estimator, an age-group esti-mator, and an age estimator. The results of the exper-iments using a large-scale gait database ( OULP-Age) yielded an MAE of 5.84 years, which outperforms the benchmarks.
In the future, we plan to perform two studies to enhance age estimation. First, as mentioned in Section4.2, we will train a deeper network formed by chaining CNNs for sev-eral tasks instead of a combination of sequential CNNs. In this way, we can avoid degrading the accuracy of the proposed method due to the incorrect recognition of each task. Second, we need to collect more gait data because the database we used lacks data on elderly subjects. By doing this, we will be able to improve our method for all generations.
a
b
Fig. 10Network architecture of the conventional multi-task CNN (Parallel multi-CNN)
Abbreviations
CNN: Convolutional neural network; CS: Cumulative score; GEI: Gait energy image; GPR: Gaussian process regression; MAE: Mean absolute error; MLG: Multilabel-guided subspace; OPLDA: Ordinary preserving manifold; OULP-Age: The OU-ISIR gait database, Large Population Dataset with Age
Acknowledgements
Not applicable.
Funding
This work was supported by JST-Mirai Program JPMJMI17DH.
Availability of data and materials
The dataset supporting the conclusions of this article is available athttp:// www.am.sanken.osaka-u.ac.jp/BiometricDB/index.html.
Authors’ contributions
AS designed and executed the experiments and wrote the initial draft of the manuscript. NT contributed to the concept and helped to write the manuscript. YY supervised the work as well as gave technical support and conceptual advice. All authors reviewed and approved the final manuscript.
Competing interests
The authors declare that they have no competing interests.
Publisher’s Note
Springer Nature remains neutral with regard to jurisdictional claims in published maps and institutional affiliations.
Author details
1The Institute of Scientific and Industrial Research, Osaka University, Ibaraki, Osaka, 5670047 Japan.2The Institute for Datability Science, Osaka University, Suita, Osaka, 5650871 Japan.
Received: 18 November 2018 Accepted: 22 April 2019
References
1. Geng X, Yin C, Zhou ZH (2013) Facial age estimation by learning from label distributions. IEEE Trans Pattern Anal Mach Intell 35(10):2401–2412. https://doi.org/10.1109/TPAMI.2013.51
2. Guo G, Fu Y, Dyer CR, Huang TS (2008) Image-based human age estimation by manifold learning and locally adjusted robust regression. IEEE Trans Image Proc 17(7):1178–1188.https://doi.org/10.1109/TIP.2008.924280
3. Fu Y, Huang TS (2008) Human age estimation with regression on discriminative aging manifold. IEEE Trans Multimed 10(4):578–584. https://doi.org/10.1109/TMM.2008.921847
4. Zhang YZY, Yeung D-YYD-Y (2010) Multi-task warped Gaussian process for personalized age estimation. 2010 IEEE Conf Comput Vis Pattern Recog (CVPR):2622–2629.https://doi.org/10.1109/CVPR.2010.5539975 5. Niu Z, Zhou M, Wang L, Gao X, Hua G (2016) Ordinal regression with
multiple output CNN for age estimation. 2016 IEEE Conf Comput Vis Pattern Recog (CVPR):4920–4928.https://doi.org/10.1109/CVPR.2016.532 6. Escalera S, Fabian J, Pardo P, Baro X, Gonzalez J, Escalante HJ, Misevic D,
Steiner U, Guyon I (2015) ChaLearn looking at people 2015: apparent age and cultural event recognition datasets and results. Proc IEEE Int Conf Comput Vis 2015-Febru:243–251.https://doi.org/10.1109/ICCVW.2015.40 7. Janssen D, Schöllhorn WI, Newell KM, Jäger JM, Rost F, Vehof K (2011)
Diagnosing fatigue in gait patterns by support vector machines and self-organizing maps. Hum Mov Sci 30(5):966–975.https://doi.org/10. 1016/j.humov.2010.08.010. EWOMS 2009: The European Workshop on Movement Science
8. Liao R, Makihara Y, Muramatsu D, Mitsugami I, Yagi Y, Yoshiyama K, Kazui H, Takeda M (2014) Video-based gait analysis in cerebrospinal fluid tap test for idiopathic normal pressure hydrocephalus patients (in japanese). In: The 15th Annual Meeting of the Japanese Society of NPH, Suita, Japan 9. Takemura N, Makihara Y, Muramatsu D, Echigo T, Yagi Y (2017) On
input/output architectures for convolutional neural network-based cross-view gait recognition. IEEE Trans Circ Syst Video Technol PP(99):1–1. https://doi.org/10.1109/TCSVT.2017.2760835
10. Wu Z, Huang Y, Wang L, Wang X, Tan T (2017) A comprehensive study on cross-view gait based human identification with deep CNNs. IEEE Trans Pattern Anal Mach Intell 39(2):209–226.https://doi.org/10.1109/TPAMI. 2016.2545669
11. Makihara YS, Matovski DS, Nixon MN, Carter J, Yagi Y (2015) Gait recognition: databases, representations, and applications. In: Webster JG, editor. Wiley Encyclopedia of Electrical and Electronics Engineering. https://doi.org/10.1002/047134608X.W8261
12. Bouchrika I, Goffredo M, Carter J, Nixon M (2011) On using gait in forensic biometrics. J Forensic Sci 56(4):882–889. https://doi.org/10.1111/j.1556-4029.2011.01793.x
13. Lynnerup N, Larsen PK (2014) Gait as evidence. IET Biom 3:47–547 14. Iwama H, Muramatsu D, Makihara Y, Yagi Y (2013) Gait verification system
for criminal investigation. Inf Media Technol 8(4):1187–1199.https://doi. org/10.11185/imt.8.1187
15. Makihara Y, Okumura M, Iwama H, Yagi Y (2011) Gait-based age estimation using a whole-generation gait database. In: 2011 International Joint Conference on Biometrics, IJCB 2011.https://doi.org/10.1109/IJCB. 2011.6117531
16. Lu J, Tan YP (2010) Gait-based human age estimation. IEEE Trans Inf Forensics Secur 5(4):761–770.https://doi.org/10.1109/TIFS.2010.2069560 17. Lu J, Tan YP (2013) Ordinary preserving manifold analysis for human age
and head pose estimation. IEEE Trans Hum-Mach Syst 43(2):249–258. https://doi.org/10.1109/TSMCC.2012.2192727
18. Caruana R (1997) Multitask learning. Mach Learn 28(1):41–75.https://doi. org/10.1023/A:1007379606734
19. Xu C, Makihara Y, Ogi G, Li X, Yagi Y, Lu J (2017) The OU-ISIR Gait Database comprising the Large Population Dataset with age and performance evaluation of age estimation. IPSJ Trans. Comput Vis Appl 9:1–14. https://doi.org/10.1109/TIFS.2012.2204253
20. Han J, Bhanu B (2006) Individual recognition using gait energy image. IEEE Trans Pattern Anal Mach Intell 28(2):316–322.https://doi.org/10. 1109/TPAMI.2006.38.arXiv:1307.5748v1
21. He K, Zhang X, Ren S, Sun J (2015) Delving deep into rectifiers: surpassing human-level performance on imagenet classification. CoRR
abs/1502.01852.1502.01852
22. Makihara Y, Kimura T, Okura F, Mitsugami I, Niwa M, Aoki C, Suzuki A, Muramatsu D, Yagi Y (2016) Gait collector: an automatic gait data collection system in conjunction with an experience-based long-run exhibition. In: 2016 International Conference on Biometrics (ICB). pp 1–8. https://doi.org/10.1109/ICB.2016.7550090
23. Kingma DP, Ba J (2014) Adam: a method for stochastic optimization. pp 1–15.https://doi.org/10.1145/1830483.1830503.1412.6980 24. Marín-Jimíenez MJ, Castro FM, Guil N, de la Torre F, Medina-Carnicer R
![Fig. 4 Data example in OULP-Age (cited from [19])](https://thumb-us.123doks.com/thumbv2/123dok_us/843123.1582036/4.595.61.540.502.719/fig-data-example-in-oulp-age-cited-from.webp)