R E G U L A R A R T I C L E
Open Access
Explore with caution: mapping the evolution
of scientific interest in physics
Alberto Aleta
1,2, Sandro Meloni
2,3*, Nicola Perra
4,5and Yamir Moreno
1,2,5*Correspondence:
sandro@ifisc.uib-csic.es
2Institute for Biocomputation and
Physics of Complex Systems (BIFI), University of Zaragoza, Zaragoza, Spain
3IFISC, Institute for
Cross-Disciplinary Physics and Complex Systems (CSIC-UIB), Palma de Mallorca, Spain
Full list of author information is available at the end of the article
Abstract
In the bookThe Essential Tension(1979) Thomas Kuhn described the conflict between tradition and innovation in scientific research—i.e., the desire to explore new
promising areas, counterposed to the need to capitalize on the work done in the past. While it is probable that along their careers many scientists felt this tension, only few works have tried to quantify it. Here, we address this question by analyzing a large-scale dataset, containing all the papers published by the American Physical Society (APS) in 26 years, which allows for a better understanding of scientists’ careers evolution in Physics. We employ the Physics and Astronomy Classification Scheme (PACS) present in each paper to map the scientific interests of 103,246 authors and their evolution along the years. Our results indeed confirm the existence of the “essential tension” with scientists balancing between exploring the boundaries of their area and exploiting previous work. In particular, we found that although the majority of physicists change the topics of their research, they stay within the same broader area thus exploring with caution new scientific endeavors. Furthermore, we quantify the flows of authors moving between different subfields and pinpoint which areas are more likely to attract or donate researchers to the other ones. Overall, our results depict a very distinctive portrait of the evolution of research interests in Physics and can help in designing specific policies for the future.
Keywords: Scientific Interests; PACS; Physics Evolution
1 Introduction
Take a second and think of the main topic of your latest publication. Is it the same of the paper you are currently working on? If you are in the academic business, chances are that the answer to this question is yes. In the case, instead, the answer is no, how far the two topics are? What does far, in this context, even mean?
It is long been acknowledged that researchers are constantly pulled by two opposite forces: the exploration of new directions and the exploitations of an established research agenda [1–5]. The former can lead to ground breaking results, radical new knowledge, acclaim and success, but it is a risky strategy often linked to failure, decrease in produc-tivity and challenges in pushing forward ideas in new academic circles [6,7]. The latter, instead, is a conservative strategy associated to high chances of steady publications out-puts, fair visibility, but it is typically linked to incremental and low-impact as well as low originality outputs [2]. Thomas Kuhn eloquently defined this conflictual situation as “the essential tension” between risky and conservative strategies [1]. In specific fields such
sion has been defined as the perennial fight between conformity and dissent (philosophy of science [8]), succession and subversion (sociology of science [9]) or refinement and risk taking (innovation [3]).
Societal progress, academic success, policies, and funding allocation are the complex outcome of scientists reactions and interactions with this tension. Therefore, it is of crucial importance to quantify and understand how scientific interest, and consequently science, evolves in time. To this end, the digitalisation of publication records is of great help [10, 11]. Authors, affiliations, references, text, and various tags of virtually any publication are now digitally collected (also retrospectively) and stored in databases. The access to such data, often limited to specific journals and/or fields, has boosted the number of studies in-vestigating publication/citation patterns of authors [12–18], papers [19,20], journals [21, 22], institutions [18,23,24], cities [25], or countries [18,26,27]. Arguably, the most popu-lar area of investigation is the development of metrics aimed at ranking scientific outputs at different granularities (from single authors to countries) [12,28–36]. Instead, studies aimed at quantifying or understanding the effects of the “essential tension” mentioned above received far less attention.
pub-lication, collaboration size, and citations), and studied the recognition (i.e. Nobel prizes) of each area of Physics. Although the focus of their research was not the tension between exploration and exploitation, their analysis of the transitions between fields highlighted interesting patterns: (i) Condensed Matter is the starting field of many physicists that then move to Interdisciplinary, Classical, and General Physics, (ii) High Energy and Nu-clear Physics tend to “swap” scientists that might also move towards Astrophysics, and (iii) Plasma and Astrophysics are the fields that “welcome” more physicists from different backgrounds.
In this context, we study the APS dataset considering the period between 1980 and 2006. We use the PACS associated to each paper and investigate the evolution of interest be-tween topics in the careers of scientists. To this end, we first quantify the tendency to-wards exploration and exploitation measuring the similarity, in terms of topics, between the production during the first and last year of activity of each author. We then deepen the analysis characterizing the transition patterns between sub-fields. In particular, we build source (first year of activity)—destination (last year of activity) matrices and study the net-works flows between them. Finally, we study the transitions between fields as a function of time considering the entire career of each author. Our results depict a peculiar landscape with authors balancing between the desire to explore new topics and the need of exploiting the acquired knowledge. These trends seem also to be stable in the last 30 years allowing us to highlight the future evolution paths of the distinct areas of Physics. It is important to mention that although our objectives are aligned with the four papers mentioned above, here we develop/adopt different and complementary metrics. Thus, our results contribute to uncover the complex dynamics of scientific production in time focusing on the tension between exploration and exploitation that any researcher likely faces.
2 Dataset
Figure 1Career duration distribution of the 103,246 authors considered. Distribution of the career duration-measured as the number of years between the first and the last paper—for all the 103,246 authors with at least two papers in two different years present in our dataset
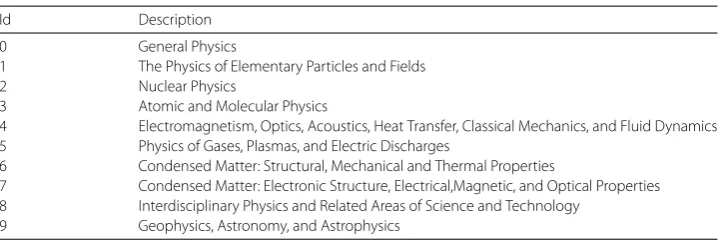
Table 1 Description of the first level of the classification scheme
Id Description 0 General Physics
1 The Physics of Elementary Particles and Fields 2 Nuclear Physics
3 Atomic and Molecular Physics
4 Electromagnetism, Optics, Acoustics, Heat Transfer, Classical Mechanics, and Fluid Dynamics 5 Physics of Gases, Plasmas, and Electric Discharges
6 Condensed Matter: Structural, Mechanical and Thermal Properties
7 Condensed Matter: Electronic Structure, Electrical,Magnetic, and Optical Properties 8 Interdisciplinary Physics and Related Areas of Science and Technology
9 Geophysics, Astronomy, and Astrophysics
only a very small fraction of students enrolled in Ph.D. programs worldwide will get a per-manent position [39] with most of them quitting during the Ph.D. or immediately after. Secondly, the steady increase in the number of researchers and scientific publications in the last decades leading to a doubling of global scientific output every nine years [40].
The PACS classification scheme is organised as a tree composed by four levels. To bet-ter understand its structure let us consider the following PACS number 05.70.Cewhich indicates papers dealing with “thermodynamic functions and equations of state”. The first digit (0) describes the first level: General Physics. This can be chosen among 10 (from 0 to 9). The first and second digit (05) describe the second level: Statistical Physics, Thermody-namics, and Nonlinear Dynamical Systems. There are 68 ids at depth 2 in the classification tree in our dataset. The third level is constituted by the first two digits and by the second number (05.70), Thermodynamics in this case. At the more granular level we need to add the two letters and get the complete description of the PACS given before. To guide the reader to understand what follows, in Table1we report the ids and names associated to the first level of the classification tree.
3 Results
How does the scientific interest of researchers change across time? To provide answers to this question let us first measure the similarity of scientific production at different careers stages. For simplicity, we consider the first (f) and the last (l) year of activity in our dataset. Then, for each career stageS,S∈[f,l], and authoriwe build a vector xi,Sof size equal to the number of PACS at the classification level under consideration, i.e., 10 at the first and 68 at the second level, etc. The vectors are constructed so that the generic component, xi,S,
Figure 2Cosine similarity distribution of authors’ interest who started their careers (published their first paper) in 1980. (panel (A)) We compare authors’ interest vectors between the first and last year of publication. Interest vectorsxi,Swere built using the second level of the classification scheme with 68 PACS. (panel (B))
Comparison between real data (pink bars) and a null model (green bars) where, for each author, an interest vector is constructed selecting, instead of the last year of publication, one year at random from the authors career. Average values and error bars are the results of 103bootstraps. (panel (C)) same comparison of panel
(B) but the distance between vectors has been measured using the Jaccard index instead of the Cosine Similarity
the total number of PACS adopted. To better understand these vectors, consider an author ithat, in the last year of her activity, wrote three papers using a set of five unique PACS. Now assume that one PACS, sayα, has been used in all three papers. The componentαin the vector will bexi,l
α = 3/5. Thus, the components quantify the share of interest, in a
spe-cific year, towards the various PACS. In order to determine the similarity between vectors we use the cosine similarity,θ=cos(γ) =AA·B
2B2, defined for each pair of vectors A and
B. To start getting a feeling about the distribution of the similarities, we first consider all authors that published their first papers in 1980 and compare the first year of publication with their last, using the 68 second level PACS. As it is clearly seen in Fig.2A, two tenden-cies are followed by the largest number of authors:θ> 0.9 andθ< 0.1. Thus, authors were more likely to keep working in the same topics potentially exploring few others, or instead change almost completely the subject of investigation. It is important to notice how the tendency towards a substantial change in research interests is embraced by a higher num-ber of authors while the second, third and forth more likely values are concentred for high values of θ which describe authors covering similar topics during their career. In order to better understand this result, in Fig.2B we compare the distribution ofθ with a null model obtained considering the first and a random year of activity from the career of each author. We repeat this process 1000 times to obtain the confidence intervals shown in the figure. The plot clearly shows how the tendency toward exploration (small value ofθ) is much more prominent when comparing the first and last year of activity rather the first with another year extracted at random. This observation provides the first hint to the fact that exploration is a gradual process. In Fig.2C we repeat this same analysis but consid-ering a different metric: the Jaccard index. This is a test of robustness of the results and to avoid possible spurious effects induced by sparse vectors in the cosine similarity. The figure clearly confirms the picture emerging from the other two panels.
Figure 3Cosine similarity distribution of authors’ interest between the first and last years of their careers measured using the second level of the classification scheme. (panel (A)) Cosine similarity distribution as a function of when they started their careers. (panel (B)) Cosine similarity distribution as a function of the duration of their careers. In both cases there is a clear tendency towards exploration. (panels (C)–(D)) relative change between the data and the null model, measured as the relative error between the two, as a function of the first year of publication (panel (C)) and the career duration (panel (D))
Figure 4Average similarity of authors’ interest between the first and last years of their careers measured using the second level of the
classification scheme. Regardless of the first year of publication the tendency towards exploration is higher the larger the duration of a career is
is done: the culture of “publish or perish” indeed enforces incremental publications at the cost of undermining exploration or more risky career paths. In the future, when we will have more data about the evolution of younger authors, we shall be in a better position to discriminate among these two scenarios. As done above, in order to better understand the picture emerging from the data, we compare the tendencies towards explorations and exploitation with a null model. In this, we compare the first year of publication with an-other extracted at random in the career of each author. We show the results in Fig.3C–D. The colors reflect the relative variation between the values from the panels A–B and the values obtained in the null model. The two figures confirm how the tendency towards ex-ploration is much marked when the first year of activity is compared with the last respect to what we would aspect picking the second vector at random during the career of each author. Furthermore, the plots show how high (low) values of exploitation are over(under)-represented in the null model. Indeed, across different year of first publication and career duration, green cells are concentrated for high values ofθ while red cells for small value of it. This confirms how the exploration is, on average, a gradual process.
As a way to consolidate all the previous observations, in Fig.4we plot the average sim-ilarity as a function of the first year of publication and the career duration. Interestingly, we don’t see any clear dependence on the starting year. The crucial difference is instead on the career duration. Indeed, the largest values of similarity are concentrated in the region of short careers. Authors with long careers instead are more prone to exploration. Hav-ing said that, another interestHav-ing question stems from this result: do authors with longer careers tend to explore more because they have more time or is it that researchers with a higher propensity to exploration usually stay in academia for longer?. To answer this ques-tion, in Fig.5we compare the cosine similarity between the first and the fifth year of career of authors with a career duration of exactly 5 (Fig.5A) and 10 or more years (Fig.5B). The relative change between the similarity profiles (Fig.5C) demonstrates that for strong ex-ploration there are no difference between the two groups and scientists with short careers only have a milder tendency to strong exploitation. This confirms that exploration is more a product of time than a discriminant of scientific careers.
Figure 5Cosine similarity distribution of authors’ interest between the first and 5th year of their careers measured using the second level of the classification scheme. (panel (A)) For authors with a career duration of exactly 5 years. (panel (B)) for authors with a career duration of 10 years or larger and (panel (C)) the relative change between the two
Figure 6Average exploration share (ES) as a function of the first topic used by each author
each author we quantify the fraction of new and old PACS comparing the different career stages. In particular, we define the exploration share (ES) of authoriat stagelor her career as:
ESli=
α
xiα,l1 –Hxiα,f, (1)
whereH[n] is a step function such thatH[n] = 1 forn≥0. In words,ESl
general. Looking inside each area we can see in some cases a large variability, e.g. in Gen-eral Physics. Some sub-topics have a high ES likeMathematical methods in Physics(id. 02) orMetrology, measurements, and laboratory procedures(id. 06) whileGeneral relativity and gravitationshows one of the lowest propensity to exploration of the entire dataset. Along this line, an interesting example is topic id. 35Experimentally derived information on atoms and molecules; instrumentation and techniquesthat, despite a large proportion of papers (more than 800), also presents the largest ES. This is a spurious result due to the fact that id. 35 has been deleted from the 1995 edition of the classification [41] and its topic split along other PACS. Thus, all the scientists working on the topic seemed to suddenly move to other PACS.
So far we have quantified the tendency of authors towards exploration and exploitation. However, when authors explore new topics which ones do they consider? Are there ex-ploration patterns more likely than others? How do these depend on the starting set of interests? To answer these questions, we first build origin-destination matrices by con-sidering the flow of researchers from PACS to PACS comparing the first and last year of activity. Clearly, this analysis neglects trajectories between the two periods, but it offers a first indication of the general trends in scientific interest contrasting two distinct career phases. Let’s define the flow from PACSαto PACSβas:
Mα,β=
i
Hxiα,l
Hxiβ,f
δα,β+ (1 –δα,β)
H[xiβ,l]H[x
i,f
α](1 –H[xiβ,f])
γH[x
i,f
γ ]
. (2)
Each element of the matrix considers all the authors (thus the sum overi). Furthermore, we have two types of elements: inside and outside the diagonal. The first term contributes to the diagonal elements (δα,βis the Kronecker delta) and it assumes a value of 1 for all the
authors that kept working on the PACSαin the first (f) and last (l) year of career. Thus, the term counts how many authors kept interest in the same PACS. The second term instead contributes to the off-diagonal elements. The numerator is equal to 1 for all theα–βpairs that respect the following conditions: the authori(i) did not useβ in the first year, (ii) usedβin the last year, (iii) usedαin the first year. The denominator instead is equal to the number of different PACS used in the first year. Thus, we connect each PACS used in the first year with those used only in the last year as a way to map the evolution in interest and a transition from a set of topics to another set. In Fig.7we report the results considering the first level of the classification. The first panel is obtained considering all the authors in the dataset. The other three instead are obtained distinguishing the researchers by the year of first activity. Some important observations are in order. In general, the diagonal, for all the years, contains the largest values. This result, combined with Figs.2,3and4, highlights an interesting phenomenon. While most of the authors after 4 or 5 years of career almost totally change their interests, they usually remain in the larger area of Physics where they started. In a sense, in each author there is a strong tendency to explore but only within sight from their initial topic. This latter result is the empirical confirmation of the “essential tension” between risky and conservative strategies.
Figure 7Interest flow across decades: (A) all decades; (B) authors who started publishing in the 80’s; (C) authors who started publishing in the 90’s; (D) authors who started publishing in the 00’s. Authors who start studyingyPACS end up sharing their interest acrossxPACS. Each row is normalized over the number of authors who started using that PACS so that the diagonal represents the fraction of authors that kept some interest (see equation (2)) in that PACS at the end of their career
while another interesting observation concerns the sub-field of Physics of Gases, Plas-mas and Electric Discharges (id 5). Indeed, across years we can observe that, with respect to all the other topics, this is the one that is less likely to “attract” researchers from other areas. A similar result holds, although more nuanced, for the field of Geophysics, Astro-physics, and Astronomy. On the other hand, as far as exploration is concerned, the field that is able to attract more authors that initiated their publication record in other sub-jects is General Physics, which is by construction one of the most interdisciplinary fields. Moreover, from the matrices two clusters are clearly visible. The first is formed by Particle and Nuclear Physics. The second instead is formed by the two fields of Condensed Matter and Interdisciplinary Physics. The presence of such cluster implies that, for example, au-thors starting in Particle Physics are more likely, in case they explore new topics, to move towards Nuclear Physics. Finally, it is interesting to note how these patterns are preserved across different generations of researchers that started publishing in different decades.
exploita-tion than exploraexploita-tion. This opposite trend highlights how the essential tension might be a function of the area of study. The second group studied, as we do here, the APS dataset. However, they considered a subset of authors that published at least 16 papers (their re-sults do not change considering 12 or 20). Furthermore, they considered event time (i.e. publications) rather than real time (i.e. years). Thus the sequence of publication of each au-thors does not have gaps (years of inactivity are not accounted for). While this approach is quite useful to eliminate possible issues associated to burstiness, it mixes individuals with very different publication rates and at different career stages. The last point is particularly relevant as the scientific maturity and independence, often necessary for exploration, are not necessarily a function of the number of papers published (especially in some disci-plines that feature large collaborations). Indeed, our results, as well as those by Battiston et al. [38], show that periods before and after the typical PhD duration (3–7 years) are char-acterized by very different tendencies toward exploration. The contrast between the two results highlights a very important point: theinclusionprinciple used to select the sample of scientists under study, and the approach used to account for time, might influence the results. It is important to notice how each methodology features different pros/cons and effectively select a different sample (with possible overlaps). Cleary, more work needs to be done to explore the effects of different approaches aimed at defining which publication record should be considered as signature of a professional scientist.
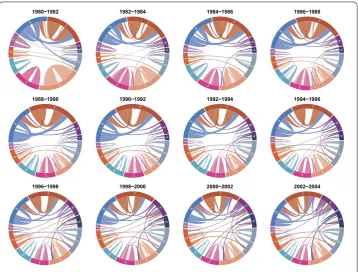
Up to now we have mapped the transitions, that is flows between topics, comparing the first and last year of activity in our database. Next, we deepen our investigation by map-ping the flows as a function of time. To this end, we consider all authors that published a paper in yeartand/ort+ 1. Note that we adopted a two years window to increase the statistics. Then, we consider the fraction of such authors that published a paper also in yeart+ 2 and/ort+ 3. For each bi-annual time window, we dispose PACS in a circle and connect them with links proportionally to how many authors used PACSαand then PACS
Figure 8Authors flow across fields against null model. For each time window (2 years), PACS are disposed in a circle. The width of each arc is proportional to the number of authors who published at least one paper in that field (and that published at least another one the year after). Each field is represented by its PACS number, see Table1. Links represent the number of authors who, having published at least one paper in the source field on the right, also publish at least one paper in the target field on the left (at seen from outside the circle). Only significative links are considered—i.e. links with a Z-score equal or larger than 2 with respect to a null model where links are reshuffled preserving nodes degree and strength. Note that an author can publish papers in several fields in a given time window so that a link does not mean that she changed her field but that, at least, she has some interest on it
4 Conclusions
In this work, we have analysed the different strategies adopted by researchers, during their career in the Physics community, and test the presence of “the essential tension” between exploration and exploitation described by Kuhn [1]. To do so, we mapped the evolution of interests in Physics in the last 30 years relying on a dataset containing all the papers pub-lished in the APS journals in the period 1980–2006. Defining a set of individual and global metrics we quantified the change in the PACS used by authors along their careers. Fur-thermore, we analyzed the source-destination matrices of authors and the network flows between different topics. We were able to detect which areas of Physics serve as “donors” of scientists to other areas and which ones are more likely to “receive” a researcher.
Even if our analysis has several limitations—e.g., our dataset is limited to year 2006 and do not cover Physics papers published in multidisciplinary journals, we indeed confirm the existence of such “tension” between exploring new fields and exploiting the knowl-edge acquired during previous years. Our results demonstrate that, even if the vast ma-jority of the authors almost completely change (gradually) their research interests during their career, they remain in the broader area of Physics—i.e. the first level of the PACS classification—where they started. This “explore with caution” strategy seems to be the best tradeoff between the risk of moving to new fields and taking advance of the work done in the past. These findings are in line with, and complement, previous research that focused on Physics as scientific area. In fact, Jia et al. [5] have clearly identified subject proximity as a critical factor influencing authors’ production. Pan et al. [37] have shown how the networks constructed by using the co-occurrence between PACS densify in time and that such increase in connectivity is hierarchical: close sub-fields connect first. Our results, together with the work by Jia et al. [5], suggest that such temporal dynamics might be indeed driven by the essential tension between exploration and exploitation faced by each author. It is important to notice however how our results are opposite to those pre-sented by Foster et al. [2]. As mentioned in theIntroduction, these authors found that in the area of Biomedical Chemistry exploitation is instead the preferred strategy. This con-trasts with what we found in Physics, and raises an important question for future research: how does the essential tension affect different scientific areas? As mentioned above, our results are also opposite to the findings (in terms of the tendency towards exploration) of Jia et al. [5]. Despite that we used the same dataset, we adopted a very different inclusion principle (to select the sample of authors to study) and measured the career duration not in terms of papers published but in years. This raises another important question for fu-ture work: what constitutes a professional scientist and how should we study her career progression? Indeed, the literature is quite divided in this point. Battiston et al. [38] for example considered only authors that published at least five papers. Jia et al. [5] studied only authors that published at least 16 articles and Pan et al. [37] did not impose any re-strictions (although they did not focus on the evolution of single authors but rather on the evolution of disciplines).
take place, is within 3–7 years, depending on the starting area. Additionally, by defining the “migration flows” of authors between topics, we identified the areas of Physics with the larger vocation to explore and the most probable paths for scientists leaving each area. Physics of Elementary Particles and Nuclear Physics turned out to be the areas with the lowest tendency for exploration but, interestingly, they form a closed cluster with an al-most balanced interchange of scientists—probably due to the relatedness of topics and methodology used. Another tight cluster is the one including the two Condensed Mat-ter and InMat-terdisciplinary Physics. In this case Cond. Mat. (Electronic Structure, Electrical, Magnetic, and Optical Properties) is also a very closed area but with a steady flow of re-searchers from and to the other two areas. Interestingly, these findings are in line with the work by Battiston et al. [38] that, however, studied a much larger set of Physics journals and papers well beyond those published by the APS.
In a nutshell, our results, even if largely in line with previous research, depict a more nuanced portrait of the evolution of research interests than previously thought [2,5,37, 38]. Taking into account the first and second levels of the PACS classification we demon-strated that physicists indeed explore during their career but only in the proximity of their initial research topic. In some sense we can say that the area of the first year of a researcher marks the rest of her career but that inside each area there is ample space to explore new interests. Taken together, our results highlight the high dynamism of the Physics commu-nity and the lines of evolution of the field. Finally, we believe that the results presented in this work can help the design of specific policies to foster the future advancement of Physics and related scientific disciplines.
Funding
This material is based upon work supported by, or in part by, the U.S. Army Research Laboratory and the U.S. Army Research Office under contract/grant number W911NF-18-1-0376. A.A. acknowledges support from Santander via the “Universities International Mobility Awards “program and of the FPI doctoral fellowship program from MINECO, Spain (grant FIS2014-55867-P). S.M. acknowledges partial financial support from the Agencia Estatal de Investigacion (AEI, Spain) and Fondo Europeo de Desarrollo Regional under Project PACSS Project No. RTI2018-093732-B-C22 (MCIU, AEI/FEDER,UE) and through the María de Maeztu Program for units of Excellence in R&D (MDM-2017-0711). Y.M. acknowledges partial support from the Government of Aragón, Spain through a grant to the group FENOL (E36-17R), by MINECO and FEDER funds (grant FIS2017-87519-P) and by Intesa Sanpaolo Innovation Center. The funders had no role in study design, data collection and analysis, decision to publish, or preparation of the manuscript.
Abbreviations
APS, American Physical Society; PACS, Physics and Astronomy Classification Scheme.
Availability of data and materials
The datasets used and/or analysed during the current study are available from the corresponding author on reasonable request.
Competing interests
The authors declare that they have no competing interests.
Authors’ contributions
Designed the research: SM, NP, YM. Performed the analysis: AL. Analyzed the results: AL, SM, NP, YM. Wrote the manuscript: AL, SM, NP, YM. All authors read and approved the final version of the manuscript.
Author details
1Department of Theoretical Physics, University of Zaragoza, Zaragoza, Spain.2Institute for Biocomputation and Physics of
Complex Systems (BIFI), University of Zaragoza, Zaragoza, Spain. 3IFISC, Institute for Cross-Disciplinary Physics and
Complex Systems (CSIC-UIB), Palma de Mallorca, Spain.4Centre for Business Networks Analysis, University of Greenwich,
London, UK.5Institute for Scientific Interchange, ISI Foundation, Turin, Italy.
Publisher’s Note
Springer Nature remains neutral with regard to jurisdictional claims in published maps and institutional affiliations.
References
1. Kuhn TS, Epstein J (1979) The Essential Tension. AAPT
2. Foster JG, Rzhetsky A, Evans JA (2015) Tradition and innovation in scientists’ research strategies. Am Sociol Rev 80(5):875–908
3. March JG (1991) Exploration and exploitation in organizational learning. Organ Sci 2(1):71–87
4. Rzhetsky A, Foster JG, Foster IT, Evans JA (2015) Choosing experiments to accelerate collective discovery. Proc Natl Acad Sci 112(47):14569–14574
5. Jia T, Wang D, Szymanski BK (2017) Quantifying patterns of research-interest evolution. Nat Hum Behav 1:0078 6. Merton RK (1957) Priorities in scientific discovery: a chapter in the sociology of science. Am Sociol Rev 22(6):635–659 7. Kuhn TS (1970) The structure of scientific revolutions, 2nd edn. University of Chicago Press, Chicago
8. Polanyi M, Grene MG (1969) Knowing and being essays
9. Whitley R (2000) The intellectual and social organization of the sciences. Oxford University Press on Demand, London 10. Fortunato S, Bergstrom CT, Börner K, Evans JA, Helbing D, Milojevi´c S, Petersen AM, Radicchi F, Sinatra R, Uzzi B et al
(2018) Science of science. Science 359(6379):0185
11. Clauset A, Larremore DB, Sinatra R (2017) Data-driven predictions in the science of science. Science 355(6324):477–480
12. Hirsch JE (2005) An index to quantify an individual’s scientific research output. Proc Natl Acad Sci 102:16569–16572 13. Egghe L (2006) Theory and practise of the g-index. Scientometrics 69:131–152
14. Hirsch JE (2007) Does the h index have predictive power? Proc Natl Acad Sci 104:19193–19198
15. Mukherjee S, Romero DM, Jones B, Uzzi B (2017) The nearly universal link between the age of past knowledge and tomorrow’s breakthroughs in science and technology: the hotspot. Sci Adv 3(4):1601315
16. Deville P, Wang D, Sinatra R, Song C, Blondel VD, Barabási A-L (2014) Career on the move: geography, stratification, and scientific impact. Sci Rep 4
17. Petersen AM (2015) Quantifying the impact of weak, strong, and super ties in scientific careers. Proc Natl Acad Sci 112(34):4671–4680
18. Guevara MR, Hartmann D, Aristarán M, Mendoza M, Hidalgo CA (2016) The research space: using career paths to predict the evolution of the research output of individuals, institutions, and nations. Scientometrics
109(3):1695–1709
19. Redner S (1998) How popular is your paper? An empirical study of the citation distribution. Eur Phys J B 4:131–134 20. Chen P, Xie H, Maslov S, Redner S (2007) Finding scientific gems with Google’s PageRank algorithm. J Informetr
1:8–15
21. Garfield E (1972) Citation analysis as a tool in journal evaluation. Science 178:471–479
22. Bergstrom C (2007) Eigenfactor: measuring the value and prestige of scholarly journals. Coll Res Libr News 68:314–316
23. Börner K, Penumarthy S, Meiss M, Ke W (2006) Mapping the diffusion of information among major U.S. research institutions. Scientometrics 68:415–426
24. Jones BF, Wuchty S, Uzzi B (2008) Multi-university research teams: shifting impact, geography, and stratification in science. Science 322(5905):1259–1262
25. Bornmann L, Leydesdorff L, Walch-Solimena C, Ettl C (2011) Mapping excellence in the geography of science: an approach based on scopus data. J Informetr 5(4):537–546
26. King DK (2004) The scientific impact of nations. Nature 430:311–316
27. Zhang Q, Perra N, Gonçalves B, Ciulla F, Vespignani A (2013) Characterizing scientific production and consumption in physics. Sci Rep 3
28. Waltman L (2016) A review of the literature on citation impact indicators. J Informetr 10(2):365–391 29. Kaur J, Radicchi F, Menczer F (2013) Universality of scholarly impact metrics. J Informetr 7(4):924–932
30. Sinatra R, Wang D, Deville P, Song C, Barabási A-L (2016) Quantifying the evolution of individual scientific impact. Science 354(6312):5239
31. Radicchi F, Fortunato S, Markines B, Vespignani A (2009) Diffusion of scientific credits and the ranking of scientists. Phys Rev E 80:056103
32. Wang D, Song C, Barabási A-L (2013) Quantifying long-term scientific impact. Science 342(6154):127–132 33. Radicchi F, Fortunato S, Castellano C (2008) Universality of citation distributions: toward an objective measure of
scientific impact. Proc Natl Acad Sci 105(45):17268–17272
34. Fraiberger SP, Sinatra R, Resch M, Riedl C, Barabási A-L (2018) Quantifying reputation and success in art. Science 362(6416):825–829
35. Liu L, Wang Y, Sinatra R, Giles CL, Song C, Wang D (2018) Hot streaks in artistic, cultural, and scientific careers. Nature 559(7714):396
36. Lehmann S, Jackson A, Lautrup B (2008) A quantitative analysis of indicators of scientific performance. Scientometrics 76(2):369–390
37. Pan RK, Sinha S, Kaski K, Saramäki J (2012) The evolution of interdisciplinarity in physics research. Sci Rep 2 38. Battiston F, Musciotto F, Wang D, Barabási A-L, Szell M, Sinatra R (2019) Taking census of physics. Nat Rev Phys 1(1):89 39. editorial (2017) Many junior scientists need to take a hard look at their job prospects. Nature 550(429)
40. Bornmann L, Mutz R (2015) Growth rates of modern science: a bibliometric analysis based on the number of publications and cited references. J Assoc Info Sci Technol 66(11):2215–2222
41. APS: Changes made in the 1995 PACS Scheme (2019)https://journals.aps.org/PACS/pacschg95.html. [Online; accessed 19-January-2019]
42. Sinatra R, Deville P, Szell M, Wang D, Barabási A-L (2015) A century of physics. Nat Phys 11(10):791