R E S E A R C H
Open Access
Relative validity of the food frequency
questionnaire used to assess dietary intake in the
Leiden Longevity Study
Martinette T Streppel
1*, Jeanne HM de Vries
1, Saskia Meijboom
1, Marian Beekman
2,4, Anton JM de Craen
3,
P Eline Slagboom
2,4and Edith JM Feskens
1Abstract
Background:Invalid information on dietary intake may lead to false diet-disease associations. This study was conducted to examine the relative validity of the food frequency questionnaire (FFQ) used to assess dietary intake in the Leiden Longevity Study.
Methods:A total of 128 men and women participating in the Leiden Longevity Study were included in the present validation study. The performance of the FFQ was evaluated using the mean of three 24-hour recalls as the reference method. Evaluation in estimating dietary intake at the group level was done by paired t-tests. The relative validity of the individual energy adjusted level of intake was assessed with correlation analyses (Pearson’s), with correction for measurement error.
Results:On group level, the FFQ overestimated as well as underestimated absolute intake of various nutrients and foods. The Bland and Altman plot for total energy intake showed that the agreement between the FFQ and the 24-hour recalls was dependent of intake level. Pearson correlation coefficients ranged from 0.21 (alpha linolenic acid) to 0.78 (ethanol) for nutrients and from -0.02 (legumes, non-significant) to 0.78 (alcoholic beverages) for foods. Adjustment for energy intake slightly lowered the correlation coefficients for nutrients (mean coefficient: 0.48 versus 0.50), while adjustment for within-subject variation in the 24-h recalls resulted in higher correlation coefficients for both nutrients and foods (mean coefficient: 0.69 for nutrients and 0.65 for foods).
Conclusions:For most nutrients and foods, the ability of the FFQ to rank subjects was acceptable to good.
Keywords:Relative validity, Food frequency questionnaire, 24-hour recall
Background
Because they are able to rank subjects according to their intake and are relatively inexpensive, food frequency questionnaires (FFQs) are often used in epidemiological studies to assess usual dietary intake [1]. In a FFQ, sub-jects report the frequency of consumption and optionally portion sizes of a finite list of food items over a specific period of time in the recent past, for example the previ-ous year or month. Differences in FFQ design character-istics, e.g. the number of food items, the inclusion of portion size questions, and mode of administration, can
affect the validity of a FFQ [2]. Furthermore, the validity of the same FFQ may vary from population to popula-tion. Evaluation of a FFQ is important because invalid information on dietary intake may lead to false diet-disease associations. Therefore, validation studies should be performed to examine the degree to which the FFQ agrees with the subjects’true intake [3]. Moreover, valid-ation studies can be carried out to assess the level of measurement error associated with the FFQ [3].
Within the Leiden Longevity Study, a self-administered FFQ was developed to assess dietary intake. The Leiden Longevity Study (LLS) aims to identify heritable determi-nants explaining the familial differences in human longev-ity. In this study design, measures among offspring of nonagenarians siblings are compared to those among their * Correspondence:Martinette.Streppel@wur.nl
1
Division of Human Nutrition, Wageningen University, Wageningen, The Netherlands
Full list of author information is available at the end of the article
partners that are considered as similarly aged controls from the general population. For potential determinants of healthy ageing we expect that nutrition may be a confounding factor, but dietary intake itself will also be in-vestigated as potential determinant of healthy ageing. In the present study, we report on the relative validity of en-ergy, nutrient and food intake estimated by the FFQ in the offspring of nonagenarians and the control population. We used multiple 24-hour recalls as the reference method.
Methods Subjects
In the LLS, 420 families were recruited if at least two long-lived siblings were alive and fulfilled the age criter-ion of ≥89 years for men and ≥91 years for women [4]. As no proper controls exist for this age group, 1671 off-spring of these nonagenarians, as a group of healthy agers prone to become long-lived, were included for fur-ther studies. This generation carries on average 50% of the genetic advantage of their long-lived parent and was shown to have a 35% lower mortality rate than their birth cohort [4]. In addition, 744 of their partners were included as population-based controls. By recruiting long-lived siblings and their offspring, the population was genetically enriched for longevity [4]. The partners of the offspring were included as the control population as they are likely to have the same environmental back-ground, including dietary habits. Ethical approval was provided through the Medical Ethics Committee of the Leiden University Medical Center. Written informed consent was obtained from all participants.
Information on dietary habits and nutrient intake was only collected in the offspring of nonagenarians and their partners. 1630 Participants (Noffspring=1151, Ncontrol=479) completed a food frequency question-naire (FFQ). Of these, 128 participants (Noffspring=62, Ncontrol=66) reported their 24-hour intake for three days.
Methods of dietary assessment
Using a FFQ, participants reported the intake of foods consumed during the previous month. The FFQ was designed for the Dutch population and based on the VetExpress, a 104-item FFQ, valid for estimating the in-take of energy, total fat, saturated (SFA), monounsatu-rated (MUFA), and polyunsatumonounsatu-rated fatty acids (PUFA), and cholesterol in adults [5]. The VetExpress was updated and extended with vegetables, fruit, and foods for estimating the intake of specific PUFA’s, vitamins, minerals, and flavonoids. To identify relevant foods and food groups for this questionnaire, food consumption data of the Dutch National Food Survey of 1998 were used. Foods that contributed >0.1% to the intake of one
of the nutrients of interest of adults were added in this survey. Thus, the FFQ is expected to include foods that cover the daily intake of each nutrient of food of interest for at least 90%. In a final step, foods were clustered to food items and extended with new foods on the market and foods to guarantee face validity. The FFQ was sent to each study participant, and after completing it, the participants returned the FFQ in an envelope free of postal charge. A dietician went through each FFQ to check for completeness. If necessary, she contacted the participants by telephone and obtained information on unclear or missing items. The FFQ also included ques-tions on adherence to a special diet as well as quesques-tions about the use of dietary supplements.
Some of the offspring and their partners who com-pleted the general questionnaire of the LLS were invited to the clinic for additional measurements at the Leiden University Medical Center. These measurements lasted a half day and couples were invited for the morning pro-gram or the afternoon propro-gram, which were slightly dif-ferent due to practical reasons. The first 24-hour recall was performed in those participants who came to the clinic for the measurement in the morning program [N=128 (Noffspring=62, Ncontrol=66)]. A dietician asked the participants about their dietary intake of the previous day covering all foods and beverages consumed from waking up until the next morning. The dieticians received standardized training, using a formal protocol, to reduce the impact of the interview on the reporting process. For the two remaining recalls, the dietician contacted the participants by telephone within the next seven days. The 24-hour recalls were performed throughout the year and the days were chosen non-consecutively. They include a randomly assigned com-bination of days of the week with all days of the week represented (80% weekdays and 20% weekend days), for each individual.
The food data from both dietary assessment methods were converted into energy and nutrient intake by using the NEVO food composition database of 2006 [6]. Fur-thermore, foods were categorized into 24 major food groups. Age was calculated from date of birth and com-pletion date of the FFQ. For subjects with missing infor-mation on the date of completing the FFQ, we used the median date of the other subjects.
Assessment of additional information
Additional information was collected, including self-reported information on lifestyle (e.g. alcohol consump-tion and smoking habits). In the present study, alcohol use was defined as drinking at least 1 glass of alcoholic beverages per week and current smoking as smoking at least 1 cigarette per month. Information on medical
practitioners. Body mass index (BMI, kg/m2) was calcu-lated using self-reported weight and height.
Statistical analysis
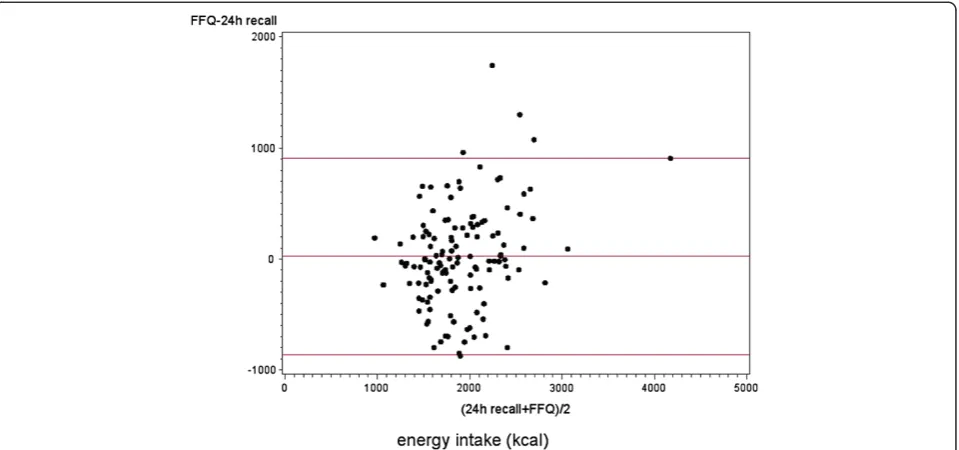
Mean crude and energy-adjusted dietary intake (and SD) was calculated for each dietary assessment method. The performance of the FFQ in estimating dietary intake at the group level was determined by a paired t-test. Agree-ment between the two methods in assessing total energy intake was visualized by plotting the difference between the FFQ and the 24-hour recalls against the mean of the two methods [7]. In addition, we performed linear re-gression analysis with the difference between the FFQ and the 24-hour recalls as the outcome variable and the mean of the two methods as the predictor variable.
The relative validity of the individual energy adjusted level of intake was assessed with correlation analyses (Pearson’s), with correction for measurement error. To correct for attenuation due to within-subject variation in multiple 24-hour recalls (=reference method), the fol-lowing formula was used:
rc¼r0 1þ Sw2=Sb2
=n
0:5
where rc = corrected/de-attenuated correlation coeffi-cient; r0 = uncorrected/attenuated correlation between the FFQ and the 24-hour recalls; Sw2 = within-subject variance of the multiple 24-hour recalls; Sb2=
between-subject variance of the 24-hour recalls; and n= number of repeated measures of the 24-hour recalls.
The ratio of energy intake (EI) to basal metabolic rate (BMR) was calculated to evaluate underreporting. A cut-off value for EI to BMR ratio to identify underreporting was set [8-10]. We assumed a within-subject variation in energy intake of 23%, a within-subject variation in esti-mated BMR of 8.5%, a physical activity level (PAL) of 1.55, and a between-subject variation in PAL of 15%. BMR was predicted from the standard equation from Henryet al.[11].
Results
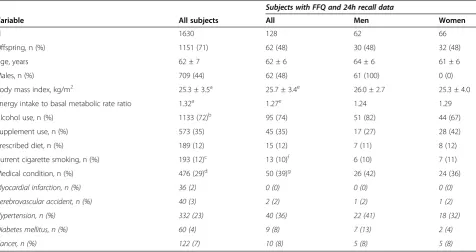
Table 1 shows some background characteristics of study participants who provided FFQ (N=1630) and both FFQ and 24-hour recall data (N=128). The men included in the present validation study (N=61, 48%) were older, had a higher BMI and more often hypertension and diabetes as compared to the women. In contrast, the women more often used dietary supplements. Aside from the percentage of offspring and subjects with a medical con-dition, the characteristics of the subjects in the present validation study were comparable to all participants of the LLS study that provided FFQ data.
Energy and nutrient intake
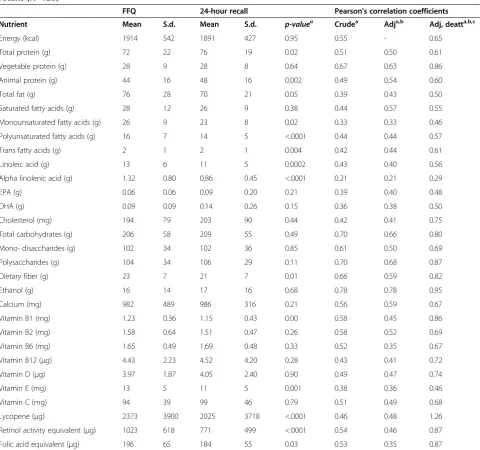
In Table 2, the mean energy and nutrient intake for the FFQ and 24-hour recalls (N=128) is presented. For
Table 1 Baseline characteristics of participants of the Leiden Longevity Study providing FFQ data
Subjects with FFQ and 24h recall data
Variable All subjects All Men Women
N 1630 128 62 66
Offspring, n (%) 1151 (71) 62 (48) 30 (48) 32 (48)
Age, years 62 ± 7 62 ± 6 64 ± 6 61 ± 6
Males, n (%) 709 (44) 62 (48) 61 (100) 0 (0)
Body mass index, kg/m2 25.3 ± 3.5a 25.7 ± 3.4e 26.0 ± 2.7 25.3 ± 4.0
Energy intake to basal metabolic rate ratio 1.32a 1.27e 1.24 1.29
Alcohol use, n (%) 1133 (72)b 95 (74) 51 (82) 44 (67)
Supplement use, n (%) 573 (35) 45 (35) 17 (27) 28 (42)
Prescribed diet, n (%) 189 (12) 15 (12) 7 (11) 8 (12)
Current cigarette smoking, n (%) 193 (12)c 13 (10)f 6 (10) 7 (11)
Medical condition, n (%) 476 (29)d 50 (39)g 26 (42) 24 (36)
Myocardial infarction, n (%) 36 (2) 0 (0) 0 (0) 0 (0)
Cerebrovascular accident, n (%) 40 (3) 2 (2) 1 (2) 1 (2)
Hypertension, n (%) 332 (23) 40 (36) 22 (41) 18 (32)
Diabetes mellitus, n (%) 60 (4) 9 (8) 7 (13) 2 (4)
Cancer, n (%) 122 (7) 10 (8) 5 (8) 5 (8)
MUFA, PUFA, and dietary fiber, mean intake as esti-mated by the FFQ was significantly higher than the in-take estimated by the 24-hour recalls. In contrast, mean intake of total protein, animal protein, trans fatty acids and polysaccharides was lower when estimated by the FFQ as compared to the 24-hour recalls. In addition, the estimated mean intake of vitamin B1, E, lycopene, ret-inol activity equivalents (RAE) and folic acid equivalents (FAE) by the FFQ was significantly higher than by the 24-hour recalls. Figure 1 shows the Bland-Altman plot for total energy intake. We observed an increasing differ-ence between the FFQ and 24-hour recalls with increasing
mean values of total energy intake (intercept: -554.04, p-value: 0.002; slope: 0.299 per kcal increase, p-value: 0.001).
The correlation coefficients between the FFQ and 24-hour recalls ranged from 0.21 for alpha linolenic acid (ALA) intake to 0.78 for ethanol intake (mean: 0.50; Table 2). Adjustment for total energy intake resulted in slightly lower correlation coefficients for most nutrients
[mean: 0.48; range 0.21 (ALA) – 0.78 (ethanol)].
Ad-justment for the within-subject variation of the re-peated 24-hour recalls resulted in de-attenuated and adjusted correlation coefficients ranging from 0.29 for
Table 2 Difference in energy and nutrient intakes and Pearson’s correlation coefficients between the FFQ and 24-hour recalls (N=128)
FFQ 24-hour recall Pearson's correlation coefficients
Nutrient Mean S.d. Mean S.d. p-valuea Crudea Adja,b Adj, deatta,b,c
Energy (kcal) 1914 542 1891 427 0.95 0.55 - 0.65
Total protein (g) 72 22 76 19 0.02 0.51 0.50 0.61
Vegetable protein (g) 28 9 28 8 0.64 0.67 0.63 0.86
Animal protein (g) 44 16 48 16 0.002 0.49 0.54 0.60
Total fat (g) 76 28 70 21 0.05 0.39 0.43 0.50
Saturated fatty acids (g) 28 12 26 9 0.38 0.44 0.57 0.55
Monounsaturated fatty acids (g) 26 9 23 8 0.02 0.33 0.33 0.46
Polyunsaturated fatty acids (g) 16 7 14 5 <.0001 0.44 0.44 0.57
Trans fatty acids (g) 2 1 2 1 0.004 0.42 0.44 0.61
Linoleic acid (g) 13 6 11 5 0.0002 0.43 0.40 0.56
Alpha linolenic acid (g) 1.32 0.80 0.86 0.45 <.0001 0.21 0.21 0.29
EPA (g) 0.06 0.06 0.09 0.20 0.21 0.39 0.40 0.48
DHA (g) 0.09 0.09 0.14 0.26 0.15 0.36 0.38 0.50
Cholesterol (mg) 194 79 203 90 0.44 0.42 0.41 0.75
Total carbohydrates (g) 206 58 209 55 0.49 0.70 0.66 0.80
Mono- disaccharides (g) 102 34 102 36 0.85 0.61 0.50 0.69
Polysaccharides (g) 104 34 106 29 0.11 0.70 0.68 0.87
Dietary fiber (g) 23 7 21 7 0.01 0.66 0.59 0.82
Ethanol (g) 16 14 17 16 0.68 0.78 0.78 0.95
Calcium (mg) 982 489 986 316 0.21 0.56 0.59 0.67
Vitamin B1 (mg) 1.23 0.36 1.15 0.43 0.00 0.58 0.45 0.86
Vitamin B2 (mg) 1.58 0.64 1.51 0.47 0.26 0.58 0.52 0.69
Vitamin B6 (mg) 1.65 0.49 1.69 0.48 0.33 0.52 0.35 0.67
Vitamin B12 (μg) 4.43 2.23 4.52 4.20 0.28 0.43 0.41 0.72
Vitamin D (μg) 3.97 1.87 4.05 2.40 0.90 0.49 0.47 0.74
Vitamin E (mg) 13 5 11 5 0.001 0.38 0.36 0.46
Vitamin C (mg) 94 39 99 46 0.79 0.51 0.49 0.68
Lycopene (μg) 2373 3900 2025 3718 <.0001 0.46 0.48 1.26
Retinol activity equivalent (μg) 1023 618 771 499 <.0001 0.54 0.46 0.87
Folic acid equivalent (μg) 196 65 184 55 0.03 0.53 0.35 0.87
ALA to 1.26 for lycopene (mean: 0.69). The effect of de-attenuation was most pronounced for dietary chol-esterol, vitamin B12 and lycopene, due to the relatively large day-to-day variation.
The average ratio of EI to BMR was 1.32 for the total LLS population (N=1630) and 1.27 for the subjects in-cluded in the present study (N=128; Table 1). These ra-tios are below the estimated cut-off values (1.54 for the total LLS population and 1.50 for the subjects in the present study) Linear regression analyses showed that there was a significant inverse association between the
EI to BMR ratio and BMI (slope: -0.029 per kg/m2
in-crease, p-value: <.0001). On an individual level, 30% of the total LLS population that provided FFQ data had an EI to BMR ratio below the individual cut-off value of 1.10. This percentage was a bit higher in the subjects se-lected for the present study (34%).
Food consumption
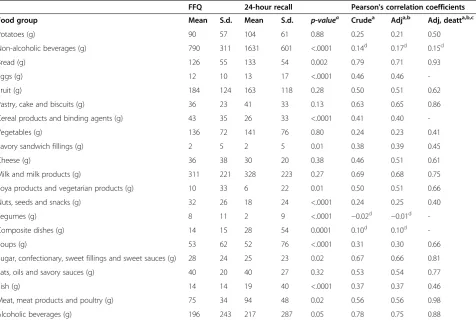
The average consumption of foods for the FFQ and 24-hour recalls (N=128) is presented in Table 3. For most food groups, there was a significant difference in average consumption estimated by the FFQ and the consump-tion estimated by the 24-hour recalls. The average con-sumption of cereal products, savory sandwich fillings, soya and vegetarian products, nuts and seeds, legumes, and sugar and sweets was higher when estimated by the FFQ as compared to the 24-hour recalls. In contrast, the average consumption of non-alcoholic beverages, bread, eggs, composite dishes, soups, fish, and meat products were lower when estimated by the FFQ.
For non-alcoholic beverages, legumes, and composite dishes, we observed no correlation between the intake estimated by the FFQ and the 24-hour recalls (Table 3). For the other food groups, the correlation coefficients ranged from 0.24 for vegetable consumption to 0.79 for bread consumption (mean: 0.49). Adjustment for total energy intake did not change these correlation coeffi-cients. The de-attenuated and adjusted correlation coef-ficients ranged from 0.40 for nuts, seeds and snacks to 0.98 for meat, meat products and poultry (mean: 0.65). The effect of de-attenuation was most pronounced for potatoes, vegetables, nuts and seeds, soups, and meat products.
Discussion
sample of the total LLS population that provided FFQ data with respect to age, gender, BMI, and lifestyle fac-tors, like smoking habits, alcohol use and being on a prescribed diet. Therefore, the findings of the validation study can be extrapolated to the total LLS population.
Although the estimated mean energy intake did not differ between the FFQ and 24-hour recalls, we did ob-serve that the agreement worsened as total energy intake increased. Siebelinket al.assessed how accurately partic-ipants report their energy intake by a comparable FFQ; they compared reported energy intake with actual energy intake needed to maintain a stable body weight during controlled dietary trials [12]. Just like the present study,
Siebelink et al. observed a general trend of
under-reporting of energy intake at lower intakes and over-reporting at higher intakes [12]. These results suggest the FFQ is able to estimate total energy intake on a group level, but not on an individual level.
To study diet-disease relationships, ranking of subjects according to their dietary intake is more important than estimating their absolute intake level. Therefore, we ex-amined the relative validity of the FFQ as compared to
the 24-hour recalls by calculating Pearson’s correlation coefficients. Adjustment for measurement error in the 24-hour recalls resulted in higher correlation coeffi-cients. For most nutrients and foods, we observed ac-ceptable to (very) good correlations between the FFQ and 24-hour recalls. For the macronutrients, vitamins and minerals, the correlations were comparable to other FFQs [2,3,13,14]. With regard to SFA, MUFA, and PUFA, the correlations were lower than found for the original VetExpress questionnaire [5]. However, the cor-relations observed by Feunekes et al. [5] were probably overestimated because they used a dietary history as ref-erence method which is based on the same principle as the FFQ. Although the FFQ in the LLS was designed to assess habitual ALA intake, we observed a poor correl-ation (r<0.30) between the FFQ and 24-hour recalls, even after adjustment for measurement error in the 24-hour recalls. In the Netherlands, average ALA intake is about 1.7 g per day in men and 1.2 gram per day in women [15]. This is lower than the intake estimated using the mean of three 24-hour recalls in the present validation study. As ALA occurs in foods that are
Table 3 Difference in food consumption and Pearson’s correlation coefficients between the FFQ and 24-hour recalls (N=128)
FFQ 24-hour recall Pearson's correlation coefficients
Food group Mean S.d. Mean S.d. p-valuea Crudea Adja,b Adj, deatta,b,c
Potatoes (g) 90 57 104 61 0.88 0.25 0.21 0.50
Non-alcoholic beverages (g) 790 311 1631 601 <.0001 0.14d 0.17d 0.15d
Bread (g) 126 55 133 54 0.002 0.79 0.71 0.93
Eggs (g) 12 10 13 17 <.0001 0.46 0.46
-Fruit (g) 184 124 163 118 0.28 0.50 0.51 0.62
Pastry, cake and biscuits (g) 36 23 41 33 0.13 0.63 0.65 0.86
Cereal products and binding agents (g) 43 35 26 33 <.0001 0.41 0.40
-Vegetables (g) 136 72 141 76 0.80 0.24 0.23 0.41
Savory sandwich fillings (g) 2 5 2 5 0.01 0.38 0.39 0.45
Cheese (g) 36 38 30 20 0.38 0.46 0.51 0.61
Milk and milk products (g) 311 221 328 223 0.27 0.69 0.68 0.75
Soya products and vegetarian products (g) 10 33 6 22 0.01 0.50 0.51 0.66
Nuts, seeds and snacks (g) 32 26 18 24 <.0001 0.24 0.25 0.40
Legumes (g) 8 11 2 9 <.0001 −0.02d −0.01d
-Composite dishes (g) 14 15 28 54 0.0001 0.10d 0.10d
-Soups (g) 53 62 52 76 <.0001 0.31 0.30 0.66
Sugar, confectionary, sweet fillings and sweet sauces (g) 28 24 25 23 0.02 0.67 0.66 0.81
Fats, oils and savory sauces (g) 40 20 40 27 0.32 0.53 0.54 0.77
Fish (g) 14 14 19 40 <.0001 0.37 0.37 0.46
Meat, meat products and poultry (g) 75 34 94 48 0.02 0.56 0.56 0.98
Alcoholic beverages (g) 196 243 217 287 0.05 0.78 0.75 0.88
consumed infrequently, our reference method may not be suitable to validate the FFQ with regard to ALA in-take. Other FFQ validation studies used biomarkers or weighted food records that assess the intake >7 days. In these studies, the summarized correlation for ALA was poor for studies that used biomarkers as reference and acceptable for studies that used weighted food records as reference [16].
In addition to nutrients, we also examined the relative validity of the FFQ in estimating habitual consumption of foods. The crude correlation between the FFQ and 24-hour recalls was low for potatoes, vegetables, and nuts and seeds. These correlations were also lower than those observed for the Dutch EPIC questionnaire [17]. However, adjustment for measurement error in the 24-hour recalls resulted in acceptable correlations (r>0.40) for these foods. For non-alcoholic beverages, legumes, and composite dishes, we observed no correlation be-tween the FFQ and the 24-hour recalls. In the Netherlands, legumes are consumed infrequently and using the mean of three 24-hour recalls as a reference method may not be not appropriate. With regard to non-alcoholic beverages, our FFQ seems to be unsuit-able to rank subjects according to their intake. This is in contrast with the correlation for the Dutch EPIC ques-tionnaire, which was good (r=0.67 for men and 0.49 for women). Our FFQ was not designed to estimate the in-take of liquids and–contrary to the EPIC questionnaire– did not include specific questions about tap water. This may explain the large difference between the intake of non-alcoholic beverages estimated by the 24-hour recalls and the intake estimated by the FFQ found in the present study.
To evaluate underreporting, we calculated EI to BMR ratios and compared them to predetermined cut-off values [8-10]. The calculated EI to BMR ratios indicated underreporting of energy intake on group level. Previous
studies have suggested that the probability of
underreporting increases with increasing BMI [18]. In the present validation study, we indeed observed an in-verse association between the EI to BMR ratio and BMI, indicating that the magnitude of underreporting in-creases with increasing BMI. This may affect diet-disease relationships. On individual level, ~30% of the subjects had an EI to BMR ratio below the cut-off value. According to Black [9], data on physical activity are needed to identify diet reports of poor validity. Unfortu-nately, this information was not available in the present study. To set the cut-off values for underreporting, we as-sumed a PAL of 1.55, which is the estimated average for a sedentary lifestyle. When the actual PAL is higher, the magnitude of underreporting on group and individual level in the present study is higher. However, as a FFQ is in general not suitable to estimate an individual’s absolute
energy intake, and one should be careful when excluding subjects with an EI to BMR ratio below the cut-off value.
A vital component in validating a FFQ is the selection of the appropriate reference method. We used 24-hour recalls as the reference method. 24-Hour recalls are suit-able to assess dietary intake on group levels but repeated recalls are needed to estimate usual intake, i.e. capture daily variation at an individual level [1]. The mean of three 24-hour recalls, as was used in the present study, may not be sufficient to capture the daily variation of foods that are consumed infrequently. As a result, the reference method will perform worse in estimating usual consumption of those foods–and thus the intake of spe-cific nutrients from those foods–than a FFQ. In general, using another dietary assessment method as reference has its limitations. In their literature review, Poslusna et al. found that misreporting also occurs when using 24-hour recalls or food records to estimate dietary
in-take [19]. Thus, measurement errors –both systematic
as well as random errors– exist in every dietary assess-ment method. For validation, especially the random er-rors need to be uncorrelated; however, this is usually not the case when using another dietary assessment method as reference. A FFQ and a 24-hour recall share common errors as they are both methods based on memory and the same food composition table is used to convert the foods to energy and nutrient intake. Random variation in the 24-hour recalls and the correlated errors in the repeated recalls may underestimate the correlation between the intake assessed with the FFQ and the true intake. On the other hand, correlated errors between the FFQ and the 24-hour recalls may overestimate this cor-relation. Nowadays, dietary biomarkers, i.e. biochemical indicators of dietary intake or nutritional status; indexes of nutrient metabolism; or markers of the biological con-sequences of dietary intake [20], are more often being used as reference method as they are an objective meas-ure of dietary intake and are independent of all the biases and errors associated with dietary assessment methods [21,22]. Unfortunately, no data on dietary bio-markers were available in this validation study.
Conclusions
For most nutrient and foods, the ability of the FFQ to rank subjects according to their dietary intake was ac-ceptable to good. The FFQ developed to assess dietary intake in the LLS can be used to study diet-disease relationships.
Abbreviations
Competing interests
The authors declare they have no competing interests.
Authors’contributions
The contributions of the authors were as follows: MS participated in the manuscript conception, statistical analyses, data interpretation, manuscript writing and revising; JdV and SM contributed to the design of the study, development of the FFQ and data collection, and participated in data interpretation and review; MB, AdC, and ES contributed to the conception of the study, data interpretation and review; EF participated in the conception and design of the study, manuscript conception, data interpretation, writing and review. All authors contributed to the critical revision of the manuscript. All authors read and approved the final manuscript.
Acknowledgements
The research leading to these results has received funding from the European Union's Seventh Framework Programme (FP7/2007-2011) under grant agreement no. 259679. This study was supported by a grant from the Innovation-Oriented Research Program on Genomics (SenterNovem IGE05007), the Centre for Medical Systems Biology, and the Netherlands Consortium for Healthy Ageing (grant 050-060-810), all in the framework of the Netherlands Genomics Initiative, Netherlands Organization for Scientific Research (NWO), and by Unilever Colworth.
Author details 1
Division of Human Nutrition, Wageningen University, Wageningen, The Netherlands.2Department of Molecular Epidemiology, Leiden University Medical Center, Leiden, The Netherlands.3Department of Gerontology and Geriatrics, Leiden University Medical Center, Leiden, The Netherlands. 4
Netherlands Consortium for Healthy Ageing, Leiden, The Netherlands.
Received: 20 July 2012 Accepted: 22 May 2013 Published: 7 June 2013
References
1. Willett W:Nutritional Epidemiology.New York: Oxford University Press; 1998. 2. Molag ML, de Vries JH, Ocke MC, Dagnelie PC, van den Brandt PA, Jansen
MC, van Staveren WA, van't Veer P:Design characteristics of food frequency questionnaires in relation to their validity.Am J Epidemiol 2007,166:1468–1478.
3. Cade JE, Burley VJ, Warm DL, Thompson RL, Margetts BM:Food-frequency questionnaires: a review of their design, validation and utilisation.Nutr Res Rev2004,17:5–22.
4. Schoenmaker M, de Craen AJ, de Meijer PH, Beekman M, Blauw GJ, Slagboom PE, Westendorp RG:Evidence of genetic enrichment for exceptional survival using a family approach: the Leiden Longevity Study.Eur J Hum Genet2006,14:79–84.
5. Feunekes GI, Van Staveren WA, De Vries JH, Burema J, Hautvast JG:Relative and biomarker-based validity of a food-frequency questionnaire estimating intake of fats and cholesterol.Am J Clin Nutr1993,58:489–496. 6. NEVO-tabel:Nederlands Voedingsstoffenbestand 2006.Den Haag:
Voedingscentrum; 2006.
7. Bland JM, Altman DG:Statistical methods for assessing agreement between two methods of clinical measurement.Lancet1986,1:307–310. 8. Black AE:Critical evaluation of energy intake using the Goldberg cut-off
for energy intake:basal metabolic rate. A practical guide to its calculation, use and limitations.Int J Obes Relat Metab Disord2000, 24:1119–1130.
9. Black AE:The sensitivity and specificity of the Goldberg cut-off for EI:BMR for identifying diet reports of poor validity.Eur J Clin Nutr2000, 54:395–404.
10. Goldberg GR, Black AE, Jebb SA, Cole TJ, Murgatroyd PR, Coward WA, Prentice AM:Critical evaluation of energy intake data using fundamental principles of energy physiology: 1. Derivation of cut-off limits to identify under-recording.Eur J Clin Nutr1991,45:569–581.
11. Henry CJ:Basal metabolic rate studies in humans: measurement and development of new equations.Public Health Nutr2005,8:1133–1152. 12. Siebelink E, Geelen A, de Vries JH:Self-reported energy intake by FFQ compared with actual energy intake to maintain body weight in 516 adults.Br J Nutr2011,106:274–281.
13. Henriquez-Sanchez P, Sanchez-Villegas A, Doreste-Alonso J, Ortiz-Andrellucchi A, Pfrimer K, Serra-Majem L:Dietary assessment methods for micronutrient intake: a systematic review on vitamins.Br J Nutr2009, 102(Suppl 1):S10–S37.
14. Serra-Majem L, Pfrimer K, Doreste-Alonso J, Ribas-Barba L, Sanchez-Villegas A, Ortiz-Andrellucchi A, Henriquez-Sanchez P:Dietary assessment methods for intakes of iron, calcium, selenium, zinc and iodine.Br J Nutr2009, 102(Suppl 1):S38–S55.
15. Hulshof KF, van Erp-Baart MA, Anttolainen M, Becker W, Church SM, Couet C, Hermann-Kunz E, Kesteloot H, Leth T, Martins I,et al:Intake of fatty acids in western Europe with emphasis on trans fatty acids: the TRANSFAIR Study.Eur J Clin Nutr1999,53:143–157.
16. Overby NC, Serra-Majem L, Andersen LF:Dietary assessment methods on n-3 fatty acid intake: a systematic review.Br J Nutr2009,
102(Suppl 1):S56–S63.
17. Ocke MC, Bueno-de-Mesquita HB, Goddijn HE, Jansen A, Pols MA, van Staveren WA, Kromhout D:The Dutch EPIC food frequency questionnaire. I. Description of the questionnaire, and relative validity and
reproducibility for food groups.Int J Epidemiol1997,26(Suppl 1):S37–S48. 18. Livingstone MB, Black AE:Markers of the validity of reported energy
intake.J Nutr2003,133(Suppl 3):895S–920S.
19. Poslusna K, Ruprich J, de Vries JH, Jakubikova M, van't Veer P:Misreporting of energy and micronutrient intake estimated by food records and 24 hour recalls, control and adjustment methods in practice.Br J Nutr2009, 101(Suppl 2):S73–S85.
20. Potischman N, Freudenheim JL:Biomarkers of nutritional exposure and nutritional status: an overview.J Nutr2003,133(Suppl 3):873S–874S. 21. Kaaks R, Ferrari P, Ciampi A, Plummer M, Riboli E:Uses and limitations of
statistical accounting for random error correlations, in the validation of dietary questionnaire assessments.Public Health Nutr2002,5:969–976. 22. Kaaks RJ:Biochemical markers as additional measurements in studies of
the accuracy of dietary questionnaire measurements: conceptual issues. Am J Clin Nutr1997,65:1232S–1239S.
doi:10.1186/1475-2891-12-75
Cite this article as:Streppelet al.:Relative validity of the food frequency questionnaire used to assess dietary intake in the Leiden Longevity Study.Nutrition Journal201312:75.
Submit your next manuscript to BioMed Central and take full advantage of:
• Convenient online submission
• Thorough peer review
• No space constraints or color figure charges
• Immediate publication on acceptance
• Inclusion in PubMed, CAS, Scopus and Google Scholar
• Research which is freely available for redistribution