R E S E A R C H
Open Access
A methodological framework for the improved
use of routine health system data to evaluate
national malaria control programs: evidence
from Zambia
Adam Bennett
1,2*, Joshua Yukich
2, John M Miller
3, Penelope Vounatsou
4,5, Busiku Hamainza
6, Mercy M Ingwe
6,
Hawela B Moonga
6, Mulakwo Kamuliwo
6, Joseph Keating
2, Thomas A Smith
4,5, Richard W Steketee
3and
Thomas P Eisele
2Abstract
Background:Due to challenges in laboratory confirmation, reporting completeness, timeliness, and health access, routine incidence data from health management information systems (HMIS) have rarely been used for the rigorous evaluation of malaria control program scale-up in Africa.
Methods:We used data from the Zambia HMIS for 2009–2011, a period of rapid diagnostic and reporting scale-up, to evaluate the association between insecticide-treated net (ITN) program intensity and district-level monthly confirmed outpatient malaria incidence using a dose–response national platform approach with district-time units as the unit of analysis. A Bayesian geostatistical model was employed to estimate longitudinal district-level ITN coverage from household survey and programmatic data, and a conditional autoregressive model (CAR) was used to impute missing HMIS data. The association between confirmed malaria case incidence and ITN program intensity was modeled while controlling for known confounding factors, including climate variability, reporting, testing, treatment-seeking, and access to health care, and additionally accounting for spatial and temporal autocorrelation.
Results:An increase in district level ITN coverage of one ITN per household was associated with an estimated 27% reduction in confirmed case incidence overall (incidence rate ratio (IRR): 0 · 73, 95% Bayesian Credible Interval (BCI): 0 · 65–0 · 81), and a 41% reduction in areas of lower malaria burden.
Conclusions:When improved through comprehensive parasitologically confirmed case reporting, HMIS data can become a valuable tool for evaluating malaria program scale-up. Using this approach we provide further evidence that increased ITN coverage is associated with decreased malaria morbidity and use of health services for malaria illness in Zambia. These methods and results are broadly relevant for malaria program evaluations currently ongoing in sub-Saharan Africa, especially as routine confirmed case data improve.
Keywords:Malaria, Evaluation, Integrated Nested Laplace Approximation (INLA), Insecticide-treated nets, Health management information systems (HMIS)
* Correspondence:[email protected]
1Malaria Elimination Initiative, Global Health Group, University of California, San Francisco, 550 16th St, San Francisco, CA 94143, USA
2Center for Applied Malaria Research and Evaluation, Tulane University of Public Health and Tropical Medicine, 1440 Canal St., Suite 2200, New Orleans, LA 70112, USA
Full list of author information is available at the end of the article
Introduction
As countries in sub-Saharan Africa (SSA) continue to scale up malaria control interventions with many moving toward elimination, rigorous evaluations are needed to en-sure national programs are achieving desired impacts on malaria burden. While repeated national household sur-veys remain important for monitoring trends in popula-tion intervenpopula-tion coverage, their usefulness for assessing trends in the malaria burden will be limited in countries achieving low parasite prevalence where impractically large sample sizes are required to assess changes over time and across subnational areas [1]. As such, the use of rou-tine health system data on malaria cases and deaths will become increasingly important for impact evaluation pur-poses. However, because of the known biases of routine malaria incidence data measured through health manage-ment information systems (HMIS) [2], these data have rarely been used to provide rigorous evidence of program effectiveness for decision-making in Africa [3].
Although time series HMIS data have been used for so-phisticated climate modeling and early warning systems [4], to date most uses of HMIS data for program evalu-ation in Africa have been simple comparisons of pre- and post-intervention trends in rates of malaria case incidence and deaths [5]. Only in rare cases have such studies dir-ectly controlled for important confounding factors, includ-ing changinclud-ing diagnostic confirmation practices, access and use of health services, HMIS completeness, and rainfall and temperature, all of which likely lead to biased findings of program effectiveness [2,6].
In addition, a particular issue with evaluating the impact of national malaria control programs is that they normally attempt to cover all at-risk populations with interventions, which precludes the availability of a contemporaneous control group. This challenge of evaluating full-coverage programs is by no means unique to malaria or public health. As a possible solution to this challenge, Victora and colleagues (2011) proposed an evolution in evaluation design for large-scale health programs that uses the dis-trict as the unit of analysis to test for a dose–response re-lationship between program inputs (or coverage) and health outcomes, referred to by the authors as a national platform analysis [7]. Graves and colleagues (2008) pre-viously used such an approach in their evaluation of vector control scale-up in Eritrea on the outcome of HMIS-derived malaria case incidence, while accounting for climate variability [8]. However, while their study is a significant advancement over simple analysis of HMIS trends over time, they did not account for malaria diagno-sis practices, health services access, treatment-seeking, and spatial and other unobserved correlations in the data.
Zambia has successfully scaled up insecticide-treated mosquito nets (ITNs) since 2005, with 64% of households owning at least one as of 2010 [9]. Since 2009, Zambia has
achieved national-level access to rapid diagnostic tests (RDTs) and has invested substantial resources at improv-ing HMIS malaria data collection and reportimprov-ing. As a re-sult, Zambia provides an example where prevalence was historically high, but effective control has achieved an en-vironment of intervention-suppressed transmission, and confirmed case data from HMIS are increasingly available in addition to survey prevalence data to measure trends in the malaria burden. However, because of the recent scale-up of RDTs and improved health access, use of HMIS case incidence to evaluate malaria program performance must account for improving diagnostic confirmation, HMIS reporting, and access to health services, or results could erroneously suggest the malaria burden is getting worse as malaria control interventions are scaled up.
Here we present results from a district-level evaluation design that was used to assess the dose–response rela-tionship between ITN program intensity and HMIS-derived confirmed malaria case incidence in Zambia be-tween 2009 and 2011. In doing so, we present a novel framework for rigorously evaluating full-coverage malaria programs, as well as child survival programs in general, that rely on imperfect HMIS data, by controlling for vari-ability in diagnostic procedures, completeness of report-ing, access and demand for health services, and climate, while accounting for the inherent correlation of these types of data across time and space.
Methods
Study site
Study design and participants
A dose–response ecological analysis was conducted with district-months as the unit of analysis to evaluate the as-sociation between ITN program intensity and outpatient malaria case incidence. Data from the Zambia HMIS on all monthly reported confirmed and clinical (uncon-firmed) outpatient malaria cases from 2009–2011 were included. Data before 2009 were excluded as cases up to this point were reported only on a quarterly basis, a large proportion of facilities did not report, and parasito-logical confirmation was not widespread or reported. Strengthening the Reporting of Observational studies in Epidemiology (STROBE) guidelines were followed for the reporting of methods and results [12].
Primary outcomes
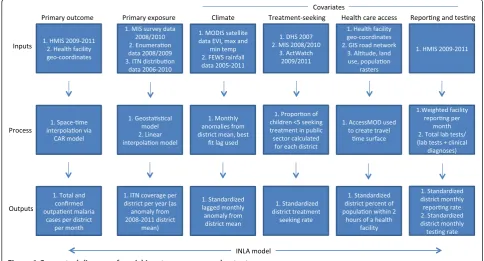
A conceptual diagram of steps taken to create all variables for analysis is provided in Figure 1, and detailed descrip-tion of data preparadescrip-tion is provided in Addidescrip-tional file 1. The primary outcomes included monthly confirmed and total (confirmed + unconfirmed) outpatient malaria cases aggregated at the district level. Before aggregating to the district level, we imputed all missing facility-level monthly outpatient malaria values based upon the spatial location of the facility and the month in which it occurred using Bayesian conditional autoregressive models.
Measures of primary exposure variables
The primary exposure variable for this analysis was ITN coverage measured as ITNs per household at the district
level per year. Bayesian geostatistical models were first used to produce estimates of ITN per person ratios from National Malaria Indicator Surveys (MIS) and IRS pro-gram enumeration efforts in 2008 and 2010 [9,13], and population-adjusted values were calculated per district (see Additional file 1: Figures S1 and S2). Bayesian gen-eralized linear models were then used to predict values of ITN per person ratios for districts and years without survey data from annual district ITN distribution data from the National Malaria Control Center (NMCC) (Additional file 1: Figure S3). The resultant district-level ITN per person ratio was multiplied by the average household size of each district in order to represent population coverage as a more programmatically useful value, the number of ITNs per household. In final re-gression models, we included this number of ITNs per household variable as an anomaly from the four-year mean for each district to control for systematic spatial effects and potentially endogenous relationships due to programmatic targeting decisions.
Program data on the annual numbers of structures sprayed with IRS per district were compiled to investi-gate independent effects of spraying and as a control variable. In preliminary models, we found IRS terms to be non-significant and positively associated with incidence, which likely reflects a high degree of endogeneity given that the IRS program initially targeted peri-urban areas and were scaled up in higher burden areas. As we were un-able to identify an effective instrumental variun-able for IRS, we only retained IRS as a control variable—calculated as
an anomaly from the four-year district mean of the num-ber of structures sprayed in the previous year—and did not attempt to interpret independent associations with incidence.
Measures of contextual and potential confounding factors
To control for climate variability over the study period, monthly climatic data were compiled from publicly available sources at the district level. Monthly mean rainfall data were obtained from the Famine Early Warn-ing System African Data Dissemination Service [14] from 2005 through 2011. Monthly mean maximum and minimum temperature and the enhanced vegetation index (EVI) were obtained from MODIS satellite data for the same period [15]. Based upon exploratory ana-lyses, EVI values were categorized as <0 · 2, 0 · 2–0 · 3, 0 · 3–0 · 4, and >0 · 4, where higher values represent greater vegetation health. Anomalies were calculated for rainfall and temperature data as the difference from each district-month value and the district mean. Rainfall and temperature anomaly values were then standardized by subtracting the respective overall mean and dividing by the standard deviation. For inclusion in regression models, various month lag terms were assessed accord-ing to previously documented lagged relationships be-tween climate variables and clinical incidence [16].
To estimate physical access to health care, the open source module AccessMOD 3.0 [17] was used to create smoothed raster estimates of travel time to health facil-ities by district. This estimate of facility access has been shown to correlate well with treatment-seeking for fevers from MIS data [18]. Based upon these estimates and dis-trict population rasters, we calculated the percent of each district population within two hours of a public health facility (Additional file 1: Figure S4). These values were standardized for inclusion in final regression models by subtracting the overall mean and dividing by the standard deviation.
Data from the 2006, 2008, and 2010 MIS, 2007 Demo-graphic and Health Survey [19], and 2009 and 2011 ACTWatch household surveys [20] were compiled to es-timate rates of treatment-seeking for fever per district. For each district the proportion of caregivers from all six surveys who sought treatment at a public health facility for a child <5 with fever was calculated (Additional file 1: Figure S5). We examined simple kriging methods but found no difference with these cross-survey district summaries. Similar to rainfall, temperature, and health care access, district mean treatment-seeking rates were standardized to one standard deviation.
To evaluate reporting rates over time we created an index of the number of facilities reporting per district per month as a proportion of the total number of facilities per district, weighted by facility size (determined by mean
monthly malaria outpatient diagnoses over the study period). We created a similar index for testing per district-month calculated as the total number of parasitological tests (slide or RDT) reported per health facility per month divided by the sum of the total number of tests and the total number of clinical (non-confirmed) malaria cases. In cases where a confirmed case count was reported but no parasitological testing value reported (roughly 33% of all testing values), we replaced the missing testing value with the number of confirmed cases.
Statistical analysis
For descriptive analyses, confirmed case data were stan-dardized per 1,000 population and summarized as the annual parasite index (API), which is commonly used out-side Africa [21] but only rarely used in Africa due to low case confirmation rates. Mid-year district-level population estimates were available from the 2010 housing and popu-lation census and projected for 2009 and 2011 based upon annual rates of change. We compared several Poisson and negative binomial regression models to test the association between ITN coverage per district and the primary out-comes of total and confirmed malaria outpatient cases. In all models, we used the fully imputed cases and included the log of the total district population as a measure of ex-posure in order to create population-standardized inci-dence rates. Exploratory and residual analysis revealed potential interactions by region between primary outcome and explanatory variables. In model construction we therefore assessed the inclusion of interactions between ITN coverage and transmission, as measured by meanP. falciparumparasite rate (PfPR2–10) (Malaria Atlas Project) categories (<10% vs. >10% and <25% vs. >25%), as well as between ITN coverage and high-burden/low-burden prov-ince, where high-burden provinces were those with the highest confirmed case incidence over the entire period (Luapula, Copperbelt, and Eastern provinces as defined in 2011) (Additional file 1: Figure S6). Models were fit in a Bayesian framework and computed using Integrated Nested Laplace Approximation (INLA) in R to account for unmeasured temporal and spatial correlation [22,23]. Model fit was compared using the deviance information criterion (DIC) [24], where models with the lowest DIC were chosen for final interpretation. Where uncertainty from the INLA model did not include zero, coefficients were considered significantly different than zero. As a fur-ther check on model specification, we compared the re-sults of models fit by INLA with models fit in a frequentist framework and obtained similar coefficient estimates.
Results
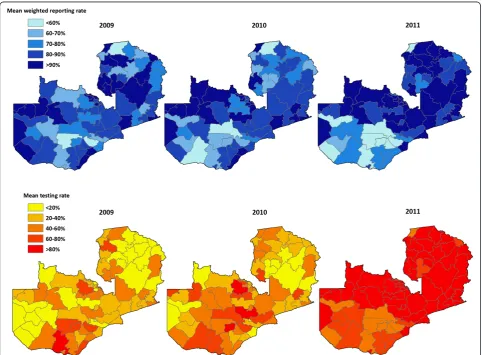
systems (GPS) 1,387 (82%); the remaining 306 (18%) were matched to district. Of the 60,948 maximum pos-sible facility-month observations, there were 48,166 (79.0%) non-missing values available for total malaria cases and 38,588 (63.3%) non-missing values for con-firmed cases alone; the remaining 21.0% of total cases and 36.7% of confirmed case values were imputed. The percent of expected reports of values per year was con-sistent over the study period among health centers (2009: 84 · 7%, 2010: 85 · 1%, 2011: 84 · 2%) and hospitals (2009: 65 · 1%, 2010: 62 · 9%, 2011: 63 · 3%) but increased among health posts (2009: 54 · 4%, 2010: 67 · 1%, 2011: 77 · 4%). The mean weighted district-level reporting rate increased slightly from 81 · 1% in 2009 to 84 · 6% in 2011 but fell somewhat in some districts at the end of 2010 and 2011 (Figure 2). Consistent with the rapid scaling-up of testing and reporting with RDTs in clinics across Zambia over this period, the mean testing rate (defined as the number of tests reported divided by the sum of tests reported and clinical cases) increased dramatically
over this period, from 33 · 0% in 2009 to 43 · 2% in 2010 and 67 · 6% in 2011. This increase in uptake and report-ing of testreport-ing was largely consistent across districts.
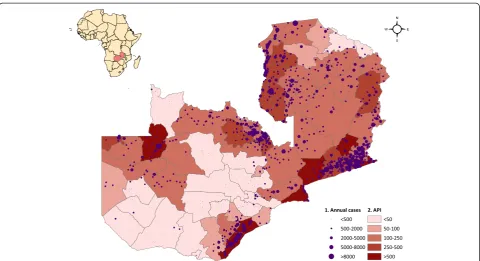
Total outpatient malaria cases (clinical and confirmed) reported through the HMIS were concentrated in districts on the south-eastern border with Zimbabwe, Mozambique, and Malawi, as well as in Luapula, Northern, Copperbelt, and portions of Northwestern Provinces (Figure 3). Coin-ciding with the progressive roll out of the new HMIS reporting system, total reported outpatient malaria cases increased from 3 · 0 million in 2009 (242 · 2 per 1,000 population) to 4.1 million in 2010 (322 · 8 per 1,000 popu-lation) and 4 · 3 million in 2011 (327 · 5 per 1,000 popula-tion). After imputing missing monthly facility case values, there were an estimated 3 · 4 million outpatient malaria cases in 2009 (277 · 4 per 1,000 population), 4 · 6 million in 2010 (360 · 0 per 1,000 population), and 4 · 7 million in 2011 (361 · 9 per 1,000 population). Coinciding with the scale-up of diagnostic testing for malaria confirmation, confirmed outpatient malaria cases reported through the
HMIS also increased, from 871,193 cases in 2009 (API = 70 · 8 per 1,000 population) to 1 · 2 million in 2010 (API = 97 · 4) and 2 · 1 million in 2011 (API = 163 · 0). After imputing missing monthly facility case values, there were 1.2 million confirmed malaria cases in 2009 (API = 99 · 8), 1 · 7 million in 2010 (API = 135 · 9), and 2 · 5 million in 2011 (API = 194 · 8). Although reported confirmed case incidence increased in most provinces from 2010 to 2011, total case incidence decreased in Southern Province and slightly in Eastern Province where incidence is highest (Figure 4).
District-level ITN coverage, as measured by the number of ITNs per household, increased from 1 · 25 in 2009 to 1 · 34 in 2010 but fell slightly in 2011 to 1 · 28. District-level ITN coverage and confirmed malaria case incidence showed great variability, with some districts experiencing drops in ITN coverage associated with an increase in con-firmed case incidence and others experiencing substantial increases in ITN coverage and stable or decreasing inci-dence (Additional file 1: Figure S7).
After controlling for district reporting and testing rates, the percent of the population within two hours of a health facility, mean treatment-seeking, IRS, rainfall, minimum and maximum temperature, vegetation, cal-endar month and year, and spatial and temporal auto-correlation, overall the number of ITNs per household was significantly associated with lower confirmed case incidence iIncidence rate ratio (IRR) = 0 · 73, 95%
Bayesian Credible Interval (BCI): 0 · 65–0 · 81) (Table 1 and Additional file 1: Table S1). In low-burden regions, the number of ITNs per household was strongly asso-ciated with lower confirmed case incidence (IRR = 0 · 59, 95% BCI: 0 · 51–0 · 68); there was no evidence of this association in high-burden provinces (IRR = 0 · 94, 95% BCI: 0 · 79–1 · 10). Similarly, the number of ITNs per household was associated with lower total malaria case in-cidence in the overall model (IRR = 0 · 69, 95% BCI: 0 · 62–0 · 76), as well as in low-burden provinces (IRR = 0 · 53, 95% BCI: 0 · 46–0 · 62), but not in high-burden provinces (IRR = 0 · 93, 95% BCI: 0 · 81–1 · 10).
The standardized testing rate was positively associated with confirmed malaria case incidence (IRR = 1 · 22, 95% BCI: 1 · 19–1 · 25) but was negatively associated with total malaria case incidence (IRR = 0 · 87, 95% BCI: 0 · 85– 0 · 89). The standardized reporting rate was positively asso-ciated with total malaria case incidence (IRR = 1 · 07, 95% BCI: 1 · 05–1 · 09) but not with confirmed case incidence (IRR = 0 · 98, 95% BCI: 0 · 97–1 · 00). One-month lagged EVI was positively associated with confirmed case inci-dence (IRR = 1 · 36 comparing the highest and lowest EVI categories, 95% BCI: 1 · 22–1 · 51). The standardized per-cent of the population within two hours of a health facility was inversely associated with confirmed case incidence (IRR = 0 · 77, 95% BCI: 0 · 61–0 · 97), which likely reflects the proportion of the population in urban areas in each district.
Discussion
In this study, we used a national platform evaluation design to assess the dose–response relationship between district-level ITN program intensity and HMIS-derived confirmed malaria case incidence in Zambia between 2009 and 2011. After accounting for variability in diag-nostic procedures, completeness of reporting, and access and demand for health services, we show that increased district-level ITN coverage as measured by the number of ITNs per household is associated with lower con-firmed case incidence. Specifically, we found that an additional ITN per household was associated with a 27%
reduction in district-level monthly confirmed case inci-dence overall and a 41% reduction in provinces with lower annual burden. This finding is largely consistent with field trials and corresponds to an average of over 300,000 fewer confirmed outpatient malaria cases per year with each additional ITN per household [25].
This study illustrates a robust framework for mitigating many of the known biases of routine data on malaria inci-dence by controlling for important confounding factors, which is a prerequisite to achieving the high internal valid-ity required for rigorous program evaluations. Prior ana-lyses of similar routine data have often failed to control for
important confounders, and many have reported on pre-sumed or clinically-diagnosed malaria cases. For example, Otten and colleagues (2009) found large reductions in the number of cases in Rwanda and Ethiopia and attributed these changes to the scale-up of malaria prevention inter-ventions [26]. Similarly, Chanda and colleagues (2012) ana-lyzed annual HMIS data summaries from a sample of districts in Zambia for 2007 and 2008 and concluded that ITNs and IRS were associated with declines in suspected malaria case incidence and deaths [5]. However, neither of these studies adequately controlled for several important confounding factors known to influence health facility inci-dence, including variations over time in climate, diagnostic practices, access to health services, treatment-seeking be-havior, and reporting completeness [2]. Bhattarai and col-leagues (2007) found decreases in health facility cases following LLIN and ACT scale-up in Zanzibar, but while climate was considered descriptively, it was not explicitly
modeled, and the authors did not consider differences in treatment-seeking or health care access [27]. The district level (“sub-zobas” in Eritrea) analysis conducted by Graves and colleagues (2008) revealed an association between the number of ITNs distributed, IRS spraying, and clinical case incidence, but while their analysis controlled for climate fac-tors, they did not include information on parasitological case confirmation, reporting, or health facility access and treatment-seeking behavior [8]. Finally, none of these studies accounted for the inherent correlated nature of malaria case data across spatial units, which can result in erroneous find-ings of statistical significance if not accounted for, and only the Graves study accounted for temporal autocorrelation.
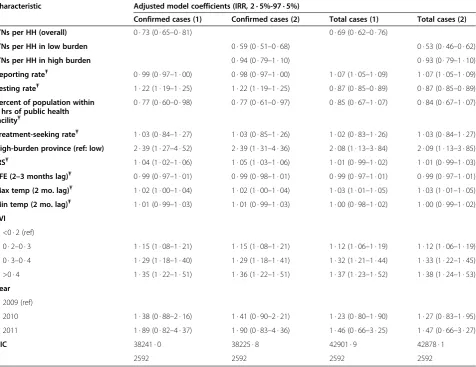
This study incorporated several recent methodological advances in spatial and spatio-temporal modeling that allow for the inclusion of complex correlation structures, as well as spatially continuous intervention and environmental information [28,29]. Similar modeling strategies have Table 1 Results of space-time negative binomial models fit using INLA, for overall models (1) and models including interaction by region (2), Zambia*
Characteristic Adjusted model coefficients (IRR, 2 · 5%-97 · 5%)
Confirmed cases (1) Confirmed cases (2) Total cases (1) Total cases (2)
ITNs per HH (overall) 0 · 73 (0 · 65–0 · 81) 0 · 69 (0 · 62–0 · 76)
ITNs per HH in low burden 0 · 59 (0 · 51–0 · 68) 0 · 53 (0 · 46–0 · 62)
ITNs per HH in high burden 0 · 94 (0 · 79–1 · 10) 0 · 93 (0 · 79–1 · 10)
Reporting rateŦ 0 · 99 (0 · 97–1 · 00) 0 · 98 (0 · 97–1 · 00) 1 · 07 (1 · 05–1 · 09) 1 · 07 (1 · 05–1 · 09) Testing rateŦ 1 · 22 (1 · 19–1 · 25) 1 · 22 (1 · 19–1 · 25) 0 · 87 (0 · 85–0 · 89) 0 · 87 (0 · 85–0 · 89) Percent of population within
2 hrs of public health facilityŦ
0 · 77 (0 · 60–0 · 98) 0 · 77 (0 · 61–0 · 97) 0 · 85 (0 · 67–1 · 07) 0 · 84 (0 · 67–1 · 07)
Treatment-seeking rateŦ 1 · 03 (0 · 84–1 · 27) 1 · 03 (0 · 85–1 · 26) 1 · 02 (0 · 83–1 · 26) 1 · 03 (0 · 84–1 · 27) High-burden province (ref: low) 2 · 39 (1 · 27–4 · 52) 2 · 39 (1 · 31–4 · 36) 2 · 08 (1 · 13–3 · 84) 2 · 09 (1 · 13–3 · 85) IRSŦ 1 · 04 (1 · 02–1 · 06) 1 · 05 (1 · 03–1 · 06) 1 · 01 (0 · 99–1 · 02) 1 · 01 (0 · 99–1 · 03) RFE (2–3 months lag)Ŧ 0 · 99 (0 · 97–1 · 01) 0 · 99 (0 · 98–1 · 01) 0 · 99 (0 · 97–1 · 01) 0 · 99 (0 · 97–1 · 01) Max temp (2 mo. lag)Ŧ 1 · 02 (1 · 00–1 · 04) 1 · 02 (1 · 00–1 · 04) 1 · 03 (1 · 01–1 · 05) 1 · 03 (1 · 01–1 · 05) Min temp (2 mo. lag)Ŧ 1 · 01 (0 · 99–1 · 03) 1 · 01 (0 · 99–1 · 03) 1 · 00 (0 · 98–1 · 02) 1 · 00 (0 · 99–1 · 02) EVI
<0 · 2 (ref)
0 · 2–0 · 3 1 · 15 (1 · 08–1 · 21) 1 · 15 (1 · 08–1 · 21) 1 · 12 (1 · 06–1 · 19) 1 · 12 (1 · 06–1 · 19) 0 · 3–0 · 4 1 · 29 (1 · 18–1 · 40) 1 · 29 (1 · 18–1 · 41) 1 · 32 (1 · 21–1 · 44) 1 · 33 (1 · 22–1 · 45) >0 · 4 1 · 35 (1 · 22–1 · 51) 1 · 36 (1 · 22–1 · 51) 1 · 37 (1 · 23–1 · 52) 1 · 38 (1 · 24–1 · 53) Year
2009 (ref)
2010 1 · 38 (0 · 88–2 · 16) 1 · 41 (0 · 90–2 · 21) 1 · 23 (0 · 80–1 · 90) 1 · 27 (0 · 83–1 · 95) 2011 1 · 89 (0 · 82–4 · 37) 1 · 90 (0 · 83–4 · 36) 1 · 46 (0 · 66–3 · 25) 1 · 47 (0 · 66–3 · 27)
DIC 38241 · 0 38225 · 8 42901 · 9 42878 · 1
N 2592 2592 2592 2592
*models include calendar month dummy covariatesŦcovariates are standardized so that a one-unit change represents one standard deviation INLA = Integrated Nested Laplace Approximation; IRR = incidence rate ratio; ITNs = insecticide-treated nets; HH = household; IRS = indoor residual spraying; RFE = rainfall estimate;
increasingly been used to evaluate temporal and spatial trends in disease, seasonality, climate, and other factors but not for evaluations of program impact [30]. While the evaluation framework and accompanying statistical ana-lyses used in this study are complex, we argue that without such methods in place to account for potential biases in routine HMIS data, such data cannot be used for rigorous program evaluations to achieve meaningful and robust re-sults for program decision-making. This is significant as HMIS data become increasing available, parasite preva-lence falls in areas with high control coverage, RDTs are scaled up to allow for increased case confirmation, and as programs require better real-time data to monitor trends in confirmed cases and deaths.
Our finding of a significant interaction between the num-ber of ITNs per household and low versus high incidence regions in models predicting both confirmed and all malaria outpatient cases was unexpected; while potentially related to transmission, we did not find significant interactions be-tween district ITN coverage and endemicity categories as defined by meanPfPR2–10. Mathematical models and some limited empirical evidence have suggested that the effect of increasing ITN coverage on prevalence may be greater or more rapid in areas of lower baseline transmission [25,31-33], but there is less evidence to suggest a similar lationship with clinical case incidence. It is possible that re-gional factors such as population movement between neighboring countries or insecticide resistance are involved, as these provinces border high burden areas in Malawi, Mozambique, and the Democratic Republic of the Congo where resistance is a known problem reducing operational effectiveness [34], and reductions in the malaria burden over a decade of scale-up have been extremely limited [35]. It is also possible that our testing and reporting rates do not fully correct for biases in diagnostic reporting practices in these high-burden areas.
The increase in both confirmed and total malaria out-patient cases over the period of study is notable yet largely explained by the rapid increase in RDT testing over this period and a simultaneous increase in reporting of con-firmed cases as a new HMIS reporting system was adopted. Inter-annual climate patterns may explain some of the in-crease between 2009 and 2010, as 2010 was noted as a high transmission year in several countries in the region [36], but we found limited evidence for this effect in our models. User fee changes adopted in 2006 may have influenced health facility utilization rates broadly, but the bulk of these effects would likely have well predated our study.
There were several important limitations to our ap-proach that should be considered. First, our evaluation was limited by the short time frame of confirmed case data available for analysis, as well as potentially biased by the in-crease in reporting and testing over this period as facilities adapted to the new reporting system. While we attempted
to control for the increase in confirmed case testing in multivariable models, our testing rate may be an imperfect indicator of the true testing rate, as reporting of testing likely improved contemporaneously with RDT scale-up, la-boratory testing values were not consistently reported, and detailed RDT stock-out data were not available. However, any remaining bias would most likely bring the estimated effect of ITNs on confirmed case incidence toward the null hypothesis of no effect.
Second, potentially endogenous relationships existed be-tween our primary outcomes and explanatory variables of interest due to programmatic choices targeting high-burden or easily accessible areas. In some instances, such as the use of calendar month in the evaluation of IRS ef-fectiveness by Over and colleagues [37], instrumental vari-ables may be available to infer causal relationships when endogeneity exists. However, as no instrumental variables uncorrelated with primary outcomes were available in our data, we were not able to perform two-stage regression or similar standard econometric approaches to isolate uncor-related effects. Rather, we controlled for systematic spatial targeting of intervention effort through the use of anomal-ies in program coverage. This approach was effective for ITN coverage, as the goal is for universal coverage, and therefore targeting has been limited. However, the highly targeted nature and relatively lower coverage of the IRS program during this period, combined with the lack of confirmed case data preceding IRS scale-up, precluded our ability to make similar effective adjustments for IRS. Future use of these data will likely prove more robust for evaluat-ing IRS efforts as more areas are included and there is greater heterogeneity within districts over time. Addition-ally, we incorporated only annual ITN per household data, which may not accurately depict monthly changes in coverage. There is need for programs to more closely track monthly ITN coverage data in order to make more tem-porally refined assessments of intervention effectiveness.
Finally, we were not able to incorporate ACT data in this analysis as these data were not available sub-nationally. Drug stock-outs could have influenced incidence rates, but there was no evidence to suggest systemic changes in ACT availability over this period.
Conclusions
true control group is available [38]. Using this approach we provide further evidence that increased coverage with ITNs is associated with decreased malaria morbidity and reduced utilization of health services for malaria illness in Zambia.
Additional file
Additional file 1:Space-time imputation of missing facility-month cases. Figure S1. Bayesian geostatistical estimates of ITN coverage for
(A)2008 and(B)2010, Zambia.Figure S2. Relative standard deviation (sd to mean ratio) for ITN coverage estimates for(A)2008 and(B)2010, Zambia.Figure S3. Population-adjusted ITN coverage estimates by district for(A)2008,(B)2009,(C)2010, and(D)2011, Zambia.Figure S4.(A)Travel time to the nearest public health facility and(B)percent of population by district within 2 hours of a public health facility, Zambia.Figure S5. Percent of children <5 with fever in the previous two weeks whose caregiver sought treatment within the public sector, by district, Zambia.Figure S6. Map of provinces of Zambia as of 2011, including those defined as high burden.
Figure S7. District confirmed case incidence (red) and district ITN per HH anomalies (blue), where zero indicates that coverage remained the same as the four-year mean. Months 1-36 refer to the study period January 2009 to December 2011, Zambia.Table S1. Results of model selection for models on confirmed cases, 2009-2011 Zambia.Table S2. Results of model selection for models on total cases (confirmed + unconfirmed), 2009-2011 Zambia.
Competing interests
The authors declare that they have no competing interests.
Authors’contributions
AB and TPE designed the study. AB led the analysis of all data, prepared all drafts of the paper, and incorporated comments by coauthors. All named authors contributed to the conceptualization and editing of the paper and approved the final version.
Acknowledgments
Dr. Adam Bennett, Dr. Joshua Yukich, Dr. John Miller, Dr. Joseph Keating, Dr. Richard Steketee, and Dr. Thomas P. Eisele were funded by the Malaria Control and Evaluation Partnership in Africa (MACEPA), a PATH project, from funding from the Bill & Melinda Gates Foundation. Dr. Thomas A. Smith and Dr. Penelope Vounatsou were funded through a Bill & Melinda Gates Foundation project, number OPP1032350.
The sponsor of the study had no role in study design, data collection, data analysis, data interpretation, or writing of the report. The corresponding author had full access to all the data in the study and had final responsibility for the decision to submit for publication.
The authors wish to acknowledge Dr. Pete Gething, who provided a thoughtful review of an earlier draft of this paper.
Author details 1
Malaria Elimination Initiative, Global Health Group, University of California, San Francisco, 550 16th St, San Francisco, CA 94143, USA.2Center for Applied Malaria Research and Evaluation, Tulane University of Public Health and Tropical Medicine, 1440 Canal St., Suite 2200, New Orleans, LA 70112, USA. 3
PATH Malaria Control and Evaluation Partnership in Africa (MACEPA), Lusaka, Zambia.4Swiss Tropical and Public Health Institute, Socinstr. 57, 4051, Basel, Switzerland.5University of Basel, Basel, Switzerland.6National Malaria Control Centre, Ministry of Health, Lusaka, Zambia.
Received: 13 October 2013 Accepted: 13 October 2014
References
1. malEra Consultative Group on Monitoring, Evaluation and Surveillance: A research agenda for malaria eradication: monitoring, evaluation, and surveillance.PLoS Med2011,8(1):e1000400.
2. Rowe AK, Kachur SP, Yoon SY, Lynch M, Slutsker L, Steketee RW:Caution is required when using health facility-based data to evaluate the health impact of malaria control efforts in Africa.Malar J2009,8:209.
3. Gething PW, Noor AM, Goodman CA, Gikandi PW, Hay SI, Sharif SK, Atkinson PM, Snow RW:Information for decision making from imperfect national data: tracking major changes in health care use in Kenya using geostatistics.BMC Med2007,5:37.
4. Thomson MC, Doblas-Reyes FJ, Mason SJ, Hagedorn R, Connor SJ, Phinedela T, Morse AP, Palmer TN:Malaria early warnings based on seasonal climate forecasts from multi-model ensembles.Nature2006,439(7076):576–579. 5. Chanda E, Coleman M, Kleinschmidt I, Hemingway J, Hamainza B, Masaninga F,
Chanda-Kapata P, Baboo KS, Dürrheim DN, Coleman M:Impact assessment of malaria vector control using routine surveillance data in Zambia:
implications for monitoring and evaluation.Malar J2012,11:437. 6. Victora CG, Schellenberg JA, Huicho L, Amaral J, El Arifeen S, Pariyo G,
Manzi F, Scherpbier RW, Bryce J, Habicth JP:Context matters: interpreting impact findings in child survival evaluations.Health Policy Plan2005,20(Suppl 1):i18–i31.
7. Victora CG, Black RE, Boerma JT, Bryce J:Measuring impact in the Millennium Development Goal era and beyond: a new approach to large-scale effectiveness evaluations.Lancet2011,377(9759):85–95. 8. Graves PM, Osgood DE, Thomson MC, Sereke K, Araia A, Zerom M, Ceccato
P, Bell M, Del Corral J, Ghebreselassie S, Brantly EP, Ghebremeskel T: Effectiveness of malaria control during changing climate conditions in Eritrea, 1998–2003.Trop Med Int Health2008,13(2):218–228.
9. Zambia Ministry of Health, National Malaria Control Center:Zambia National Malaria Indicator Survey 2010.Lusaka, Zambia: 2011. Available at: www.nmcc. org.zm.
10. Chizema-Kawesha E, Miller J, Steketee RW, Mukonka C, Mohamed AD, Miti SK, Campbell CC:Scaling up malaria control in Zambia: progress and impact 2005–2008.Am J Trop Med Hyg2010,83(3):480–488.
11. Yukich JO, Bennett A, Albertini A, Incardona S, Moonga H, Chisha Z, Hamainza B, Miller JM, Keating J, Eisele TP, Bell D:Reductions in artemisinin-based combin-ation therapy consumption after the ncombin-ationwide scale up of routine malaria rapid diagnostic testing in Zambia.Am J Trop Med Hyg2012,87(3):437–446. 12. STROBE: 2007. [cited 2013 August]; Accessed online at:
http://www.strobe-statement.org/fileadmin/Strobe/uploads/checklists/ STROBE_checklist_v4_cross-sectional.pdf.
13. Eisele TP, Miller JM, Moonga HB, Hamainza B, Hutchinson P, Keating J: Malaria infection and anemia prevalence in Zambia's Luangwa District: an area of near-universal insecticide-treated mosquito net coverage.
Am J Trop Med Hyg2011,84(1):152–157.
14. United States Geological Survey:Famine Early Warning System Network.[accessed 2011 January]; Accessed online at: http://earlywarning.usgs.gov/fews/. 15. United States Geological Survey/National Aeronautics and Space
Administration:The Moderate Resolution Imaging Spectroradiometer (MODIS).
[cited 2011 January]; Accessed online at: https://lpdaac.usgs.gov/products/ modis_products_table.
16. Mabaso ML, Craig M, Vounatsou P, Smith T:Towards empirical description of malaria seasonality in southern Africa: the example of Zimbabwe.
Trop Med Int Health2005,10(9):909–918.
17. World Health Organization:AccessMod 3.0.[accessed 2012 June]; Accessed online at: http://www.who.int/kms/initiatives/accessmod/en/index.html. 18. Alegana VA, Wright JA, Pentrina U, Noor AM, Snow RW, Atikinson PM:
Spatial modelling of healthcare utilisation for treatment of fever in Namibia.Int J Health Geogr2012,11:6.
19. Macro International and Central Statistics Office, Zambia:Zambia Demographic and Health Survey 2007.Calverton,MD: Macro International; 2009. Available at: www.dhsprogram.com.
20. Actwatch Group & SFH/Zambia:Zambia 2011 Household Survey Report.
Washington DC: Population Services International; 2013. Available at: www. actwatch.info.
21. Camargo LM, Noronha E, Salcedo JM, Dutra AP, Krieger H, da Silva LH P, Camargo EP:The epidemiology of malaria in Rondonia (Western Amazon region, Brazil): study of a riverine population.Acta Trop1999,72(1):1–11. 22. Rue H, Martino S, Chopin N:Approximate Bayesian inference for latent
Gaussian models using integrated nested Laplace approximations.
J R Stat Soc, Series B2009,71(2):319–392.
24. Spiegelhalter DJ, Best NG, Carlin BP, Van Der Linde A:Bayesian measures of model complexity and fit.J R Stat Soc, Series B2002,64(4):583–639. 25. Lengeler C:Insecticide-treated bed nets and curtains for preventing
malaria.Cochrane Database Syst Rev2004,2:CD000363.
26. Otten M, Aregawi M, Were W, Karema C, Medin A, Bekele W, Jima D, Gausi K, Komatsu R, Korenromp E, Low-Beer D, Grabowsky M:Initial evidence of reduction of malaria cases and deaths in Rwanda and Ethiopia due to rapid scale-up of malaria prevention and treatment.Malar J2009,8:14. 27. Bhattarai A, Ali S, Kachur SP, Mårtensson A, Abbas AK, Khatib R, Al-Mafazy
AW, Ramsan M, Rotllant G, Gerstenmaier JF, Molteni F, Abdulla S, Montgomery SM, Kaneko A, Björkman A:Impact of artemisinin-based combination therapy and insecticide-treated nets on malaria burden in Zanzibar.PLoS Med2007,4(11):e309.
28. Mabaso ML, Vounatsou P, Midzi S, Da Silva J, Smith T:Spatio-temporal analysis of the role of climate in inter-annual variation of malaria incidence in Zimbabwe.Int J Health Geogr2006,5:20.
29. Noor AM, Alegana VA, Patil AP, Snow RW:Predicting the unmet need for biologically targeted coverage of insecticide-treated nets in Kenya.
Am J Trop Med Hyg2010,83(4):854–860.
30. Hu W, Clements A, Williams G, Tong S, Mengersen K:Bayesian spatiotemporal analysis of socio-ecologic drivers of Ross River virus transmission in Queensland, Australia.Am J Trop Med Hyg2010,83(3):722–728. 31. Griffin JT, Hollingsworth TD, Okell LC, Churcher TS, White M, Hinsley W,
Bousema T, Drakeley CJ, Ferguson NM, Basáñez MG, Ghani AC:Reducing
Plasmodium falciparummalaria transmission in Africa: a model-based evaluation of intervention strategies.PLoS Med2010,7(8):e1000324. 32. Smith DL, Hay SI, Noor AM, Snow RW:Predicting changing malaria risk
after expanded insecticide-treated net coverage in Africa.Trends Parasitol
2009,25(11):511–516.
33. Chitnis N, Schapira A, Smith T, Steketee R:Comparing the effectiveness of malaria vector-control interventions through a mathematical model.
Am J Trop Med Hyg2010,83(2):230–240.
34. Wondji CS, Coleman M, Kleinschmidt I, Mzilahowa T, Irving H, Ndula M, Rehman A, Morgan J, Barnes KG, Hemingway J:Impact of pyrethroid resistance on operational malaria control in Malawi.Proc Natl Acad Sci
2012,109(47):19063–19070.
35. Roca-Feltrer A, Kwizombe CJ, Sanjoaquin MA, Sesay SS, Faragher B, Harrison J, Geukers K, Kabuluzi S, Mathanga DP, Molyneux E, Chagomera M, Taylor T, Molyneux M, Heyderman RS:Lack of decline in childhood malaria, Malawi, 2001–2010.Emerg Infect Dis2012,18(2):272–278.
36. World Health Organization (WHO):World Malaria Report 2010.Geneva, Switzerland: 2010. Available at: www.who.int/malaria.
37. Over M, Bakote'e B, Velayudhan R, Wilikai P, Graves PM:Impregnated nets or DDT residual spraying? Field effectiveness of malaria prevention techniques in Solomon Islands, 1993–1999.Am J Trop Med Hyg2004, 71(2 Suppl):214–223.
38. Rowe AK, Steketee RW, Arnold F, Wardlaw T, Basu S, Bakyaita N, Lama M, Winston CA, Lynch M, Cibulskis RE, Shibuya K, Ratcliffe AA, Nahlen BL, Roll Back Malaria Monitoring and Evaluation Reference Group:Viewpoint: evaluating the impact of malaria control efforts on mortality in sub-Saharan Africa.Trop Med Int Health2007,12(12):1524–1539.
doi:10.1186/s12963-014-0030-0
Cite this article as:Bennettet al.:A methodological framework for the improved use of routine health system data to evaluate national malaria control programs: evidence from Zambia.Population Health Metrics201412:30.
Submit your next manuscript to BioMed Central and take full advantage of:
• Convenient online submission
• Thorough peer review
• No space constraints or color figure charges
• Immediate publication on acceptance
• Inclusion in PubMed, CAS, Scopus and Google Scholar
• Research which is freely available for redistribution