R E S E A R C H
Open Access
Factors associated with malnutrition
in hospitalized cancer patients: a
croos-sectional study
Fernanda Rafaella de Melo Silva
1*, Mirella Gondim Ozias Aquino de Oliveira
1, Alex Sandro Rolland Souza
1,2,
José Natal Figueroa
1and Carmina Silva Santos
1Abstract
Introduction:The incidence of cancer is increasing worldwide and with it the prevalence of malnutrition, which is responsible for the death of almost 20 % of cancer patients. The objective of this study was to identify the factors associated with malnutrition in hospitalized cancer patients.
Methods:Cross-sectional study conducted with 277 hospitalized patients in the Institute of Integrative Medicine Prof. Fernando Figueira from March to November 2013. The nutritional status was classified as well-nourished and moderate/severe malnutrition, according to the Patient-Generated Subjective Global Assessment. The association between moderate/severe malnutrition and demographic, behavioral, socioeconomic, clinical, therapeutic and nutritional variables was investigated through univariate regression and hierarchical Poisson models, with a 5 % significance level.
Results:The prevalence of malnutrition was 71.1 %, being classified as moderate in 35.4 % and severe in 35.7 %. After multivariate analysis, smokers/ex-smokers low socioeconomic status, performance status≥2 and age≥60 years were associated with increased risk of malnutrition.
Conclusion:There was observed a high prevalence of moderate/severe malnutrition in cancer patients, with the increased risk of malnutrition associated with the presence of factors that can be assessed during hospital admission suggesting a higher alert of the medical and health care staff about the need for nutritional assessment and intervention.
Keywords:Nutrition assessment, Risk factors, Malnutrition, Cancer
Introduction
The incidence of cancer is increasing worldwide and with it the prevalence of malnutrition, which may vary between 40 and 80 % in patients with neoplasia [1, 2]. The cancer is responsible for approximately 13 % of all causes of death worldwide, however the death of almost 20 % of cancer patients occurs as a result of malnutrition and its complications, rather than the malignancy of the disease itself [3, 4].
In Brazil, a multicenter study found a prevalence of malnutrition of 66.3 % and an increased risk of almost
three-fold of malnutrition (20.3 %) among cancer pa-tients [5]. A similar result was found in a study con-ducted in Latin America with hospitalized patients, which showed a prevalence of 65.6 % of malnutrition in individuals with cancer [6].
The etiology of malnutrition in cancer patients is com-plex and multifactorial and may be influenced by the lo-cation and type of tumor, stage of the disease, side effects of the treatment, socioeconomic status, func-tional performance, symptoms of nutrifunc-tional impact, need for fasting and inadequate nutritional therapy, as well as medical staff awareness about the importance of nutritional status for the prognosis and quality of life of hospitalized patients [5–8].
* Correspondence:fernandamelo03@yahoo.com.br
1Institute of Integrative Medicine Prof. Fernando Figueira (IMIP), Recife, PE,
Brazil
Full list of author information is available at the end of the article
In patients with cancer, a risk up to 30 % of malnutri-tion among hospitalized patients in older age (OR 1.38; IC 95 %: 1.28 – 1.54) [6] and almost three-fold in pa-tients with low functional performance [3] were ob-served. Another study found that smoking is associated with the need for enteral nutrition therapy in patients with head and neck cancer, suggesting that is also associ-ated with depletion of the nutritional status, because this therapy is used when there is a partial or total im-pairment of food intake. However, these factors are not well elucidated [9].
The identification of factors that can be assessed dur-ing the hospital admission can alert the medical and healthcare staff about the need for evaluation and early nutritional intervention to avoid further complications. Researches show that malnutrition is associated with lower response and tolerance to antineoplastic treat-ment; reduction in the quality of life; higher morbidity, mortality and infectious complications and an increase in length of hospital stay and costs by reducing the avail-ability of hospital beds and consequently the number of patients attended [3, 10].
The objective of this study was to determine the prevalence and factors associated with malnutrition in hospitalized cancer patients so they can be identified at hospital admission and possible complications from mal-nutrition avoided.
Methods
Cross-sectional study, performed between March and November 2013, in oncology and palliative care in-patient units of the Institute of Integrative Medicine Prof. Fernando Figueira (IMIP), referral center for oncol-ogy in northeastern Brazil, located in Recife, Pernam-buco. The study started after its approval by the Ethics Committee on Human Research of the cited institution under protocol 10241612.7.0000.5201.
Patients with cancer of both sexes and aged 18 and older participated in the study. Those patients hospital-ized for more than 72 h, who where fed exclusively through catheter or ostomies for more than 72 h, with consumptive disorders or pregnant were excluded from the sample.
The sample size was calculated using the Statcalc func-tion of the Epi-Info 3.5.3 program (Centers for Disease Control and Prevetion, Atlanta, GA, EUA). Considering a frequency of malnutrition in cancer patients of 30 % [3], a significance level of 5 %, an 80 % power and a relative accuracy of 20 %, would be necessary 224 individuals. Foreseeing possible losses, the sample was increased by 20 % to 277 volunteers.
The selection and evaluation of the participants were performed by a single trained nutritionist. After the sign of an Informed Consent Form, by the patient or legal
guardian, were collected demographic, behavioral and socioeconomic variables [age (years), gender, origin, marital status, occupation, smoking, education, and so-cioeconomic class]; nutritional variables [symptoms of nutritional impact, current weight (kg), habitual weight (kg), height (m), weight loss percentage and previous body mass index (kg/m2)]; clinical variables (type of can-cer, presence of metastasis and performance status) and therapeutic variables (previous treatment and type of an-ticancer treatment).
Demographic, behavioral and socioeconomic variables were collected according to the report of the patient and medical record and socioeconomic class and education were obtained from the Brazilian Association of Re-search Companies questionnaire (ABEP) [11]. According to the ABEP questionnaire, family income is classified in five levels, being A the highest and E the lowest socio-economic level. For analysis purposes, the extremes of socioeconomic levels were grouped to form three cat-egories: A and B; C; D and E [11].
To obtain the anthropometric variables (current weight and height) the patient was measured twice and if there was difference between these values a third measure was made and then calculated the average and recorded the final value [12]. To measure these variables it was used a fixed vertical digital platform scale with stadiometer (FILIZOLA™, São Paulo, Brazil) with a variation of 50 g, capacity up to 200 kg and 0.5 cm precision. If there was no possibility of measuring the stature, it was estimated from the Chumlea equation [13]. Habitual weight (HW) of the last six months was obtained accord-ing to the report of the patient.
The weight loss percentage (%WL) was calculated from the equation [(habitual weight - current weight)/ habitual weight × 100], considering the cutoff point of % WL ≥5 on the past six months [14–16]. The previous body mass index (pBMI) was obtained by the equation (habitual weight/height2) and was classified according to the recommendations of the World Health Organization (WHO) for adults and the Pan American Health Organization (PAHO)/WHO for elderly [12, 17]. This variable was stratified into two categories correspond-ing to overweight (overweight and obese) and normal weight (normal weight and malnutrition).
of nutritional intervention [14, 15]. For statistical ana-lysis, the participants who were in categories B and C were classified as malnourished nutritional status. The presence of symptoms of nutritional impact was also ob-tained from this questionnaire.
Clinical variables were collected in medical records, but the performance status (PS) was obtained from the scale developed by the Eastern Cooperative Oncology
Group (ECOG) [18], that ranks the functional capacity
in five levels, being the zero, the fully active individual and the four, the bedridden and unable to perform self-care activities individual. Considering that the limited functional capacity leads to difficulties in preparing and food intake, this variable was stratified in PS <2 and PS≥2, because PS = 2 indicates inability to perform any work activity [19, 20].
For analysis, the cancers were stratified into six groups according to the location of the tumor (upper gastro-intestinal tract, lower gastrogastro-intestinal tract, reproductive tract, lung, breast and other cancers). The cancers be-longing to the latter class were those who do not fit into any of the former classifications.
Regarding therapeutic variables, the types of treatment were stratified into clinical treatment, when the individ-ual has been subjected to at least one radiotherapy and/ or chemotherapy session; surgical treatment, when any procedure for complete or partial resection of the tumor mass was conducted; medical/surgical treatment, when both treatments were needed; and palliative treatment when the therapy performed had no more intention of healing.
In order to avoid bias, the evaluations were performed by a single trained examiner and the questions asked in the same way for all studied individuals. The PG-SGA was preferably the first evaluation to be conducted. Before the anthropometric measurements the calibration of the instruments was always checked.
Categorical variables were presented by absolute and relative frequencies and the continuous variables were summarized using the central tendency and dispersion measures. The association between malnutrition and analytical variables was performed by the Poisson regres-sion model, assuming a significance level of p<0.05. To adjust the effect of independent predictors for malnutri-tion, all variables were included in a new hierarchical Poisson regression model, adopting a significance level of 5 %, a 95 % confidence interval and a power of 80 %. Data analyses were conducted through STATA 12.1SE program (Stata Corporation,College Station, TX, USA).
Results
During the study period 480 cancer patients were admit-ted, being 203 ineligible by exclusion criteria. Thus, 277 patients were eligible and all agreed to participate.
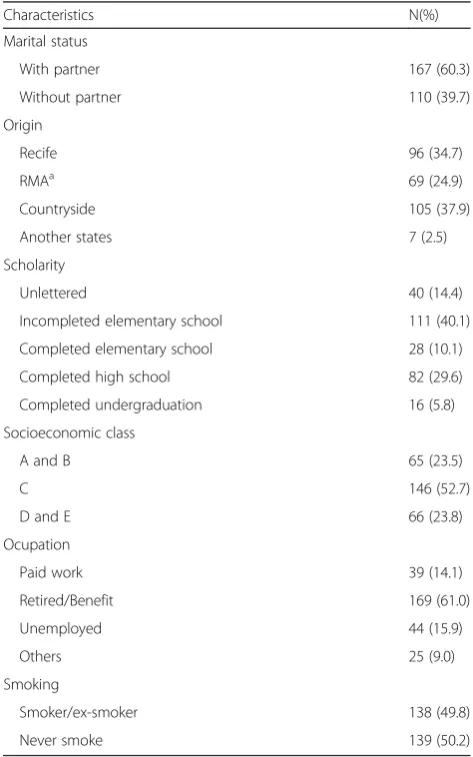
More than half of the sample (56.0 %) were female. The mean age was 54.7 ± 14.9 years, with 39.4 % (n=
109) of patients aged ≥60 years. Most individuals
(60.3 %) had a partner and 37.9 % came from the coun-tryside of Pernambuco. In relation to scholarity, 40.1 % had not finished elementary school. The results showed that most of the study population belonged to the lower social classes: Class C (52.7 %); and classes D and E (23.8 %). Most (61.0 %) were retired or had illness bene-fit and 14.1 % worked (Table 1).
The types of cancers, classified by the organic system, most frequently affected were the lower gastrointestinal tract (LGIT) (20.9 %) and reproductive system (18.8 %). Although the majority of patients (62.1 %) had received any type of curative treatment, half of them (50.2 %) had metastatic tumors. The sample showed a considerable prevalence of impaired physical performance (46.2 %), be-ing more prevalent in tumors of the reproductive system, as well as the symptoms of nutritional impact (Table 2).
Table 1Sociodemographic characteristics of the sample
Characteristics N(%)
Marital status
With partner 167 (60.3)
Without partner 110 (39.7)
Origin
Recife 96 (34.7)
RMAa 69 (24.9)
Countryside 105 (37.9)
Another states 7 (2.5)
Scholarity
Unlettered 40 (14.4)
Incompleted elementary school 111 (40.1)
Completed elementary school 28 (10.1)
Completed high school 82 (29.6)
Completed undergraduation 16 (5.8)
Socioeconomic class
A and B 65 (23.5)
C 146 (52.7)
D and E 66 (23.8)
Ocupation
Paid work 39 (14.1)
Retired/Benefit 169 (61.0)
Unemployed 44 (15.9)
Others 25 (9.0)
Smoking
Smoker/ex-smoker 138 (49.8)
Never smoke 139 (50.2)
a
The prevalence of malnutrition was 71.1 %, with simi-lar frequencies between moderate (35.4 %) and severe malnutrition (35.7 %). In relation to the types of cancer, severe malnutrition was more prevalent in patients with cancer of the upper gastrointestinal tract (28.3 %). Of the 126 patients who remembered the usual weight, 80.2 % had %WL≥5 in the last 6 months with a median of 14.7, whereas in tumors classified as others, 24.8 % had WL%≥5 in the last 6 months (Table 2).
Univariate analysis revealed that smokers/ex-smokers, socio-economic classes C, D and E, tumors of the upper gastrointestinal tract and lung, patients who had not cancer treatment, palliative care, PS≥2, individuals without a prior excess of weight and age ≥60 years were associated with the presence of malnutrition (Table 3).
In multivariate analysis the factors that remained sig-nificantly associated with malnutrition were: smokers/
ex-smokers, socio-economic classes C, D and E, PS ≥2 and age≥60 years (Table 4).
Discussion
In this study, according to PG-SGA, more than half of the sample had some degree of malnutrition, being simi-lar to the frequency of moderate and severe malnutri-tion, 35.4 and 35.7 %, respectively. The factors that independently associated to this nutritional disorder were smokers/ex-smokers, socio-economic classes C, D and E, PS≥2 and age≥60 years.
The high prevalence of malnutrition found in our study is not surprising, considering that hospitalized cancer patients are more likely to have some level of nu-tritional disability compared to other hospitalized indi-viduals [5, 6]. We must consider that the hospitalization prior to the period of the study was not an exclusion cri-terion in our research and this may have influenced the Table 2Sample characteristics according to the types of cancer
Type of cancer
Characteristics Total sample UGITa LGITb RSc Lung Breast Othersd
Type of cancer - n (%) 277 (100) 43 (15.5) 58 (20.9) 52 (18.8) 32 (11.6) 30 (10.8) 62 (22.4)
Age - Mean (SD) 54.7 (14.9) 57.6(13.3) 57.6 (12.9) 52.9 (15.3) 57.7 (13.8) 56.6 (15.5) 48.8 (16.2)
≥60 - n (%) 109 (39.4) 20 (18.3) 29 (26.6) 19 (17.4) 13 (11.9) 12 (11.0) 16 (14.7)
Gender - n (%)
Male 122 (44.0) 23 (18.9) 20 (16.4) 15 (12.3) 21 (17.2) 0 (0.0) 43 (35.2)
Female 155 (56.0) 20 (12.9) 38 (24.5) 37 (23.9) 11 (7.1) 30 (19.4) 19 (12.3)
Metastasis - n (%)
Absent 138 (49.8) 15 (10.9) 29 (21.0) 26 (18.8) 11 (8.0) 19 (13.8) 38 (27.5)
Present 139 (50.2) 28 (20.1) 29 (20.9) 26 (18.7) 21 (15.1) 11 (7.9) 24 (17.3)
Performance status - n (%)
<2 149 (53.8) 20 (13.4) 36 (24.2) 23 (15.4) 14 (9.4) 17 (11.4) 39 (26.2)
≥2 128 (46.2) 23 (18.0) 22 (17.2) 29 (22.7) 18 (14.1) 13 (10.2) 23 (18.0)
Symptoms of impact - n (%)
Yes 186 (67.1) 31 (16.7) 35 (18.8) 39 (21.0) 26 (14.0) 17 (9.1) 38 (20.4)
No 91 (32.9) 12 (13.2) 23 (25.3) 13 (14.3) 6 (6.6) 13 (14.3) 24 (26.4)
%WL≥5 em 6 meses - n (%)
Yes 101 (80.2) 20 (19.8) 21 (20.8) 15 (14.9) 15 (14.9) 5 (5.0) 25 (24.8)
No 25 (19.8) 2 (8.0) 5 (20.0) 7 (28.0) 1 (4.0) 4 (16.0) 6 (24.0)
Overweight (pBMI) - n (%)
Yes 76 (60.3) 14 (18.4) 12 (15.8) 15 (19.7) 12 (15.8) 4 (5.3) 19 (25.0)
No 50 (39.7) 8 (16.0) 14 (28.0) 7 (14.0) 4 (8.0) 5 (10.0) 12 (24.0)
PG-SGA - n (%)
Well nourished 80 (28.9) 7 (8.8) 19 (23.8) 13 (16.3) 5 (6.3) 13 (16.3) 23 (28.8)
Moderate malnutrition 98 (35.4) 8 (8.2) 21 (21.4) 21 (21.4) 17 (17.3) 12 (12.2) 19 (19.4)
Severe malnutrition 99 (35.7) 28 (28.3) 18 (18.2) 18 (18.2) 10 (10.1) 5 (5.1) 20 (20.2)
SDstandard deviation,PSperformance status,%WLweight loss percentage,PG-SGApatient-generated subjective global assessment;a
Upper gastrointestinal tract: esophagus, stomach, pancreas, liver, gallbladder, biliary ducts;b
Lower gastrointestinal tract: colon, rectum and anal canal;c
high prevalence. However, our results were similar to two Brazilian cross-sectional studies, which found a mal-nutrition prevalence of 66.3 and 77.8 %, although they used for nutritional diagnosis the Subjective Global Assessment (SGA) [5, 21] different from our study that used the PG-SGA. Equivalent results were also obtained in Latin America (65.6 %), South Korea (61.3 %) and Australia (76.0 %) [2, 6, 22].
In relation to lower prevalences of malnutrition in cancer patients, were found two other Brazilian studies, with frequencies of 39.4 and 48.2 %, using the PG-SGA
as a nutritional assessment method. These results can be justified because they are studies conducted with pa-tients at the beginning of the chemotherapy treatment and with more than 1/3 of the sample with tumor in stages I or II. Different from our patients who had 50.2 % of metastatic tumors, indicating advanced stages of disease [15, 23].
The most common method for initial nutritional as-sessment in cancer patients was the ASG [5, 21], how-ever, nowadays this tool is not well recommended. Because the incorporation of prognostic indicators such Table 3Unadjusted analysis of factors associated with malnutrition
Variables Total sample Malnutrition PR (IC95%) p
value
N N (%)
Smoking 0.005
Smoker/ex-smoker 138 109 (79.0) 1.25 (1.07–1.45)
Never smoke 139 88 (63.3) 1.0
Socioeconomic class 0.003
A and B 65 36 (55.4) 1.0
C 146 106 (72.6) 1.31 (1.03–1.67)
D and E 66 55 (83.3) 1.50 (1.18–1.92)
Type of cancer 0.026
UGITa 43 36 (83.7) 1.48 (1.05–2.08)
LGITb 58 39 (67.2) 1.19 (0.83–1.70)
RSc 52 39 (75.0) 1.32 (0.93–1.88)
Lung 32 27 (84.4) 1.49 (1.05–2.11)
Breast 30 17 (56.7) 1.0
Othersd 62 39 (62.9) 1.11 (0.77–1.60)
Previous treatment 0.005
Absent 60 50 (83.3) 1.23 (1.06–1.42)
Present 217 147 (67.7) 1.0
Type of treatment <0.001
Clinicale 85 50 (58.8) 0.86 (0.62–1.21)
Surgical 22 15 (68.2) 1.0
Clinical e surgical 65 39 (60.0) 0.88 (0.62–1.25)
Palliative 45 43 (95.6) 1.40 (1.05–1.88)
Performance status <0.001
<2 149 84 (56.4) 1.0
≥2 128 113 (88.3) 1.57 (1.34–1.83)
Overweight 0.023
Yes 76 64 (84.2) 1.0
No 50 48 (96.0) 1.14 (1.02–1.28)
Age <0.001
<60 168 102 (60.7) 1.0
≥60 109 95 (87.2) 1.44 (1.25–1.65)
PRprevalence ratio,CIconfidence interval,psignificance level;a
Upper gastrointestinal tract: esophagus, stomach, pancreas, liver, gallbladder, biliary ducts;b Lower gastrointestinal tract: colon, rectum and anal canal;c
Reproductive system: ovarian, cervical, testicular and prostate;d
as the details of the symptoms of nutritional impact and weight loss, which are frequently observed in patients with cancer, to the PG-SGA, this tool is the indicated as initial method of nutritional assessment on admission of these individuals [9, 14, 16, 24].
It is well known that the %WL >5 in 6 months previ-ous to the diagnosis is correlated to a lower survival rate and when it is >10 % is associated with an increased risk of complications due to malnutrition [14]. In our study 36.5 % of the total sample had %WL≥5 in 6 months. This fact is a concern, because the weight loss process, regardless of the usual weight of the individual, is considered itself a malnutrition process, even after the body changes, the patient remains within normal pat-terns [12, 25].
Another characteristic prognostic indicator of the can-cer patient is the presence of symptoms of nutritional impact, due to its high prevalence mainly due to the tumor itself, antineoplastic therapy introduced as well as malnutrition [14, 15]. Our results showed that more than half of the sample (67.1 %) had symptoms of nutri-tional impact, in which the most prevalent were: an-orexia (50.5 %), pain (23.1 %), vomiting (19.4 %), constipation, and dysgeusia (17.7 %). These results agree with Brazilian and American cross-sectional studies, which place anorexia and pain among the most preva-lent symptoms in their populations [22, 23].
A recent prospective study conducted in Canada on patients with advanced cancer showed an association be-tween the symptoms of nutritional impact (anorexia,
gastric fullness, dysgeusia, dry mouth and dysphage) and lower survival rate on its univariate analysis, with dys-phagia as an independent factor on its final model [26]. This fact highlights the importance of evaluation and ap-propriate management of these symptoms, given the large impact that causes on prognosis and quality of life of patients.
A concerning data found was the high prevalence of se-vere malnutrition (35.7 %), because this value is above the presented in the literature [3, 15, 23, 27]. We could refer the high rate to the fact that our patients were exposed to various risk factors for malnutrition as observed in the univariate analysis. We must also highlight the fact that the food and nutrition insecurity can permeate many sub-jects of our population, since a part of it belongs to lower social classes, which is an independent risk factor for mal-nutrition (p= 0.012) in our multivariate analysis.
The data regarding nutritional status of our patients only reaffirm the neglect to recognize malnutrition as a public health problem, considering that the prevalence rates have not decreased, despite being well documented over the past decades and its relationship with the prog-nosis and quality of life of patients with cancer [1]. A limiting factor in our study for this assessment is the lack of data on early nutritional support for these pa-tients. Although, an important move to be made is to invest in adequate nutritional screening in order to es-tablish an early nutritional therapy in order to prevent deterioration of nutritional status which is already ex-pected in hospitalized patients.
Table 4Independent factors associated with malnutrition
Sample Outcome
Variables N N(%) RRunadjusted(CI95%) pvalue RRadjusted(CI95%) pvalue
Distal level
Smoking 0.005 0.015
Smoker/ex-smoker 138 109(79.0) 1.25(1.07–1.45) 1.21(1.04–1.40)
Never smoke 139 88(63.3) 1.0 1.0
Socioeconomic class 0.003 0.012
A and B 65 36(55.4) 1.0 1.0
C 146 106(72.6) 1.31(1.03–1.67) 1.30(1.02–1.65)
D and E 66 55(83.3) 1.50(1.18–1.92) 1.44(1.13–1.84)
Intermediate level
Performance status <0.001 <0.001
<2 149 84(56.4) 1.0 1.0
≥2 128 113(88.3) 1.57(1.34–1.83) 1.50(1.30–1.75)
Proximal level
Age <0.001 <0.001
<60 168 102(60.7) 1.0 1.0
≥60 109 95(87.2) 1.44(1.25–1.65) 1.36(1.19–1.56)
In this study, smoking was identified as an independ-ent risk factor for malnutrition (p= 0.015), in agreement with a British retrospective study that found an associ-ation between the use of cigarettes above 20 units/day and the necessity of use of enteral nutrition in patients with head and neck cancer (OR 4.08; IC 95 %: 1.29 – 12.89) [9]. Among the deleterious effects of nicotine, its action on the central nervous system leads to reduced appetite and these individuals are also susceptible to taste disturbance, causing a lower intake of nutrients [9, 28]. In addition, the tobacco has a thermogenic effect, leading to weight loss [9]. Another important factor in this relationship between smoking and malnutrition is the economic impact of the cigarettes on family spent, because instead of buying groceries part of the money is spent to keep the addiction [29].
Functional autonomy is a factor that deserves atten-tion from health professionals when the point is nutri-tional risk indicators, considering that individuals with limited functional capacity have difficulties in the prep-aration and food intake [19, 30]. The results of this study support this statement, because it was observed that the PS≥2 was a risk factor for malnutrition. Similar results were found by a French epidemiological study that found a chance of being malnourished almost three-fold higher in cancer patients admitted with low functional performance [3]. Similarly a multicenter cohort study showed that this is also a risk factor for ambulatory patients [19].
A Greek prospective study conducted with 173 pa-tients with lung cancer showed an association between the PS and the %WL >5 in the last 3 months (p<0.001), with %WL as an indicative of a considerable deterior-ation of the nutritional status [14, 16, 27]. Other results have also shown an independent relationship of the per-formance status with survival and death of patients with cancer [3, 26, 31].
According to our results, elderly is a factor that in-creases by almost 30 % the chance of malnutrition. This association was expected, since it is well known that advanced age predisposes to nutritional deficiencies, es-pecially in hospitalized individuals [3, 5, 6].
The previous overweigh was not associated with mal-nutrition in this study, most likely due to the limited number of patients (n= 126) who remembered the usual weight in the last 6 months. A French research showed a significant association between prior obesity and risk of malnutrition [3]. This finding can be explained by the negligence in relation to the excess of weight loss by the health care team, even knowing that the decrease in weight can be of lean mass, resulting in a worse progno-sis. We also highlight the knowledge that being over-weight is a bad prognosis factor due to inadequate dosage of medications for treatment, calculated from
body weight, and the chronic inflammatory condition of obese patients [3, 32, 33].
The most worrying fact in obese patients might be re-lated to the sarcopenia, characterized by a progressive and widespread loss of lean body mass, which is asso-ciated to a worsening of the functional status and quality of life and death [34]. A Canadian cohort that evaluated the sarcopenic obesity and its clinical impli-cations in patients with solid tumors, found a preva-lence of 15 % of sarcopenia in obese subjects (OR 4.2; 95 % CI: 2.4 – 7.2) [35].
Although it is well established in the scientific com-munity that the types of cancer and treatment are pre-dictive factors for malnutrition, in this study they did not remain in the final model. Such fact occurred prob-ably due to the small sample for this analysis, because there were considered different types of response of these two variables [3, 6, 7]. It is important to consider that factors such as comorbidities, antibiotic therapy and diagnostic time can also be associated with the outcome, however, they were not collected and therefore are con-sidered limiting factors of our research. It is also highlighted that the stage of the disease was not in-cluded on statistical analysis because the stage of tumors of different sites is distinct.
According to the extensive search performed in the main electronic databases, it was not found any other study in the northeast region of the country with a simi-lar design, exclusively with hospitalized cancer patients, including palliative care, and using the PG-SGA. How-ever, longitudinal studies that include larger numbers of patients to better determine the results found in our re-search are still needed.
Conclusion
The data presented in this study showed the high preva-lence of malnutrition in hospitalized cancer patients. The factors independently associated to this nutritional disorder were smokers/ex-smokers, socio-economic clas-ses C, D and E, PS≥2 and age≥60 years. Thus, the simple perception of these factors can alert health professionals about the risk of nutritional depletion and the need for differentiated nutritional intervention.
Availability of supporting data
The dataset that supports the results of this paper is in-cluded in the manuscript and its additional files.
Abbreviations
Competing interests
The authors report no competing of interest.
Authors’contributions
FRMS, ASRS, MGOAO and CSS contributed to the study design. FRMS performed data collection. FRMS and JNF analyzed the data. FRMS, ASRS and MGOAO wrote the article. All authors read and approved the final manuscript.
Acknowledgements
We are grateful to all patients who participated in the study.
We thank the Research Support Fund (FAPE) of the IMIP, for financial support for the research disclosure.
Author details
1Institute of Integrative Medicine Prof. Fernando Figueira (IMIP), Recife, PE,
Brazil.2Federal University of Pernambuco (UFPE), Recife, PE, Brazil.
Received: 24 September 2015 Accepted: 8 December 2015
References
1. Instituto Nacional de Câncer José Alencar Gomes da Silva. Consenso Nacional de Nutrição Oncológica. Serviço de Nutrição e dietética. 2015. http://www1.inca.gov.br/inca/Arquivos/consensonacional-de-nutricao-oncologica-2-edicao_2015_completo.pdf. Accessed 10 Mar 2015. 2. Wie GA, Cho YA, Kim SY, Kim SM, Bae JM, Joung H. Prevalence and risk
factors of malnutrition among cancer patients according to tumor location and stage in the National Cancer Center in Korea. Nutrition. 2010. doi:10. 1016/j.nut.2009.04.013.
3. Pressoir M, Desne S, Berchery D, Rossignol G, Poiree B, Meslier M, et al. Prevalence, risk factors and clinical implications of malnutrition in French Comprehensive Cancer Centre. British Journal of Cancer. 2010;102(6):966–971. 4. Wu BW, Yin T, Cao WX, Gu ZD, Wang XJ, Yan M, et al. Clinical application of
subjective global assessment in Chinese patients with gastrointestinal cancer. World J Gastroenterol. 2009. doi:10.3748/wjg.15.3542. 5. Waitzberg DL, Caiaffa WT, Correia MI. Hospital malnutrition: the Brazilian
National Survey (IBRANUTRI): a study of 4000 patients. Nutrition. 2001;17(7/8): 573–580.
6. Correia MI, Campos AC. Prevalence of hospital malnutrition in Latin America: the multicenter ELAN study. Nutrition. 2003. doi:10.1016/ S0899-9007(03)00168-0.
7. González SS, Sobrino PS, Álvarez JAC, Villarroel PG, Fernández CP. Parámetros antropométricos en la evaluación de la malnutrición en pacientes oncológicos hospitalizados; utilidad del índice de masa corporal y del porcentaje de pérdida de peso. Nutr Hosp. 2013. doi:10.3305/nh.2013.28.3.6369.
8. Datema FR, Ferrier MB, de Jong RJ B. Impact of severe malnutrition on short-term mortality and overall survival in head and neck cancer. Oral Oncol. 2011. doi:10.1016/j.oraloncology.2011.06.510.
9. Mangar S, Slevin N, Mais K, Sykes A. Evaluating predictive factors for determining enteral nutrition in patients receiving radical radiotherapy for head and neck cancer: a retrospective review. Radiotherapy and Oncology. 2006. doi:10.1016/j.radonc.2005.12.014.
10. Ulibarri JI, Burgos R, Lobo G, Martínez MA, Planas M, A. Pérez de la cruz JL. Recomendaciones sobre la evaluación del riesgo de desnutrición em los pacientes hospitalizados. Nutr Hosp. 2009;24(4):467–72.
11. Associação Brasileira de Empresas e Pesquisa. Critério de classificação econômica Brasil. 2011. http://www.abep.org/criterio-brasil. Accessed 20 Aug 2012.
12. Wold Health Organization. Physical status: the use and interpretation of anthropometry. In: WHO technical report series. WHO expert committee. 1995. http://apps.who.int/iris/bitstream/10665/37003/1/WHO_TRS_854.pdf. Accessed 24 Sept 2012.
13. Chumlea WC, Roche AF, Steinbaugh ML. Estimating stature from knee height for persons 60 to 90 years of age. Journal of American Geriatric Society. 1985. doi:10.1111/j.1532-5415.1985.tb02276.x.
14. Ottery FD. Definition of standardized nutritional assessment and interventional pathways in oncology. Nutrition. 1996;12(1):S15–S19.
15. Gonzalez MC, Borges LR, Silveira DH, Assunção MCF, Orlandi SP. Validação da versão em português da avaliação subjetiva global produzida pelo próprio pacientes. Rev Bras Nutr Clin. 2010;25(2):102–8.
16. Sánchez-Lara K, Turcott J, Sosa-Sánchez R, Green-Renner D. Evaluación del estado de nutrición en pacientes con câncer. Revista de Endocrinología y Nutrición. 2008;16(4):165–71.
17. World Health Organization. Encuesta multicentrica: salud, bien estar y envejecimiento (SABE) en América Latina y el Caribe. In: Anales da 36ª Reunión del Comité Asesor de Investigaciones em salud. 2001. 18. Oken MM, Creech RH, Tormey DC, Horton J, Davis TE, McFadden ET, et al.
Toxicity and response criteria of the Eastern Cooperative Oncology Group. Am J ClinOncol. 1982;5(6):649–55.
19. Bozzetti F, Mariani L, LoVullo S. The nutritional risk in oncology: a study of 1,453 cancer outpatients. Support Care Cancer. 2012. doi:10.1007/s00520-012-1387-x.
20. Sorensen JB, Klee M, Palshof T, Hansen HH. Performance status assessment in cancer patients. An inter-observer variability study. Br. J. Cancer. 1993;67:773–775. 21. Borges NP, Silva BA, Cohen C, Filho PEP, Medeiros FJ. Comparison of the
nutritional diagnosis, obtained through different methods and indicators, in patients with cancer. Nutr Hosp. 2009;24(1):51–5.
22. Bauer J, Capra S, Ferguson M. Use of the scored Patient-Generated Subjective Global Assessment (PG-SGA) as a nutrition assessment tool in patients with cancer. European Journal of Clinical Nutrition. 2002. doi:10. 1038/sj.ejcn.1601412.
23. Colling C, Durval PA, Silveira DH. Pacientes submetidos a quimioterapia: avaliação nutricional prévia. Revista Brasileira de Cancerologia. 2012;58(4):611–7.
24. Destky AS, McLaughlin RJ, Baker JP, Johnston N, Whittaker S, Mendelson RA, et al. What is subjective global assessment of nutritional status?. JPEN. 1987; 11(1):8–13.
25. Aquino RC, Philippi ST. Identificação de fatores de risco de desnutrição em pacientes internados. Rev Assoc Med Bras. 2011;57(6):637–64.
26. Martin L, Watanabe S, Fainsinger R, Lau F, Ghosh S, Quan H, et al. Prognostic factors in patients with advanced cancer: use of the patient-generated subjective global assessment in survival prediction. J Clin Oncol. 2010. doi:10.1200/JCO.2009.27.1916.
27. Gioulbasanis I, Baracos VE, Giannousi Z, Xyrafas A, Martin L, Georgoulias V, et al. Baseline nutritional evaluation in metastatic lung cancer patients: mini nutritional assessment versus weight loss history. Ann Oncol. 2011. doi:10. 1093/annonc/mdq440.
28. Kolahdooz F, Mathe N, Katunga LA, Beck L, Sheehy T, Corriveau A, et al. Smoking and dietary inadequacy among Inuvialuit women of child bearing age in the Northwest Territories, Canada. Nutrition Journal. 2013. doi:10.1186/1475-2891-12-27.
29. Organização Mundial de Saúde. Tabagismo e Saúde nos Países em desenvolvimento. Banco Mundial para a Mesa Redonda de Alto Nível sobre Controle do Tabagismo e Políticas de Desenvolvimento. 2003. http://bvsms. saude.gov.br/bvs/publicacoes/inca/tabagismo_saude.pdf. Accessed 9 Jan 2014. 30. Oliveira MR, Fogaça KC, Leandro-Merhi VA. Nutritional status and functional
capacity of hospitalized elderly. Nutr J. 2009. doi:10.1186/1475-2891-8-54. 31. Chang PH, Yeh KY, Huang JS, Lai CH, Wu TH, Lan YJ, et al. Pretreatment
performance status and nutrition are associated with early mortality of locally advanced head and neck cancer patients undergoing concurrent
chemoradiation. Eur Arch Otorhinolaryngol. 2013. doi:10.1007/s00405-012-2290-2. 32. Griggs JJ, Sorbero ME, Lyman GH. Undertreatment of obese women
receiving breast cancer chemotherapy. Arch Intern Med. 2005. doi:10.1001/ archinte.165.11.1267.
33. McTiernan A. Obesity and cancer: the risks, science, and potential management strategies. Oncology. 2005;19:871–81.
34. Cruz-Jentoft AJ, Baeyens JP, Bauer JM, Boirie Y, Cederholm T, Landi F, et al. Sarcopenia: European consensus on definition and diagnosis. Age and Ageing. 2010. doi:10.1093/ageing/afq034.