R E S E A R C H
Open Access
Validity and relative validity of a novel digital
approach for 24-h dietary recall in athletes
Lindsay B Baker
1*, Lisa E Heaton
1, Kimberly W Stein
1, Ryan P Nuccio
1and Asker E Jeukendrup
1,2Abstract
Background:We developed a digital dietary analysis tool for athletes (DATA) using a modified 24-h recall method and an integrated, customized nutrient database. The purpose of this study was to assess DATA’s validity and relative validity by measuring its agreement with registered dietitians’(RDs) direct observations (OBSERVATION) and 24-h dietary recall interviews using the USDA 5-step multiple-pass method (INTERVIEW), respectively.
Methods:Fifty-six athletes (14–20 y) completed DATA and INTERVIEW in randomized counter-balanced order. OBSERVATION (n = 26) consisted of RDs recording participants’ food/drink intake in a 24-h period and were completed the day prior to DATA and INTERVIEW. Agreement among methods was estimated using a repeated measures t-test and Bland-Altman analysis.
Results:The paired differences (with 95% confidence intervals) between DATA and OBSERVATION were not significant for carbohydrate (10.1%,−1.2–22.7%) and protein (14.1%,−3.2–34.5%) but was significant for energy (14.4%, 1.2–29.3%). There were no differences between DATA and INTERVIEW for energy (−1.1%,−9.1–7.7%), carbohydrate (0.2%,−7.1–8.0%) or protein (−2.7%, −11.3–6.7%). Bland-Altman analysis indicated significant positive correlations between absolute values of the differences and the means for OBSERVATION vs. DATA (r = 0.40 and r = 0.47 for energy and carbohydrate, respectively) and INTERVIEW vs. DATA (r = 0.52, r = 0.29, and r = 0.61 for energy, carbohydrate, and protein, respectively). There were also wide 95% limits of agreement (LOA) for most method comparisons. The mean bias ratio (with 95% LOA) for OBSERVATION vs. DATA was 0.874 (0.551-1.385) for energy, 0.906 (0.522-1.575) for carbohydrate, and 0.895 (0.395-2.031) for protein. The mean bias ratio (with 95% LOA) for INTERVIEW vs. DATA was 1.016 (0.538-1.919) for energy, 0.995 (0.563-1.757) for carbohydrate, and 1.031 (0.514-2.068) for protein.
Conclusion: DATA has good relative validity for group-level comparisons in athletes. However, there are large variations in the relative validity of individuals’dietary intake estimates from DATA, particularly in athletes with higher energy and nutrient intakes. DATA can be a useful athlete-specific, digital alternative to conventional 24-h dietary recall methods at the group level. Further development and testing is needed to improve DATA’s validity for estimations of individual dietary intakes.
Keywords: Energy intake, Carbohydrate, Protein, Dietary observations, Team sports
Background
An athlete’s daily nutritional intake can have a substan-tial impact on his/her health and performance [1,2]. Therefore, sports health professionals, such as registered dietitians (RDs), work with athletes to develop daily eat-ing strategies [1]. To analyze an athlete’s nutrient intake, RDs typically rely upon conventional methods such as food frequency questionnaires, food logs, or 24-h dietary
recall interviews [2,3]. However, conventional diet assess-ment techniques and nutrient databases have limitations, especially when applying them to unique populations such as athletes. For instance, conventional questionnaires and nutrient databases do not include sports nutrition prod-ucts, supplements and ergogenic aids. Furthermore, due to athletes’ busy lifestyles, it is often difficult to obtain complete 3-day food records and the amount of time they have available for a consultation with a RD may be limited. In these instances it may be desirable to use a method that is tailored to the athlete, takes into account sport-specific * Correspondence:lindsay.baker@pepsico.com
1Gatorade Sports Science Institute, 617 W. Main St., Barrington, IL 60010, USA
Full list of author information is available at the end of the article
products, and can be administered digitally for immediate feedback. Therefore, the dietary analysis tool for athletes (DATA) digital program was developed to address these is-sues, incorporating a customized database of sports nutri-tion products, and with the capacity to generate an instant report. The DATA is based on a 24-h recall model, using a modification of the validated United States Department of Agriculture (USDA) 5-step multiple-pass method [4].
The purpose of the present study was to determine DATA’s validity and relative validity for the estimation of 24-h energy, carbohydrate, protein, total fat, water, sodium, calcium, and iron intake in 14–20 year old petitive athletes. DATA’s validity was determined by com-paring the agreement between dietary intake recalled from DATA and that obtained from RDs direct observa-tions (OBSERVATION). DATA’s relative validity was de-termined by comparing the agreement between dietary intake recalled from DATA and that obtained from 24-h recall interviews using the USDA 5-step multiple-pass method (INTERVIEW). USDA 5-step multiple-pass was used as the reference dietary recall method for the determination of relative validity because it has been previously validated against dietary observations and the doubly labeled water technique for energy intake in children and adults [5,6] and because it is currently the conventional recall interview method of choice for many sports RDs.
Methods Ethics statement
This study was approved by the Sterling Institutional Review Board (Atlanta, GA) for the protection of hu-man study participants. Participants and their parent/ guardian were informed of the experimental procedures and associated risks before providing written informed consent.
General design
This study consisted of 3 phases: 1) tool development and pre-testing to finalize the DATA, 2) the validation of DATA by determining its level of agreement with OBSERVATION, and 3) DATA relative validity testing to determine the DATA’s agreement with INTERVIEW. The dietary intake determined from the OBSERVATION, DATA, and INTERVIEW were from the same 24-h time period (from the time the participant woke up on one day to the same time on the next day, e.g., 6:00 am to 6:00 am).
Study participants
A total of 87 male and female competitive athletes be-tween 14 and 20 years of age volunteered to participate in this study. Nineteen participants completed the pre-testing and 56 participants completed the validity/ relative validity testing procedures. The remaining 12
participants were non-adherent with instructions for completing one or more validity/relative validity testing sessions (DATA, INTERVIEW, or OBSERVATION, or all three) and thus their data were excluded from analyses (seeQuality Controlfor further explanation).
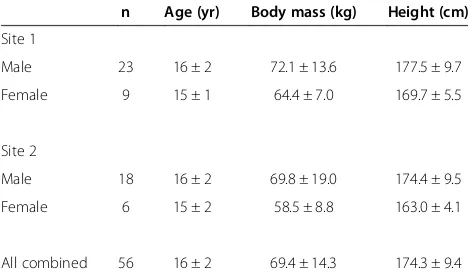
To be eligible to take part in this study, participants had to be participating in sports on the scholastic, colle-giate, or amateur/professional/elite level. The partici-pants competed in soccer, tennis, basketball, football, golf, lacrosse, baseball, softball, track and field, wrestling, boxing, ice hockey, figure skating, and dance (including jazz, ballet, and modern). Criteria for exclusion were ex-treme dietary habits, eating disorders (assessed by the SCOFF clinical prediction questions, which is a screen-ing tool for eatscreen-ing disorders, [7]), current infection, and not computer literate. Participant characteristics are pre-sented in Table 1.
Testing sites
Data collection took place at the Gatorade Sports Science Institute at IMG Academies in Bradenton, FL (Site 1) and Barrington, IL (Site 2) over a 6-week period in the months of April and May, 2012. The IMG Academies is a campus where young athletes live, train for and compete in their sport, and go to school during the academic year. The Barrington site is a traditional laboratory setting; study participants were recruited from schools in the surround-ing area to come in and complete the 24-h recalls. The 24-h recalls were conducted at both sites. The dietary ob-servations were only conducted at Site 1 because the cam-pus setting at IMG Academies (athletes generally stayed on campus all day) enabled the researchers to observe food/drink intake for a 24-h period.
DATA pre-testing
The purpose of the pre-testing was to obtain athletes’ feedback on DATA before finalizing the DATA. Partici-pants were administered the DATA by a member of the
Table 1 Participant characteristics
n Age (yr) Body mass (kg) Height (cm)
Site 1
Male 23 16 ± 2 72.1 ± 13.6 177.5 ± 9.7
Female 9 15 ± 1 64.4 ± 7.0 169.7 ± 5.5
Site 2
Male 18 16 ± 2 69.8 ± 19.0 174.4 ± 9.5
Female 6 15 ± 2 58.5 ± 8.8 163.0 ± 4.1
All combined 56 16 ± 2 69.4 ± 14.3 174.3 ± 9.4
study staff. After participants completed their 24-h diet-ary recall, they were asked to answer a questionnaire about DATA’s user-friendliness, clarity of its questions, and completeness of its food/drink options. Nineteen participants (15 male, 4 female) completed the pre-testing procedures. Some minor changes to the aesthetics, food/ drink database, and portion examples of DATA were made according to the participants’feedback. None of the 19 par-ticipants from the pre-testing procedures participated in the DATA validity testing.
DATA relative validity testing
The relative validity of DATA was assessed by meas-uring its agreement with INTERVIEW. Fifty-six athletes (41 male, 15 female) across both sites completed the DATA and INTERVIEW testing. Participants were ad-ministered the DATA and INTERVIEW in a randomized counter-balanced order (back-to-back on the same day) in a private room. The consistency of the agreement between DATA and INTERVIEW was assessed with a subset of participants (selected based on participant availability/interest in further participation; n = 30; 25 male, 5 female) by repeating (RETEST) both recall methods 1–2 weeks after the first visit (TEST).
DATA validity testing
The validity of DATA was assessed by measuring its agreement with OBSERVATION. OBSERVATION was completed with a subset of participants (selected based on participant availability/interest in participation; n = 26; 18 male, 8 female) at Site 1 only, the day prior to com-pleting their DATA and INTERVIEW.
Dietary observations
To determine what the participants actually ate in a 24-h period their dietary intake was observed and re-corded. OBSERVATIONs were completed by 3 trained RDs. Each RD observed 1 or 2 participants at a time. The participants were aware that their dietary intake was be-ing recorded; however, they were asked to consume their usual diet. All RDs were trained on how to observe and document the participants’dietary intake. Observers had access to relevant information (e.g., composition and brand names) about the food/drinks served in the IMG Academies cafeterias.
On the day of the OBSERVATION, participants re-ported to the laboratory in the morning before eating breakfast (~6:00 am). Then, a researcher followed the participants throughout the day and observed their diet-ary intake from breakfast through dinner (~6:00 pm). This involved RDs sitting with the participants in the cafeteria during breakfast, lunch, and dinner, as well as attending practices/games to observe and record their entire dietary intake at these times. The RDs recorded
the type and amount of foods and drinks consumed on a standardized observer’s log. To avoid being overly intru-sive, portion sizes were estimated by visual observations only (no measuring spoons/cups or scales were used). Dietary intake was not observed while the participants were in their class, locker room, or dorm. Therefore, the participants were asked to take a picture of and complete a food log for any snacks or drinks consumed when they were not being observed by a RD. The partic-ipants were each given a 3 inch by 3 inch notecard with their participant identification number to include in the picture (for scale and identification purposes). For pre-packaged snacks/drinks, sports nutrition products, and supplements, participants were also asked to take a pic-ture or turn in the nutrition facts label. The information from the RDs’ logs and the participants’ logs/pictures was entered into NutriBase (CyberSoft, Inc., Phoenix, AZ) to determine nutrient intake for the 24-h period (from the time the participants woke up on one day to the same time on the next day).
24-h dietary recall interview
A different investigator conducted the INTERVIEW than the one who observed the participant the previous day. During the in-person INTERVIEW, the participant was asked to describe and quantify everything consumed the previous day. The written USDA multiple-pass method with 5 passes (Quick List, Forgotten Foods List, Time and Occasion, Detail and Review, and Final Probe) was used to conduct the interview [5,6]. Food models and measuring cups/spoons were used by the investigators to illustrate examples of portion sizes. The interviewer followed a strict protocol and read questions from a script to ensure that all investigators conducted the interview in a similar manner. Answers provided by the participant were written on a standardized interview log. The informa-tion from the interviewer’s log was entered into NutriBase (CyberSoft, Inc., Phoenix, AZ) to determine the partici-pants’recalled nutrient intake for the 24-h period of inter-est (from the time the participants woke up on one day to the same time on the next day).
Dietary analysis tool for athletes digital program
period). To enter dietary intake, athletes were asked to in-dicate the time, duration, and location of each meal and snack. Foods and beverages were then broken down by category (dairy, meat, fruit, vegetable, bread, etc.). Within each category, pictures and examples were used to esti-mate portion sizes. A separate probe was used for dietary intake during exercise. At the end of each section the in-vestigator was cued to probe for commonly forgotten items. Upon completion of the 24-h recall, the program provides a summary of inputs, allowing for review and final revisions. The nutrient database integrated into DATA is comprised of the USDA food database aug-mented with full menus from large chain restaurants, sports nutrition products, and other brands and food items not available in the USDA database. Reports of 24-h nutrient intake from DATA were generated immediately upon completion of the dietary recall with the athlete and saved for subsequent comparison with INTERVIEW and OBSERVATION.
Quality control
The RDs’ inter-observer reliability (IOR) was measured at least once per week throughout the duration of the study. To determine IOR, two RDs simultaneously ob-served the meals and practices of the same participant throughout the course of the day. IOR was calculated as the percent of matches [(matches/total number of items observed) X 100] between the RDs over the course of one 24-h period of observation. An item was considered a match when the RDs’ estimations agreed within one-quarter of a serving (e.g., within 2 oz for fluid and within 0.75 oz for meat). Results from IOR on 9 different par-ticipants indicated 88% mean agreement (median = 87%, minimum = 74%, maximum = 100%) across observers, which is considered acceptable [8].
As another measure of quality control of the OBSER-VATION, participant adherence (following instructions to inform investigators about eating episodes outside of the RDs observation) was monitored closely to determine when an observation was incomplete. To determine whether a participant failed to inform investigators about snacking or meals not directly observed by a RD, the Principal Investigator compared the observer’s log with the corresponding interviewer’s log for all of the partici-pants. If the participant recalled eating a snack or meal that was not on the observer’s log then that participant’s OBSERVATION data were deemed invalid/incomplete and were not included in the final data set. Nine partici-pants failed to adhere to study instructions for the OBSERVATION testing. In many of these cases, the miss-ing data from OBSERVATION included large snacks and/ or meals consumed in the evening/before bedtime.
All of the INTERVIEWS were audio-recorded. Through-out the study, the Principal Investigator randomly selected
and reviewed 10% of each interviewer’s logs and audiotapes to ensure adherence to the interview protocol. Only minor errors and deviations from the script occurred (e.g., inter-view pace was a little slow or minor paraphrasing of some of the interview questions), thus no INTERVIEW data were excluded from analyses. Interviewers were given im-mediate feedback from the Principal Investigator regarding any required changes to their interviewing style.
Regarding the participants’ adherence on DATA and INTERVIEW testing days, 3 participants only had time to complete one of the two recall methods. Another 3 participants failed to show up at all for the dietary recalls the day after OBSERVATION (these 3 participants were also 3 of the 9 that had incomplete OBSERVATION). Thus, a total of 12 participants’data were excluded from the analyses for a non-adherence rate of 18% (12 out of the initial 68 participants enrolled for validity/relative validity testing).
Estimated total energy expenditure
Total energy expenditure was determined by adding resting and exercise energy expenditure during the 24-h period. The athletes resting metabolic rate was estimated using the Harris-Benedict equation [9] and exercise en-ergy expenditure was estimated using the subjects’body mass, activity type, and activity duration, according to the tables of McArdle et al. [10]. For exercise activities not found in the McArdle et al. [10] tables, or for partic-ipants with a body mass outside of the ranges in these tables, metabolic equivalents (METs) were used as an es-timate of exercise energy expenditure [11].
Statistical methods
Centrality and typical spread of participant characteristic values (raw scores) are described by means and stand-ard deviations (SD). For purposes of statistical assess-ment, all other data were log transformed to improve heterogeneity of variance. Agreement among methods (DATA vs. INTERVIEW, DATA vs. OBSERVATION, and INTERVIEW vs. OBSERVATION) was estimated using the intra-class correlation (ICC) (2-way analysis of vari-ance, absolute agreement, average measures) and the re-peated measures t-test (reported as mean percent paired difference). Ninety-five percent confidence intervals were also calculated for the ICC’s and paired differences. Mean differences of the log-transformed data in the repeated measures t-test were adjusted (100 (ediff- 1)) to produce exact percent difference values.
and Nevill [13]. When statistically significant correla-tions were observed between the absolute values of the means vs. differences (indicating non-randomness of errors) the Bland-Altman analysis was recalculated based on the natural log transformation. The natural log values of mean bias and its random error compo-nent were calculated by multiplying and dividing the antilog of mean bias by the antilog of its random error component. The mean bias ratios with 95% limits of agreement of transformed data are reported for energy, carbohydrate, and protein for each dietary assessment method comparison.
The first vs. second recall method (for the DATA vs. INTERVIEW comparison) were compared to determine whether there was an order effect of administering the recalls back-to-back. Results at Site 1 and Site 2 were compared to determine whether there were site differ-ences in the statistical agreement between DATA and INTERVIEW. The significance level for all statistical tests was set atα= 0.05. Calculations were accomplished using Statistical Package for the Social Sciences (SPSS) version 15.0 statistical software.
Results
Data from a total of 56 participants for INTERVIEW and DATA (32 at Site 1 and 24 at Site 2,) and 26 partici-pants for OBSERVATION (all at Site 1) were included in the analyses. There were no order effects of the recall methods for the DATA vs. INTERVIEW comparison, as the differences (with 95% confidence intervals) between the first and second recall were not significant for energy [−34 (−230 to 163) kcal], carbohydrate [4.9 (−19.8 to 29.6) g], protein [−2.3 (−12.8 to 8.1) g], total fat [−5.0 (−17.5 to 7.5) g], water [25 (−215 to 266) mL], sodium [−406 (−820 to 7) mg], calcium [41(−66.0 to 148.3) mg], or iron [0.4 (−1.6 to 2.4) mg]. In addition, there were minimal site differences in the agreement between DATA
and INTERVIEW, with the ICC for fat intake at Site 2 (0.53, −0.11 to 0.80) being the only unfavorable result. There was good agreement (significant ICCs and no paired differences) between DATA and INTERVIEW at both sites for all other nutrients.
DATA’s validity (Agreement between DATA and OBSERVATION)
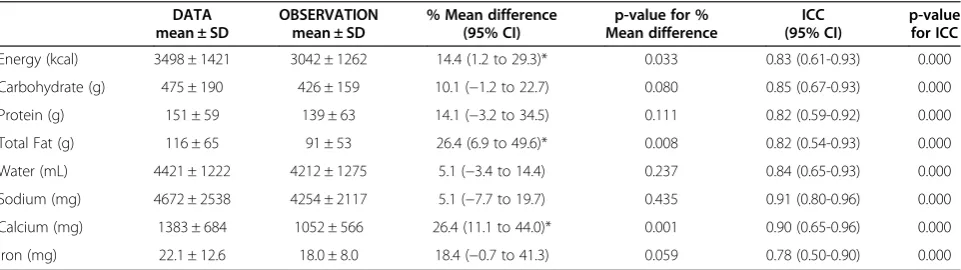
Table 2 shows the mean ± SD (untransformed data) and the statistical comparison (transformed data) between DATA and OBSERVATION for 24-h dietary intake of energy, carbohydrate, protein, total fat, water, sodium, calcium, and iron. The ICC’s were statistically significant for energy, carbohydrate, protein, total fat, water, sodium, iron, and calcium. The paired differences for carbohydrate, protein, water, sodium, and iron were not statistically sig-nificant. However, the energy, total fat, and calcium mea-sured with DATA were significantly greater than that of OBSERVATION.
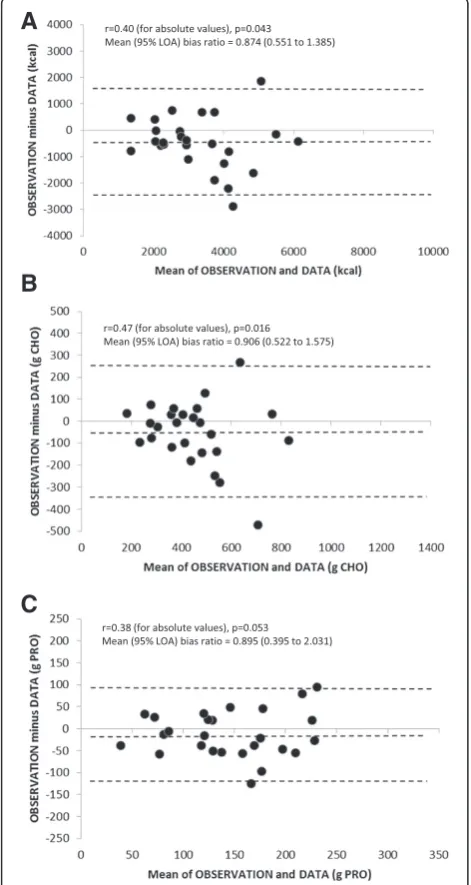
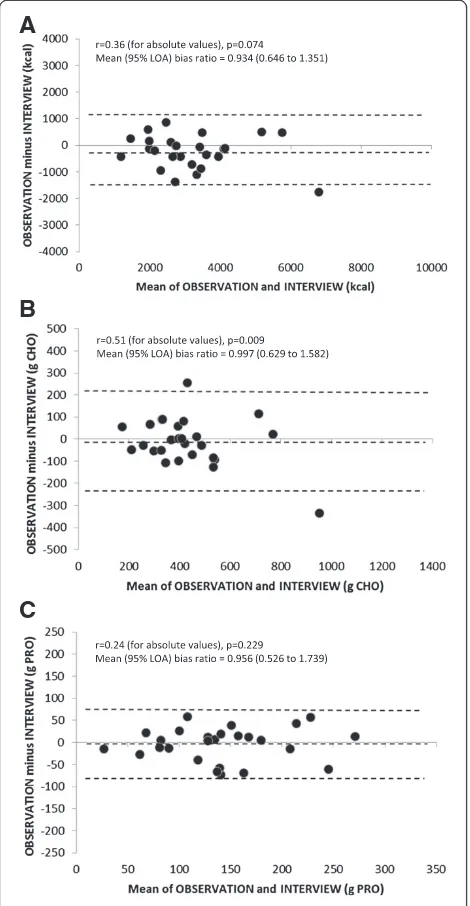
Figure 1 shows Bland-Altman plots of the mean of OBSERVATION and DATA against the differences be-tween OBSERVATION and DATA for energy, carbo-hydrate, and protein (n = 26). The difference between OBSERVATION and DATA fell within the limits of agreement (95% CI) for all but 2 participants (1 above and 1 below the 95% CI) for energy, carbohydrate, and protein. Visual inspection of the Bland-Altman plots shows that the larger differences between OBSERVATION and DATA generally occurred at higher energy, carbo-hydrate, and protein ingestion rates. There were also significant correlations between the means and differ-ences for energy (r = 0.40, p = 0.043) and carbohydrate (r = 0.47, p = 0.016), thus the Bland-Altman analysis was recalculated based on the natural log transformation. The mean bias ratios (with 95% limits of agreement) of transformed data for OBSERVATION in comparison to DATA are shown in Figure 1.
Table 2 Agreement between DATA and OBSERVATION (n = 26)
DATA mean ± SD
OBSERVATION mean ± SD
% Mean difference (95% CI)
p-value for % Mean difference
ICC (95% CI)
p-value for ICC
Energy (kcal) 3498 ± 1421 3042 ± 1262 14.4 (1.2 to 29.3)* 0.033 0.83 (0.61-0.93) 0.000
Carbohydrate (g) 475 ± 190 426 ± 159 10.1 (−1.2 to 22.7) 0.080 0.85 (0.67-0.93) 0.000
Protein (g) 151 ± 59 139 ± 63 14.1 (−3.2 to 34.5) 0.111 0.82 (0.59-0.92) 0.000
Total Fat (g) 116 ± 65 91 ± 53 26.4 (6.9 to 49.6)* 0.008 0.82 (0.54-0.93) 0.000
Water (mL) 4421 ± 1222 4212 ± 1275 5.1 (−3.4 to 14.4) 0.237 0.84 (0.65-0.93) 0.000
Sodium (mg) 4672 ± 2538 4254 ± 2117 5.1 (−7.7 to 19.7) 0.435 0.91 (0.80-0.96) 0.000
Calcium (mg) 1383 ± 684 1052 ± 566 26.4 (11.1 to 44.0)* 0.001 0.90 (0.65-0.96) 0.000
Iron (mg) 22.1 ± 12.6 18.0 ± 8.0 18.4 (−0.7 to 41.3) 0.059 0.78 (0.50-0.90) 0.000
DATA’s relative validity (Agreement between DATA and INTERVIEW)
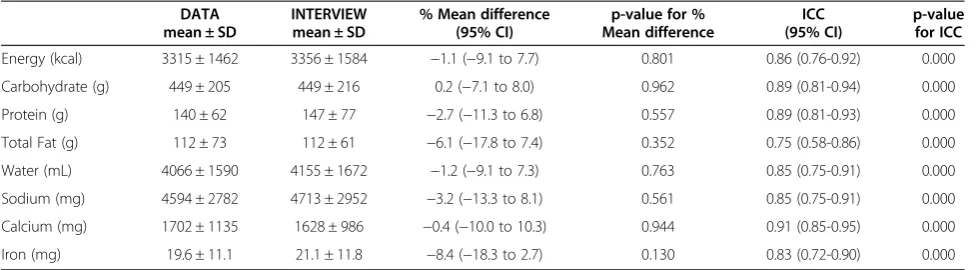
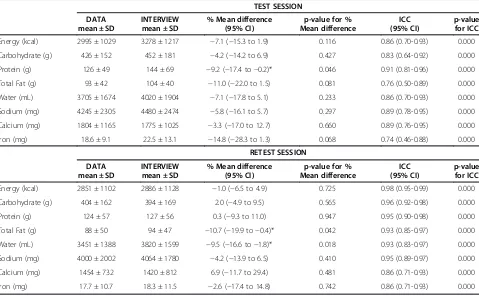
Table 3 shows the mean ± SD (untransformed data) and the statistical comparison (transformed data) between DATA and INTERVIEW for 24-h dietary intake of energy, carbohydrate, protein, total fat, water, sodium, calcium, and iron. The ICC’s were statistically significant and the paired differences were not statistically significant
for energy, carbohydrate, protein, total fat, water, sodium, iron, and calcium.
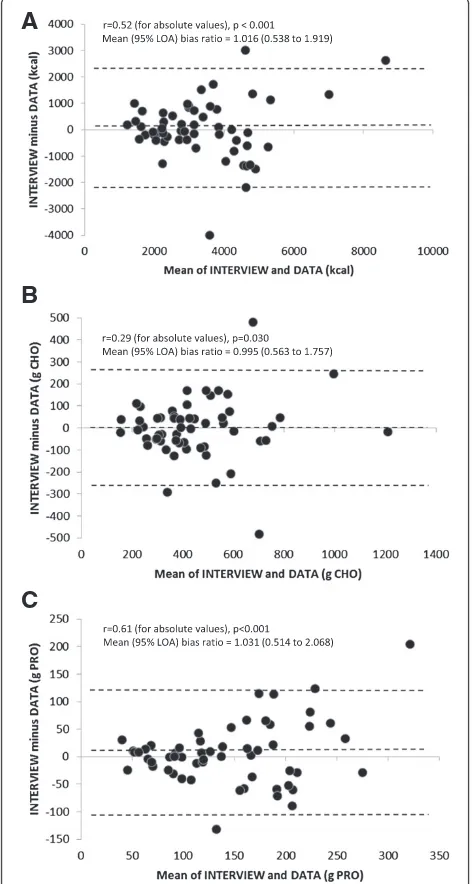
Figure 2 shows Bland-Altman plots of the mean of INTERVIEW and DATA against the differences between INTERVIEW and DATA for energy, carbohydrate, and protein (n = 56). The difference between INTERVIEW and DATA fell within the limits of agreement (95% CI) for all but 3 participants (2 above and 1 below the 95% CI) for energy, 2 participants (1 above and 1 below the 95% CI) for carbohydrate, and 3 participants (2 above and 1 below the 95% CI) for protein. Visual inspection of the Bland-Altman plots shows that the larger differences between INTERVIEW and DATA occurred at higher en-ergy, carbohydrate, and protein ingestion rates. There were also significant correlations between the means and differences for energy (r = 0.52, p < 0.001), carbohydrate (r = 0.29, p = 0.030), and protein (r = 0.61, p < 0.001), thus the Bland-Altman analysis was recalculated based on the natural log transformation. The mean bias ratios (with 95% limits of agreement) of transformed data for INTERVIEW in comparison to DATA are shown in Figure 2.
Table 4 shows the ICC’s and the paired differences be-tween DATA and INTERVIEW for the 30 participants that completed both TEST and RETEST sessions. The ICCs were statistically significant for energy, carbohy-drate, protein, total fat, water, sodium, iron, and calcium for both TEST and RETEST. The paired differences be-tween DATA and INTERVIEW were not statistically sig-nificant during TEST or RETEST for energy, carbohydrate, sodium, iron, and calcium. However, the paired differences were statistically significant for RETEST total fat and water and TEST protein in that values obtained with DATA were significantly less than that of INTERVIEW.
Agreement between INTERVIEW and OBSERVATION Table 5 shows the mean ± SD (untransformed data) and the statistical comparison (transformed data) between INTERVIEW and OBSERVATION for 24-h dietary in-take of energy, carbohydrate, protein, total fat, water, sodium, calcium, and iron. The ICC’s were statistically significant for energy, carbohydrate, protein, total fat, water, sodium, iron, and calcium. The paired differences were not statistically significant for energy and all nutri-ents except total fat, in which case INTERVIEW was sig-nificantly greater than OBSERVATION.
Figure 3 shows Bland-Altman plots of the mean of OBSERVATION and INTERVIEW against the differences between OBSERVATION and INTERVIEW for energy, carbohydrate, and protein (n = 26). The difference between OBSERVATION and INTERVIEW fell within the limits of agreement (95% CI) for all but 1 participant (below the 95% CI) for energy and 2 participants (1 above and 1 below the 95% CI) for carbohydrate. Visual inspection of
A
B
C
the Bland-Altman plots shows that the larger differences between OBSERVATION and INTERVIEW generally oc-curred at higher energy, carbohydrate, and protein inges-tion rates. There was also a significant correlainges-tion between the means and differences for carbohydrate (r = 0.51, p = 0.009), thus the Bland-Altman analysis was recalcu-lated based on the natural log transformation. The mean bias ratios (with 95% limits of agreement) of transformed data for OBSERVATION in comparison to INTERVIEW are shown in Figure 3.
Estimated total energy expenditure
The estimated energy expenditure of the 26 athletes included in the DATA vs. OBSERVATION and the INTERVIEW vs. OBSERVATION comparison was 3546 ± 959 kcal/day. The estimated energy expenditure of the 56 athletes included in the DATA vs. INTERVIEW comparison was 3135 ± 1029 kcal/day. There were no statistical differences between estimated energy ex-penditure and energy intake from DATA, INTERVIEW, or OBSERVATION. However, there was a tendency (p = 0.104) for the estimated energy expenditure to be greater than energy intake estimated from OBSERVATION (3042 ± 1262 kcal).
Discussion
The main findings from this study were that in 14–20 year old competitive athletes, DATA 1) is a valid tool for determining 24-h intake of carbohydrate, protein, water, sodium, and iron at the group level, but overestimates energy, total fat, and calcium as compared to direct diet-ary observations, 2) has good relative validity in estimat-ing 24-h energy, carbohydrate, protein, total fat, water, sodium, calcium, and iron intake at the group level as compared to the USDA 5-step multiple-pass dietary recall method, but 3) there are large variations in the validity and relative validity of DATA’s estimations of
individual dietary intakes, particularly in athletes with higher energy and nutrient intakes.
Dietary recall is an important aspect of a RD’s consult-ation with athletes. However, conventional methods are not tailored specifically for athletes. A few previous stud-ies have developed modified versions of food frequency questionnaires for athletes [14-16], but none involved a digital approach. We developed the DATA digital pro-gram with an integrated nutrient database, customized with sports nutrition products, to address these issues. The present study supports its relative validity, against the USDA 5-step multiple-pass dietary recall method, for group-level comparisons of dietary intake in 14–20 year old competitive team/skill sport athletes across two sites. Another limitation of conventional recall methods is that they do not provide immediate feedback. While the time it took to administer DATA and INTERVIEW was the same in the present study (22.3 ± 7.0 vs. 22.9 ± 6.7 min for DATA and INTERVIEW, respectively), DATA’s digital platform enabled instant output of a nutrient report, thus alleviating the time needed to complete data entry into a separate nutrient database software program as with the INTERVIEW method.
The TEST-to-RETEST consistency of DATA’s relative validity was high for energy, carbohydrate, sodium, cal-cium, and iron. However, the results of the present study suggested relatively low consistency in DATA’s estima-tions of protein, total fat, and water because the paired differences were statistically significant for RETEST total fat (−10.7%) and water (−9.5%) and TEST protein (−9.2%). Although the differences reached statistical sig-nificance it is also important to consider whether these differences were practically significant. Considering the subjective nature of dietary recall and previously reported low accuracy (up to 43% underestimation by athletes [17]) of participants’recalled diets, it may be reasonable to con-clude that ~10% difference between methods (as found
Table 3 Agreement between DATA and INTERVIEW (n = 56)
DATA mean ± SD
INTERVIEW mean ± SD
% Mean difference (95% CI)
p-value for % Mean difference
ICC (95% CI)
p-value for ICC
Energy (kcal) 3315 ± 1462 3356 ± 1584 −1.1 (−9.1 to 7.7) 0.801 0.86 (0.76-0.92) 0.000
Carbohydrate (g) 449 ± 205 449 ± 216 0.2 (−7.1 to 8.0) 0.962 0.89 (0.81-0.94) 0.000
Protein (g) 140 ± 62 147 ± 77 −2.7 (−11.3 to 6.8) 0.557 0.89 (0.81-0.93) 0.000
Total Fat (g) 112 ± 73 112 ± 61 −6.1 (−17.8 to 7.4) 0.352 0.75 (0.58-0.86) 0.000
Water (mL) 4066 ± 1590 4155 ± 1672 −1.2 (−9.1 to 7.3) 0.763 0.85 (0.75-0.91) 0.000
Sodium (mg) 4594 ± 2782 4713 ± 2952 −3.2 (−13.3 to 8.1) 0.561 0.85 (0.75-0.91) 0.000
Calcium (mg) 1702 ± 1135 1628 ± 986 −0.4 (−10.0 to 10.3) 0.944 0.91 (0.85-0.95) 0.000
Iron (mg) 19.6 ± 11.1 21.1 ± 11.8 −8.4 (−18.3 to 2.7) 0.130 0.83 (0.72-0.90) 0.000
Data are from the 56 subjects who completed DATA and INTERVIEW in the TEST session. Values for DATA and INTERVIEW (shown as mean ± SD) are
with total fat, water and protein in the TEST or RETEST sessions) is acceptable. Previous validation studies have also used a 10% difference (between the novel and cri-terion methods) as the cutoff for determining whether a recall method was valid [5,6]. Moreover, it is commonly accepted that the participants’ ability to recall their diet may involve a learning curve and this is a limitation of all dietary recall methods. That is, participants ability to
recall their diet may be relatively poor at first (during the first recall/consultation), but improve with repetition and familiarization. Similarly, it is interesting to note that the agreement between DATA and INTERVIEW gen-erally improved (higher ICC’s and lower paired differences) from TEST to RETEST across all nutrients (see Table 4).
Compared to OBSERVATION, nutrient estimations from DATA were not statistically different for carbo-hydrate, protein, water, sodium, and iron and had sta-tistically significant ICCs for energy and all nutrients measured. However, there were significant paired differ-ences between DATA and OBSERVATION for energy, total fat, and calcium intake (see Table 2). Thus, DATA overestimates energy, total fat, and calcium estimations compared to that obtained from RD’s direct observations, suggesting future work to improve DATA in these areas may be warranted. The reason for the discrepancy be-tween DATA and OBSERVATION is unclear. Since there were no significant mean differences between DATA and INTERVIEW, the discrepancies between DATA and OBSERVATION may not be a result of the dietary recall method or the nutrient database used in the DATA tool. Perhaps the differences between DATA and OBSERVATION could be related to the participants in the present study. The estimated 24-h energy expenditure (3546 ± 959 kcal/day) of the athletes in the DATA vs. OBSERVATION comparison (Site 1) was similar to the en-ergy intake reported from DATA (3498 ± 1421 kcal/day). Thus, the athletes’reported energy intake was realistic to what they may typically eat but overestimated compared to what was actually observed in the given 24-h period (3042 ± 1262). It is possible that athletes ate less than typ-ical because they were being observed. The finding of under-eating relative to estimated energy expenditure may also be related to the fact that many of the participants were tested on competition days. Although energy expend-iture tends to be higher on match days than training days [18], others have also reported that athletes tend to eat less on match days (possibly due in part to game stress) [2]. Nevertheless, more work is needed to better understand the dietary intake habits and over/under-reporting tenden-cies in 14–20 year old competitive athletes in stop-and-go types of activities.
When analyzing results by individual participants, the Bland-Altman plots indicate wide 95% limits of agreement for OBSERVATION vs. DATA as well as INTERVIEW vs. DATA. As shown in Figures 1 and 2, while the mean bias ratios are generally low for energy, carbohydrate, and pro-tein, there is large variation in individual results of DATA’s validity and relative validity. In general, the greater differ-ences between methods occurred in participants with higher energy and nutrient intakes; as confirmed by the significant correlation between the absolute values of the differences and means between OBSERVATION and
A
B
C
DATA as well as INTERVIEW and DATA. Further devel-opment and research testing is needed to improve DATA’s validity and relative validity for estimations of energy and nutrient intake at the individual athlete level.
INTERVIEW was generally in better statistical agree-ment with OBSERVATION than DATA, as suggested by
the slightly higher ICCs, lower paired differences, and smaller 95% limits of agreement of INTERVIEW vs. OBSERVATION compared to DATA vs. OBSERVATION (see Tables 2 and 5 and Figures 1, 2 and 3). This find-ing confirms that the reference method used to test the relative validity of DATA was appropriate and effective.
Table 4 Agreement between DATA and INTERVIEW during the TEST and RETEST sessions (n = 30)
TEST SESSION
DATA mean ± SD
INTERVIEW mean ± SD
% Mean difference (95% CI)
p-value for % Mean difference
ICC (95% CI)
p-value for ICC
Energy (kcal) 2995 ± 1029 3278 ± 1217 −7.1 (−15.3 to 1.9) 0.116 0.86 (0.70-0.93) 0.000
Carbohydrate (g) 426 ± 152 452 ± 181 −4.2 (−14.2 to 6.9) 0.427 0.83 (0.64-0.92) 0.000
Protein (g) 126 ± 49 144 ± 69 −9.2 (−17.4 to−0.2)* 0.046 0.91 (0.81-0.96) 0.000
Total Fat (g) 93 ± 42 104 ± 40 −11.0 (−22.0 to 1.5) 0.081 0.76 (0.50-0.89) 0.000
Water (mL) 3705 ± 1674 4020 ± 1904 −7.1 (−17.8 to 5.1) 0.233 0.86 (0.70-0.93) 0.000
Sodium (mg) 4245 ± 2305 4480 ± 2474 −5.8 (−16.1 to 5.7) 0.297 0.89 (0.78-0.95) 0.000
Calcium (mg) 1804 ± 1165 1775 ± 1025 −3.3 (−17.0 to 12.7) 0.660 0.89 (0.76-0.95) 0.000
Iron (mg) 18.6 ± 9.1 22.5 ± 13.1 −14.8 (−28.3 to 1.3) 0.068 0.74 (0.46-0.88) 0.000
RETEST SESSION
DATA mean ± SD
INTERVIEW mean ± SD
% Mean difference (95% CI)
p-value for % Mean difference
ICC (95% CI)
p-value for ICC
Energy (kcal) 2851 ± 1102 2886 ± 1128 −1.0 (−6.5 to 4.9) 0.725 0.98 (0.95-0.99) 0.000
Carbohydrate (g) 404 ± 162 394 ± 169 2.0 (−4.9 to 9.5) 0.565 0.96 (0.92-0.98) 0.000
Protein (g) 124 ± 57 127 ± 56 0.3 (−9.3 to 11.0) 0.947 0.95 (0.90-0.98) 0.000
Total Fat (g) 88 ± 50 94 ± 47 −10.7 (−19.9 to−0.4)* 0.042 0.93 (0.85-0.97) 0.000
Water (mL) 3451 ± 1388 3820 ± 1599 −9.5 (−16.6 to−1.8)* 0.018 0.93 (0.83-0.97) 0.000
Sodium (mg) 4000 ± 2002 4064 ± 1780 −4.2 (−13.9 to 6.5) 0.410 0.95 (0.89-0.97) 0.000
Calcium (mg) 1454 ± 732 1420 ± 812 6.9 (−11.7 to 29.4) 0.481 0.86 (0.71-0.93) 0.000
Iron (mg) 17.7 ± 10.7 18.3 ± 11.5 −2.6 (−17.4 to 14.8) 0.742 0.86 (0.71-0.93) 0.000
Data are from the 30 subjects who completed both TEST and RETEST sessions. Values for DATA and INTERVIEW (shown as mean ± SD) are untransformed data. Paired comparisons and ICC analyses were conducted on transformed (natural log) data. Asterisks indicate where the mean differences are statistically significant. ICC p-values are listed as 0.000 because they are all less than 0.0005. DATA, Dietary Analysis Tool for Athletes; INTERVIEW, 24-h dietary recall interview using the USDA 5-step multiple-pass method; ICC, intraclass correlation.
Table 5 Agreement between INTERVIEW and OBSERVATION (n = 26)
INTERVIEW mean ± SD
OBSERVATION mean ± SD
% Mean difference (95% CI)
p-value for % Mean difference
ICC (95% CI)
p-value for ICC
Energy (kcal) 3266 ± 1388 3042 ± 1262 6.4 (−2.7 to 16.2) 0.165 0.92 (0.83-0.97) 0.000
Carbohydrate (g) 436 ± 198 426 ± 159 0.8 (−8.2 to 10.6) 0.866 0.91 (0.80-0.96) 0.000
Protein (g) 143 ± 61 139 ± 63 6.4 (−5.4 to 19.5) 0.287 0.92 (0.82-0.96) 0.000
Total Fat (g) 110 ± 54 91 ± 53 26.0 (8.2 to 46.7)* 0.005 0.83 (0.54-0.93) 0.000
Water (mL) 4039 ± 1209 4212 ± 1275 −4.9 (−12.6 to 3.5) 0.232 0.86 (0.70-0.94) 0.000
Sodium (mg) 4507 ± 2504 4254 ± 2117 1.2 (−10.6 to 14.5) 0.849 0.92 (0.82-0.96) 0.000
Calcium (mg) 1192 ± 635 1052 ± 566 15.3 (−1.6 to 35.0) 0.075 0.88 (0.74-0.95) 0.000
Iron (mg) 20.3 ± 9.9 18.0 ± 8.0 12.2 (−0.5 to 26.6) 0.059 0.90 (0.77-0.96) 0.000
The result of a strong agreement between INTERVIEW and OBSERVATION in the present study is consistent with previous validation studies in children and adults [4-6,19] and extends the validity of the USDA 5-step multiple-pass method when compared to observations of free-living 14–20 year old competitive athletes.
Regarding the agreement between INTERVIEW and OBSERVATION, it is also interesting to note that the
athletes in the present study did not underestimate their dietary intake; as indicated by the lack of statistical paired difference between INTERVIEW and OBSERVATION for energy, carbohydrate, and protein. This finding is in contrast with previous studies in which energy intake estimations from RDs’ observations or the doubly-labeled water technique suggested participants signifi-cantly under-report their intake. For example, studies with children [20], female distance runners [21,22], gym-nasts [23], ballet dancers [24], Tour de France cyclists [25], and overweight/obese adults [4] suggest that under-reporting of energy and/or macronutrient intake is com-mon [17,26]. The discrepancy between the present and previous studies may be due to differences in the par-ticipant population (mostly stop-and-go sports in the present study vs. aesthetic or endurance sports in pre-vious studies). Perhaps an alternative explanation for the participants’ lack of under-reporting of energy and nutrient intake is related to the methodology used in the present study. It is possible that as a result of be-ing observed by a RD, the participants were more mindful of their dietary intake and thus made a more concentrated effort to remember what and how much they consumed. However, it was important to conduct observations in order to assess DATA’s as well as IN-TERVIEW’s direct validity against a gold-standard dietary assessment technique.
Summary
Compared to direct dietary observations, the DATA digital program is a valid recall tool for estimating 24-h carbohydrate, protein, water, sodium, and iron in-take at the group level. Furthermore, DATA has good relative validity for estimating 24-h energy, carbohy-drate, protein, total fat, water, sodium, iron, and cal-cium intake at the group level when compared to the 24-h dietary interview method using the USDA’s 5-step multiple pass method. However, there are large varia-tions in the validity and relative validity of individuals’ dietary intake estimates from DATA, particularly in athletes with higher energy and nutrient intakes. Over-all, the results suggest that DATA can be a useful athlete-specific, digital alternative to conventional 24-h dietary recall methods at the group (e.g., team) level. Further development and testing is needed to improve DATA’s validity and relative validity for estimations of individual dietary intakes.
Competing interest
Financial support for this study was provided by the Gatorade Sports Science Institute, a division of PepsiCo, Inc. Authors Lindsay B. Baker, Lisa E. Heaton, Kimberly W. Stein, Ryan P. Nuccio, and Asker E. Jeukendrup are employees of the Gatorade Sports Science Institute, a division of PepsiCo, Inc. The views expressed in this article are those of the authors and do not necessarily reflect the position or policy of PepsiCo, Inc.
A
B
C
Authors’contributions
LB designed and coordinated the study protocol and drafted the manuscript. KS conceived of the study, and participated in its design and coordination, and helped to draft the manuscript. LH is a registered dietitian and was involved in study conception, protocol design, and data collection. RN is a registered dietitian and was involved in protocol design and data collection. AE helped to interpret study results and draft the manuscript. All authors read and approved the final manuscript.
Acknowledgments
We thank Dennis Passe (statistical consultation), Jackie Berning, Page Love, Leslie Bonci, Melinda Manore (assistance with development of the DATA), Cassandra Raugh, Katrina Wojciechowski, and Lindsey Pine (data collection) for their contributions to this study. Financial support for this study was provided by the Gatorade Sports Science Institute, a division of PepsiCo, Inc.
Author details
1Gatorade Sports Science Institute, 617 W. Main St., Barrington, IL 60010, USA. 2School of Sport and Exercise Sciences, University of Birmingham, Edgbaston,
Birmingham, UK.
Received: 22 October 2013 Accepted: 21 April 2014 Published: 30 April 2014
References
1. Rodriguez NR, DiMarco NM, Langley S, American Dietetic A, Dietitians of C, American College of Sports Medicine N, Athletic P:Position of the American Dietetic Association, Dietitians of Canada, and the American College of Sports Medicine: Nutrition and athletic performance.J Am Diet Assoc2009,109:509–527.
2. Holway FE, Spriet LL:Sport-specific nutrition: practical strategies for team sports.J Sports Sci2011,29(Suppl 1):S115–S125.
3. Grandjean AC:Macronutrient intake of US athletes compared with the general population and recommendations made for athletes.Am J Clin Nutr1989,49:1070–1076.
4. Moshfegh AJ, Rhodes DG, Baer DJ, Murayi T, Clemens JC, Rumpler WV, Paul DR, Sebastian RS, Kuczynski KJ, Ingwersen LA, Staples RC, Cleveland LE:The US Department of Agriculture Automated Multiple-pass method reduces bias in the collection of energy intakes.Am J Clin Nutr2008,88:324–332.
5. Conway JM, Ingwersen LA, Vinyard BT, Moshfegh AJ:Effectiveness of the US Department of Agriculture 5-step multiple-pass method in assessing food intake in obese and nonobese women.Am J Clin Nutr2003, 77:1171–1178.
6. Conway JM, Ingwersen LA, Moshfegh AJ:Accuracy of dietary recall using the USDA five-step multiple-pass method in men: an observational validation study.J Am Diet Assoc2004,104:595–603.
7. Cotton MA, Ball C, Robinson P:Four simple questions can help screen for eating disorders.J Gen Intern Med2003,18:53–56.
8. Baglio ML, Baxter SD, Guinn CH, Thompson WO, Shaffer NM, Frye FH: Assessment of interobserver reliability in nutrition studies that use direct observation of school meals.J Am Diet Assoc2004,104:1385–1392. 9. Harris J, Benedict F:A Biometric Study of Basal Metabolsim in Man.
Philidelphia, PA: F.B. Lippincott Co.; 1919.
10. McArdle ED, Katch FI, Katch VL:Exercise Physiology.5th edition. Philadelphia, PA: Lippincott, Williams, and Wilkins; 2004.
11. Ainsworth BE, Haskell WL, Herrmann SD, Meckes N, Bassett DR Jr, Tudor-Locke C, Greer JL, Vezina J, Whitt-Glover MC, Leon AS:Compendium of physical activities: a second update of codes and MET values.Med Sci Sports Exerc2011,2011(43):1575–1581.
12. Bland JM, Altman DG:Statistical methods for assessing agreement between two methods of clinical measurement.Lancet1986,1:307–310. 13. Atkinson G, Nevill AM:Statistical methods for assessing measurement
error (reliability) in variables relevant to sports medicine.Sports Med
1998,26:217–238.
14. Braakhuis AJ, Hopkins WG, Lowe TE, Rush EC:Development and validation of a food-frequency questionnaire to assess short-term antioxidant intake in athletes.Int J Sport Nutr Exerc Metab2011,21:105–112. 15. Pedisic Z, Bender DV, Durakovic MM:Construction and reproducibility of a
questionnaire aimed for evaluation of dietary habits in physically active individuals.Coll Antropol2008,32:1069–1077.
16. Ward KD, Hunt KM, Berg MB, Slawson DA, Vukadinovich CM, McClanahan BS, Clemens LH:Reliability and validity of a brief questionnaire to assess calcium intake in female collegiate athletes.Int J Sport Nutr Exerc Metab
2004,14:209–221.
17. Hill RJ, Davies PS:The validity of self-reported energy intake as determined using the doubly labeled water technique.Br J Nutr2001,85:415–430. 18. Burke LM, Loucks AB, Broad N:Energy and carbohydrate for training and
recovery.J Sports Sci2006,24:675–685.
19. Johnson RK, Driscoll P, Goran MI:Comparison of multiple-pass 24-hour recall estimates of energy intake with total energy expenditure determined by the doubly labeled water method in young children.
J Am Diet Assoc1996,96:1140–1144.
20. Smith AF, Baxter SD, Hardin JW, Nichols MD:Conventional analyses of data from dietary validation studies may misestimate reporting accuracy: illustration from a study of the effect of interview modality on children's reporting accuracy.Public Health Nutr2007,10:1247–1256. 21. Edwards JE, Lindeman AK, Mikesky AE, Stager JM:Energy balance in highly
trained female endurance runners.Med Sci Sports Exerc1993,25:1398–1404. 22. Schulz LO, Alger S, Harper I, Wilmore JH, Ravussin E:Energy expenditure of
elite female runners measured by respiratory chamber and doubly labeled water.J Appl Physiol1992,72:23–28.
23. Davies PSW, Feng J, Crisp JA, Day JME, Laidlaw A, Chen J, Liu X:Total energy expenditure and physical activity in young Chinese gymnasts.
Pediatr Exerc Sci1997,9:243–252.
24. Hill RJ, Davies PS:The validity of a four day weighed food record for measuring energy intake in female classical ballet dancers.Eur J Clin Nutr
1999,53:752–753.
25. Westerterp KR, Meijer GA, Janssen EM, Saris WH, Ten Hoor F:Long-term effect of physical activity on energy balance and body composition.Br J Nutr1992,68:21–30.
26. Schoeller DA:Limitations in the assessment of dietary energy intake by self-report.Metabolism1995,44:18–22.
doi:10.1186/1475-2891-13-41
Cite this article as:Bakeret al.:Validity and relative validity of a novel digital approach for 24-h dietary recall in athletes.Nutrition Journal 201413:41.
Submit your next manuscript to BioMed Central and take full advantage of:
• Convenient online submission
• Thorough peer review
• No space constraints or color figure charges
• Immediate publication on acceptance
• Inclusion in PubMed, CAS, Scopus and Google Scholar
• Research which is freely available for redistribution