E M P I R I C A L A R T I C L E
Open Access
The interaction between standards
development and economic growth of
China
Hao Zhang
*, Jiadong Jiang, Liwei Zheng and Xiangzhen Li
* Correspondence:wenyi1@126. com
China Aero-Polytechnology Establishment, Key Laboratory of Quality Infrastructure Efficacy Research, SAMR, 7 Jingshun Road, Chaoyang District, Beijing 100028, China
Abstract
China has been participating in the international standards activities since the reform and opening up period. China’s standards action has not only brought about significant changes in the way of international trade, but also changed the connotation and manifestation of economic growth, which has further affected China’s position in the world standards development. On the basis of qualitative analysis of the interaction between standards development and economic growth, this paper quantitatively analyzes the degree of interaction between them. The results indicate that the higher standards in a country, the stronger its economic strength and the higher its position in world standards development. This conclusion is helpful for the government, industry authorities, and enterprises to pay more attention to standards in quality management and improve the standards level.
Keywords:Standards, Economic growth, Technological innovation, China, Quality assurance
Introduction
Standards have become a significant part of international trade1. It plays an irreplace-able role in product quality assurance, building trust in trade, facilitating the flow of goods, and improving the development of the global market. At present, facing the in-creasingly competitive world market, a country’s competitive advantage depends not only on capital, labor, land, and other factors of production, but also on the compre-hensive national strength with technology as the core and the ability to transform tech-nology into standards to improve economic efficiency and competitive advantage. “Technology patentation and patent standards” is an important feature of industrial competition, especially in high-tech industries. Furthermore, some multinational enter-prises maintain their competitive advantage by participating in international standards activity. Nowadays, the strategic significance of standards have been widely recognized and emphasized among academia and industry.
In 2000, DIN (German institute for standards) pointed out that standards is the“key driver of economic growth.” The internal mechanism is that the standards could re-duce the time gap between technological innovation, diffusion, and application.
© The Author(s). 2019Open AccessThis article is distributed under the terms of the Creative Commons Attribution 4.0 International License (http://creativecommons.org/licenses/by/4.0/), which permits unrestricted use, distribution, and reproduction in any medium, provided you give appropriate credit to the original author(s) and the source, provide a link to the Creative Commons license, and indicate if changes were made.
Therefore, standards update accelerates technological innovation. Blind [1] provided an extensive discussion on the influence of standards on international trade and built an international standards classification (ICS) versus standards international trade classifi-cation (SITC) table. As pointed out by Blind [1], trade value shows a positive relation with standards. Further, Blind [2], Schmid [3] and Mai Lvbo [4,5] conducted empirical studies and draw conclusions that standards have become an important factor in pro-moting economic development. Swann et al. [6] had studied on the similar topic; he il-lustrated that national standards have significant positive influence on UK import and export trade, while there is no significant evidence that the international standards have such impact on export and import trade. On the contrary, Blind and Jungmittag [7] ar-gued that German national standards exert a negative influence on its international trade, while the international standards could promote import and export trade in German. Moenius [8] analyzed data from 12 OECD member states and found that both national standards and international standards have a positive impact on bilateral trade, but this effect differs among different sectors. Blind [9] focused on bilateral trade be-tween Germany and Britain. He indicated that international standards do have a posi-tive influence on trade, while the impact of national standards is uncertain. However, the study on bilateral trade between France and Germany shows that neither national nor international standards adopted by Germany promote from German to France (Blind and Jungmittag [9]). But the international standards promote import from France. Subsequently, empirical studies conducted by Czubala et al. [10] and Mangelsdorf [11] verified the view of Blind [7].
At present, the research of the standard’s impact on trade and economic growth mainly focuses on one-way research. Few scholars have opened the black box of stan-dards affecting economic growth and demonstrated that there is an interaction between standards development and economic growth. On the other hand, there are some re-searchers focusing on the impact of standards in developed countries by taking devel-oped countries and some countries which have bilateral trade with them as samples. Research on the trade effects of developing country standards is still rare. Since China is the largest trading country in the world and the largest developing country, it is of great theoretical significance and practical value to select China as the research object to examine the trade effect of standards development. Therefore, this study makes up for this deficiency.
The related mechanism
The effect of standards on economic growth
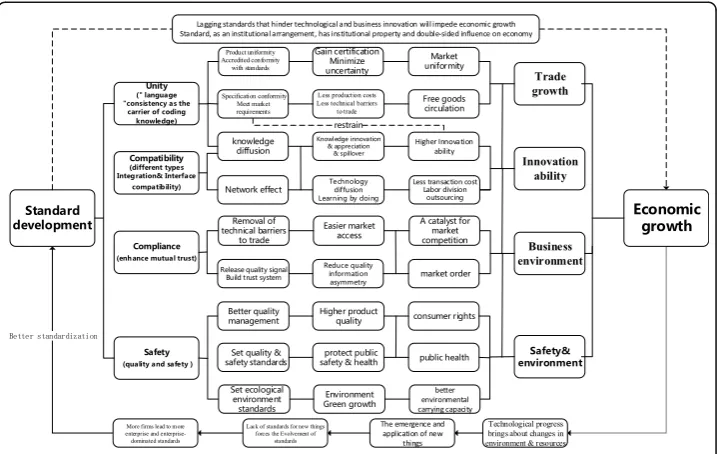
Standards is a normative document which is formulated by consensus and approved by recognized bodies for common use and repeated use in order to obtain the best order within a certain range. Therefore, standards is an institutional arrangement, and the in-stitution as one of the factors of production has an impact on economic growth. This paper argues that standards influence macroeconomic growth mainly based on the fol-lowing character.
products will have less uncertainty and further enhanced integration (Cowan et al.; Grimaldi and Torrisi; Velkar) [12–14]. On the other hand, it improves the specification consistency of products and services, verifies that products and services actually meet requirements, reduces enterprises production costs as well as technical barriers to trade in international markets, and thus ensures the free goods circulation (Butter) [15]. Last but not least, standards could motivate the spread of knowledge to a certain extent (Benezech et al.) [16]. For example, the ISO9000 standards provide a common language to underpin the coding process knowledge within an enterprise. Without unified and complete standards, there will be obstacles in the dissension of knowledge about prod-uct and services.
The second character is compatibility. The compatibility of standards is reflected in helping products integrate. This kind of integration generates economics of scale and thus boosts the prosperity of intra-industry trade. Standards can shorten the time for new products to appear on the market, promote the widespread use of innovative products, create a fair innovation environment for large and small enterprises, improve the interoperability of the network industry, and thus promote innovation (Swann) [17]. On the other hand, standards have its net effect which will lead to“less diversity” of products, although the reduction of variety is not the explicit goal. Actually, stan-dards simultaneously pave the way for scale economies and reduced transaction costs (Raballand and Aldaz) [18]. Second, standards may generate network effect to acceler-ate technology diffusion which could spread “learning by doing” effect in enterprises, which greatly lower the learning cost. Meanwhile, innovation is underpinned by net-work effects enhanced by standards in industries such as information and communica-tions technology. There is a common hypothesis in economic: if standards can reduce transaction costs, it could also support the division of labor, even outsourcing in mul-tiple activities sometimes (Steinmueller) [19].
The third character is compliance. The compliance of the standards endows them with the feature of the contract, which enhances mutual trust and ensures the smooth transaction. This character is mainly reflected in the following two aspects: first, it could break down technical barriers to trade (TBT), accelerate market access, and in-cent market competition. In order to follow the standards, enterprises usually need to adjust features, specifications, and performance of products. However, discriminatory or extremely high cost of complying with the standards will raise obstacles for further integration of enterprises into the whole trading system. In fact, trade and market com-petition will be inhibited by strict environmental standards and rules. Klimenko [20,
21] argues that trade will be impeded in the form of technical trade barriers due to over-strict standards. Secondly, it reduces the quality information asymmetry by releas-ing qualification signals, so as to establish a trust system and secure the market order. As the basis for both parties to reach a contract, standards can reduce the uncertainty in economic activities by making merchandises quality information available to con-sumers (Hudson and Jones [22]; Butter and Mosch [23]).
ecological standards promote environmental protection, environmental carrying cap-acity, and robustness.
These four characteristics or function of standards help to form a unified market, in which goods circulation, labor division, and outsourcing be improved, innovation ability be influenced, transaction cost be reduced, and market competition be stimulated. These four characteristics or function of standards secure market order, consumers’ wellbeing, and public health, promoting trade and productivity as well as the business environment. It could also safeguard the quality safety and environment and, therefore, drive macroeco-nomic growth. In addition, standards, as an institutional arrangement, has a double-sided influence on the economy. A thorough standards framework arrangement can boost eco-nomic growth, while unreasonable standards framework will hinder ecoeco-nomic growth.
The effect of economic growth on standards
It is generally agreed that international trade depends not only on the price factor, but also the quality and service. In the competition of improving products and services quality, a country will strive to establish relevant national standards and seek an inter-national discourse right. Adoption and the effectiveness of interinter-national standards by a country mainly depends on the country’s ability to absorb technology. Blind [2], from the perspective of intra-industry trade, indicates that the adoption of international stan-dards is conducive to promoting the specialized production of differential products, realizing the large economics of scale and promoting intra-industry trade. Therefore, standards could be viewed as an important indicator to measure a country’s competi-tiveness. Meanwhile, trade and economic growth will also impact standards in return. The rapid growth of a country’s economy often brings changes in environment and re-sources which may lead to the emergence of new development (including new technol-ogy and new method). Otherwise, the lack of corresponding standards for new technology drives the government and the market to set new standards and improve the standards level. For example, the development of new energy vehicles has pushed forward the evolution of industrials such as electric vehicles, batteries, and charging piles and the related standards. However, there are only a few researches focus on the complementary relationship between standards development and economic growth.
The interaction mechanism between standards development and economic growth is shown in Fig.1.
Data and methodology
The empirical method
In this paper, a VAR (vector autoregression) model is employed to measure the inter-action between standards development and economic growth. VAR model is usually used to construct a model by taking each endogenous variable in the system as a func-tion of the lagging value of all endogenous variables in the system. The VAR model is a more practical and reliable method than the traditional regression econometric model during data fitting. The mathematical expression of the model is as follows:
yt ¼A1yt−1þ•••þApyt−pþBxtþεt ð1Þ
whereytis the column vector of endogenous variables withkdimension,xtis the
dimensional matricesAandk × d dimensional matricesBare the coefficient matrices to be estimated, andεtis the random error which is a column vector withkdimensional.
Variable selection and data sources
Based on the purpose of our research, the following variables were selected considering the mechanism analysis and empirical model.
Explained variables are introduced in this paragraph. In this paper, the indicators representing economic growth, export volume, import volume, and innovation capacity are all taken as indicators of per capita in order to eliminate the impact of scale. Among these indicators, the economic growth indicator is the logarithm of per capita GDP (PGDP), which is the logarithm of the value that the original GDP divided by the total population. The logarithm of PGDP is adjusted to the 1978 constant prices ac-cording to the nominal GDP deflator. The exports and imports value of trade are de-flated according to the domestic CPI index, and then take the logarithm of the per capita level. The index of innovation ability is usually measured by patent level, among which invention patents are mainly used. Therefore, this paper takes the logarithm of the number of per capita invention patents to represent the innovation ability.
The other kind of variables is explanatory variables (standards capacity). During the study, we obtained the national standards stock and adopted international standard stock data by searching the Standards Administration (SAC) database. Besides, we re-ferred to the related research methods to calculate international standards number, namely if a standards is marked as “IDT (means be equivalent to)” an existing inter-national standards in the Standards Administration (SAC) database or“MOD (modified adopt)” an international standards, the standards will be classified as an international standards. In order to eliminate the impact of scale, the variables based on the stan-dards are reflected as the per capita level. The population calculation unit is one million
to avoid the order of magnitude difference caused by the excessive difference between the standards quantity and population. The variable definitions are shown in Table1.
According to Eq. (1) and the variables in the table, the Eq. (1) can be written as:
LNPGDP LNPEXP LNPIMP LNPPAT 2 6 6 4 3 7 7 5¼A1
LNPGDPðt−1Þ LNPEXPðt−1Þ LNPIMPðt−1Þ LNPPATðt−1Þ 2 6 6 4 3 7 7
5þ•••þAp
LNPGDPðt−pÞ
LNPEXPðt−pÞ LNPIMPðt−pÞ LNPPATðt−pÞ
2 6 6 4 3 7 7 5 þB LNPGBt LNPCBt LNPMODt LNPIDTt 2 6 6 4 3 7 7 5 t
þεt ð2Þ
The description of data sources is list as follows. The standards related data mainly come from the Standards Administration (SAC) database, which provides important in-formation such as the number of national standards, their attributes, code, the number of adopted international standards, and degree of adoption. The macro data such as China’s total trade, imports, and exports are collected fromChina Statistical Yearbook 2017. China’s foreign trade price index is calculated based on the World Bank database. Data on patent applications in China are retrieved from the website of the State Intel-lectual Property Office. To make sure of the statistical caliber and data availability, the research period was from 1978 to 2017.
Descriptive statistical analysis
In this study, the variance inflation factor (VIF) analysis is necessary to avoid the prob-lem of multi-collinearity between the control variables and lag terms of the explained variables. The average coefficient of VIF is 3.68, which is less than 5. The results indi-cate that the possibility of collinearity between the coefficients is relatively low. The de-scriptive statistics in this study are shown in Table2.
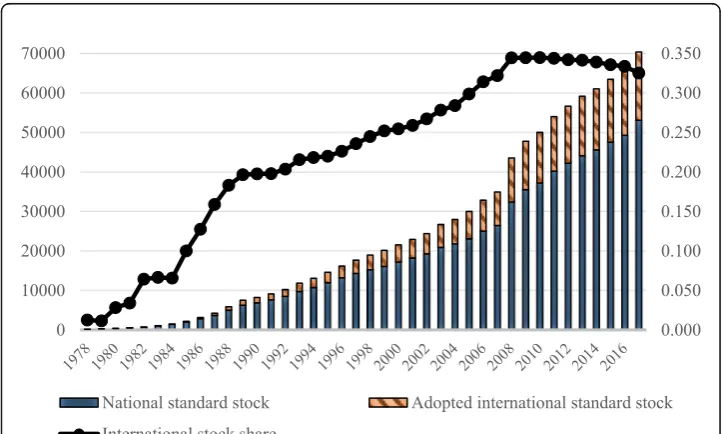
Figure 2 shows the national standards and international standards stock growth trend. As shown in the figure, the number of national and international standards is in-creasing steadily since 1978, and the share of international standards adopted in the current total standards have also greatly increased during this period. In particular, China adopted two international standards in 1978 and up to 17,269 in 2017. Take the
Table 1Variable definitions
Variable The variable name Symbol Definition and calculation
Explained variable
Economic growth LNPGDP The logarithm of per capita GDP
Exports volume LNPEXP The logarithm of per capita exports volume
Import volume LNPIMP The logarithm of per capita import volume
Innovation ability LNPPAT The number of patents every 100,000 population
Standards capacity
National standards stock LNPGB The logarithm of national standards stock every 1,000,000 population
Adopted international standards stock
LNPCB The logarithm of adopted international standards stock every 1,000,000 population
Amended adopted international standards stock
LNPMOD The logarithm of amended adopted international standards stock every 1,000,000 population
Equivalent-to-international standards stock
year 2017 as an example, the international standards stock accounts for 33% of the standards structure, and the increment accounts for 20%. Meanwhile, the scale of China’s foreign trade was also increasing obviously. In particular, the flow of import and export trade in China became much faster after 2001 when China joined the World Trade Organization. In 1978, China’s total import and export volume was 35.5 billion Yuan, including 16.76 billion Yuan of export value and 18.74 billion Yuan of import value. In 2017, China’s total import and export volume was 27792.092 billion Yuan. The export and import value was 15331.832 billion Yuan and 12460.260 billion Yuan respectively.
Results and discussion
Unit root test and Granger causality test
When applying VAR time series model, the stationary of the variable sequence must be tested to avoid the problem of pseudo-regression. In this paper, Augmented Dickey– Fuller test is used to test the variables, and the results are shown in Table 3. According Table 2Descriptive statistical analysis
Variable Average Variance Minimum Maximum
LNPGDP 8.565 1.617 5.953 10.990
LNPEXP 9.232 2.211 5.122 11.940
LNPIMP 9.167 2.102 5.233 11.733
LNPPAT 10.097 2.055 3.689 12.948
LNPGB 9.092 1.591 5.081 10.880
LNPCB 4.866 2.350 -1.571 7.125
LNPMOD 1.887 2.688 -2.303 5.770
LNPIDT 4.564 2.356 -1.585 6.678
to the test results, variables such as LNPGDP, LNPGB, LNPCB, and LNPINT are 0-order I (0) sequences, and the rest variables are first-0-order I (1) sequences at the signifi-cance level of 5%.
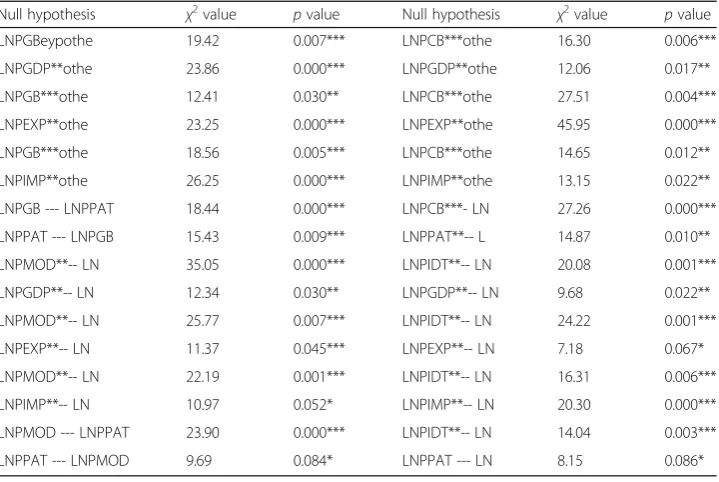
Furthermore, we applied the Granger causality test to judge the causality between the standards and economic growth. The optimal lag order is determined by AIC criterion, as shown in Table 4.The results indicate that, at the significance level of 5%, all se-quences constitute a two-way granger causality. For example, LNPGB and LNPGDP constitute a two-way granger causality. LNPGB is the granger cause of LNPGDP, and vice versa. That is, the deepening of China’s standards development may have affected China’s economic growth, but whether this effect is positive or negative remains to be further studied.
Table 3Unit root test
Variable Test form (C,T,L) Test value pvalue Test result (below 5%) Test result (below 10%)
LNPGDP (0,0,0) −13.348 0.000 Stable Stable
LNPEXP (0,0,0) −2.716 0.071 Unstable Stable
△LNPEXP (0,0,1) −5.003 0.000 Stable Stable
LNPIMP (0,0,0) −2.422 0.136 Unstable Unstable
△LNPIMP (0,0,1) −4.355 0.000 Stable Stable
LNPPAT (0,0,0) −1.795 0.383 Unstable Unstable
△LNPPAT (0,0,1) −5.958 0.000 Stable Stable
LNPGB (0,0,0) −13.348 0.000 Stable Stable
LNPCB (0,0,0) −9.299 0.000 Stable Stable
LNPMOD (0,0,0) −0.568 0.878 Unstable Stable
△LNPMOD (0,0,1) −5.412 0.000 Stable Stable
LNPIDT (0,0,0) −6.962 0.000 Stable Stable
The test form C, T, and L respectively represent the intercept, trend, and lag period of the testing equation
Table 4Granger causality test results Null hypothesis χ2value
pvalue Null hypothesis χ2value
pvalue
LNPGBeypothe 19.42 0.007*** LNPCB***othe 16.30 0.006***
LNPGDP**othe 23.86 0.000*** LNPGDP**othe 12.06 0.017**
LNPGB***othe 12.41 0.030** LNPCB***othe 27.51 0.004***
LNPEXP**othe 23.25 0.000*** LNPEXP**othe 45.95 0.000***
LNPGB***othe 18.56 0.005*** LNPCB***othe 14.65 0.012**
LNPIMP**othe 26.25 0.000*** LNPIMP**othe 13.15 0.022**
LNPGB --- LNPPAT 18.44 0.000*** LNPCB***- LN 27.26 0.000***
LNPPAT --- LNPGB 15.43 0.009*** LNPPAT**-- L 14.87 0.010**
LNPMOD**-- LN 35.05 0.000*** LNPIDT**-- LN 20.08 0.001***
LNPGDP**-- LN 12.34 0.030** LNPGDP**-- LN 9.68 0.022**
LNPMOD**-- LN 25.77 0.007*** LNPIDT**-- LN 24.22 0.001***
LNPEXP**-- LN 11.37 0.045*** LNPEXP**-- LN 7.18 0.067*
LNPMOD**-- LN 22.19 0.001*** LNPIDT**-- LN 16.31 0.006***
LNPIMP**-- LN 10.97 0.052* LNPIMP**-- LN 20.30 0.000***
LNPMOD --- LNPPAT 23.90 0.000*** LNPIDT**-- LN 14.04 0.003***
LNPPAT --- LNPMOD 9.69 0.084* LNPPAT --- LN 8.15 0.086*
Co-integration test
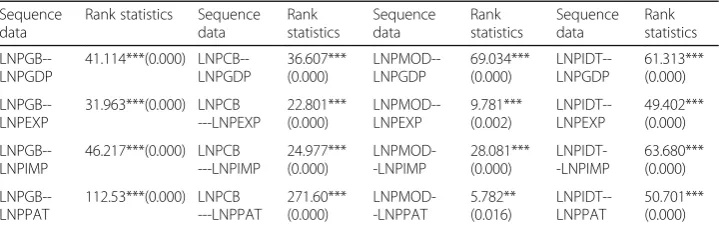
From previous analysis, there exit non-stationary characteristics between the original sequence of variables. Therefore, Johansen test is adopted in this paper to test the co-integration relationship between variables. The testing results are shown in Table 5. The results indicate that the trace statistics of all variables are significant which means there is a long-term equilibrium co-integration relationship between explained variables and explanatory variables.
We further standardize the co-integration vector, and the co-integration relationship between variables is arranged as shown in Table 6. There is significant evidence that standards enhance economic strength. The stronger the economic strength, the higher a country’s position in the global standards development. Further research shows that first, among the following variables, the equivalent adoption of international standards has the highest impact (2.242) to the economic growth, and the activity with the lowest impact is to modify the adoption of international standards; the impact of national standards and the adoption of international standards are basically identical. Second, in terms of export trade, the impact of adopting international standards is the highest (4.041), which is significantly greater than that of other three types of standards, and the impact of national standards is the lowest (2.055). Third, for import trade, the adoption of international standards has the most obvious impact, which is 3.760, while the modification of international standards has the least impact, which is 0.615. Fourthly, for patents, the impact of adopting international standards are highest (3.518), and the impact of adopting international standards are the least (0.634).
Unit circle test and impulse response function
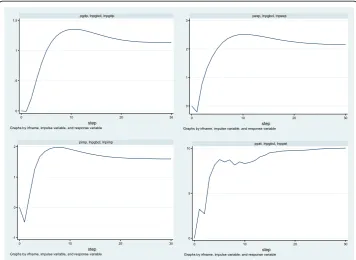
In this study, the residual analysis is applied after the estimation of the error correction model. We conducted LM test to test whether there is autocorrelation in the residuals. The testing results show that there is no autocorrelation in the residuals of each vari-able. It is necessary to verify whether the VECM system is in a stable process by testing its eigenvalues. If all the eigenvalues are inside the unit circle, they constitute a stable process. Take LNPGB as an illustration (shown in Fig. 3); all of the eigenvalues are in the unit circle, which indicates that the VECM of this model is stable. At the same time, this paper analyzes the impulse response function of the above model. As shown in Fig. 4, the impact of LNPGB variable on the four variables of LNPGDP, LNPEXP, LNPIMP, and LMPPAT tends to be stable for a long term in different periods. This in-dicates that the impact effect does not change in general.
Table 5Co-integration test
Sequence data
Rank statistics Sequence data Rank statistics Sequence data Rank statistics Sequence data Rank statistics LNPGB--LNPGDP 41.114***(0.000) LNPCB--LNPGDP 36.607*** (0.000) LNPMOD--LNPGDP 69.034*** (0.000) LNPIDT--LNPGDP 61.313*** (0.000) LNPGB--LNPEXP 31.963***(0.000) LNPCB ---LNPEXP 22.801*** (0.000) LNPMOD--LNPEXP 9.781*** (0.002) LNPIDT--LNPEXP 49.402*** (0.000) LNPGB--LNPIMP 46.217***(0.000) LNPCB ---LNPIMP 24.977*** (0.000) LNPMOD--LNPIMP 28.081*** (0.000) LNPIDT--LNPIMP 63.680*** (0.000) LNPGB--LNPPAT 112.53***(0.000) LNPCB ---LNPPAT 271.60*** (0.000) LNPMOD--LNPPAT 5.782** (0.016) LNPIDT--LNPPAT 50.701*** (0.000)
Analysis of variance
According to the variance analysis results (taking LNPGB as an example), LNPGB has a great influence on LNPGDP, LNPEXP, LNPIMP, and LMPPAT. Among these vari-ables, the impact to LNPGDP, LNPEXP, and LNPIMP is mainly self-caused. Such im-pact is still as high as 87.35%, 79.144%, and 89.300% in the tenth phase. The imim-pact of LNPPAT mainly comes from LNPGB, which was 71.816% in the tenth phase. We could conclude from the results that the impact of national standards on economic growth, export, or import is not significant, while it has significant impact on patents (Table7).
Conclusion
We can conclude that the higher the standards level of a country, the stronger its eco-nomic strength; the stronger the country’s economic strength, the higher its position in the world standards development. The result analysis also shows that the impact of Table 6The impact of standards on economic growth, trade, and patents
Variable LNPGB LNPCB LNPMOD LNPIDT
LNPGDP 1.701*** 1.620*** 0.633*** 2.242***
(0.000) (0.000) (0.000) (0.000)
LNPEXP 2.055*** 2.386*** 2.757*** 4.041***
(0.000) (0.000) (0.002) (0.000)
LNPIMP 2.066*** 3.760*** 0.615*** 2.467***
(0.000) (0.000) (0.009) (0.000)
LNPPAT 2.530*** 3.203*** 0.634** 3.518***
(0.000) (0.000) (0.016) (0.000)
** and *** represent the significance level of 5% and 1% respectively (**p< 0.05; ***p< 0.001). The probability value of the regression coefficient for the co-integration equation is in the parenthesis
national standards is greater than international standards on economic growth, among which the impact of adopted international standards is greater than that of modified international standards. On the contrary, in terms of trade growth, international stan-dards’influence to trade is more significant than national standards, and the impact on imports is greater than exports. In addition, the impact of adopted international stan-dards is far greater than the impact of modified international stanstan-dards on both sides trade. From the perspective of technological progress, international standards have a greater impact than national standards, among which the impact of equivalent adopted international standards is greater than modified international standards.
From the previous study, we provide the following suggestions for Chinese standards development. We should continuously improve the internationalization level of stan-dards and raise the proportion of international stanstan-dards at the same time. These two
Fig. 4Impulse response function (taking an example of LNPGB)
Table 7Analysis of variance (LNPGB as an example)
Phase LNPGDP LNPGB LNPEXP LNPGB LNPIMP LNPGB LNPPAT LNPGB
1 100.00 0.000 100.00 0.000 100.00 0.000 100.00 0.000
2 99.999 0.001 99.830 0.170 99.407 0.593 94.044 5.956
3 99.699 0.301 98.291 1.709 99.343 0.657 90.275 9.726
4 98.609 1.391 95.122 4.878 97.487 2.513 72.407 27.594
5 96.779 3.221 91.536 8.465 95.191 4.809 56.256 43.744
6 94.571 5.429 88.080 11.920 93.269 6.731 44.675 55.325
7 92.342 7.658 85.050 14.950 91.769 8.231 38.078 61.922
8 90.301 9.699 82.566 17.435 90.640 9.360 32.887 67.113
9 88.529 11.471 80.618 19.382 89.837 10.163 29.993 70.007
initiatives are crucial to promote the “going global” of Chinese standards. From the innovation development point of view, it is necessary to reform the standards system and optimize the standards structure. Besides, the important role of equivalent-to-international standards in the global competitiveness should be emphasized. Last but not least, the strategic guide mechanism of standards development should be formu-lated to give full play to the guiding role of“China standards”on international and do-mestic trade as well as the economic growth.
In conclusion, this study reveals the mechanism of the interaction between standards development and economic growth solved the differential impact of standards structure on trade and economic growth. In the meantime, the interaction between standards de-velopment and economic growth involves other components of the National Quality Infrastructure (NQI), and the relationship between standards development and eco-nomic growth will be further studied in the future.
Acknowledgements
We thank for Professor Blind’guidance and advice, for the financial support of the Key Laboratory of Quality Infrastructure Efficacy Research, AQSIQ, and for the review of anonymous reviewers. Of course, we are responsible for our own affairs.
Authors’contributions
All authors participated in the writing process, whereby the sequence of authors reflects their respective contribution to the article. All authors read and approved the final manuscript.
Funding
National key research and development program“Research on Contribution of NQI to National Economic and Social Growth (2016YFF0204202),” “International Competitiveness Evaluation and Demonstration Application of Key Communication Equipment in the Support of Certification and Accreditation to‘the Belt and Road Initiative’Trade Facilitation (2018YFF0215606).”
Availability of data and materials
Available
Competing interests
The authors declare that they have no competing interests.
Received: 20 May 2019 Accepted: 18 October 2019
References
1. Blind K (2000) The role of technical standards for the national innovation system: empirical evidence from Germany[C]// Proceedings of the Conference“Innovation and Enterprise Creation–Statistics and Indicators”in Sophia Antipolis, pp 2–9 2. Blind K (2004) The economics of standards: theory, evidence, policy [M]. Edward Elgar Publishing Limited
3. Schmid G (2011) Non-standard employment in Europe: its development and consequences for the European employment strategy. German Policy Studies/Politikfeldanalyse 7(1)
4. Lvbo M (2015a) Establishment of standardization efficacy evaluation model (part 1). China Standard 11:72–77 5. Lvbo M (2015b) Establishment of standardization efficacy evaluation model (part 2). China Standard 12:80–85 6. Swann P, Temple P, Shurmer M (1996) Standards and trade performance: the UK experience. Econ J:1297–1313 7. Blind K, Jungmittag A (2001) The impact of innovations and standards on trade: evidence from Germany. Proceedings
of EARIE, Dublin
8. Moenius J (2004) Information versus product adaptation: the role of standards in trade
9. Blind K, Jungmittag A (2005) Trade and the impact of innovations and standards: the case of Germany and the UK. Appl Econ 37(12):1385–1398
10. Czubala W, Shepherd B, Wilson JS (2009) Help or hindrance? The impact of harmonized standards on African exports. J Afr Econ 18(5):711–744
11. Mangelsdorf A (2011) The role of technical standards for trade between China and the European Union. Technol Anal Strategic Manag 23(7):725–743
12. Cowan R, David PA, Foray D (2000) The explicit economics of knowledge codification and tacitness. Industrial Corp Change 9(2):211–253
13. Grimaldi R, Torrisi S (2001) Codified-tacit and general-specific knowledge in the division of labour among firms: a study of the software industry [J]. Res Policy 30(9):1425–1442
14. Velkar A (2007) Accurate measurements and design standards: consistency of design and the travel of‘facts’between heterogeneous groups
16. Bénézech D, Lambert G, Lanoux B et al (2001) Completion of knowledge codification: an illustration through the ISO 9000 standards implementation process. Res Policy 30(9):1395–1407
17. Swann AC, Dougherty DM, Pazzaglia PJ et al (2005) Increased impulsivity associated with severity of suicide attempt history in patients with bipolar disorder. Am J Psychiatr 162(9):1680–1687
18. Raballand G, Aldaz-Carroll E (2005) How do differing standards increase trade costs? World Bank Publications 19. Steinmueller EW (2005) Technical compatibility standards and the co-ordination of the industrial and international
division of labour. Advancing Knowledge and the Knowledge Economy, Washington, DC
20. Klimenko MM (2009) Policies and international trade agreements on technical compatibility for industries with network externalities. J Int Econ 7(2):151–166
21. Klimenko MM (2009) Strategic interoperability standards and trade taxes. Int Rev Econ Finance 18(4):539–551 22. Hudson J, Jones P (2003) International trade in‘quality goods’: signalling problems for developing countries. J Int Dev
15(8):999–1013
23. Butter FAG, Mosch RHJ (2003) Trade, trust and transaction costs. Tinbergen Institute
Publisher’s Note