© Universiti Tun Hussein Onn Malaysia Publisher’s Office
IJIE
Journal homepage: http://penerbit.uthm.edu.my/ojs/index.php/ijie
The International
Journal of
Integrated
Engineering
ISSN : 2229-838X e-ISSN : 2600-7916
Influence of Outdoor Source on The Variations of Indoor
PM
2.5
Concentration and Its Morphological Properties in
Roadside School Environment
Azrin Suroto
1, Noor Faizah Fitri Md Yusof
1*, Wan Norfazlinda
1, Nur Amanina
Ramli
1, Syabiha Shith
11School of Civil Engineering, Engineering Campus,
Universiti Sains Malaysia, 14300 Pulau Pinang, MALAYSIA
*Corresponding Author
DOI: https://doi.org/10.30880/ijie.2019.11.01.013
Received 01 June 2018; Accepted 04 September 2018, Available online 10 May 2019
1.
Introduction
Particles with aerodynamic diameters equal or less than 2.5 µm, which are also known as fine particles, are air pollutants that can severely harm the respiratory system of humans, especially sensitive groups such as children [1]-[2]. In addition, individuals who are exposed to indoor pollutants are more susceptible than those who are exposed to outdoor air pollutants in the long term [2]. Exposure to high indoor PM, such as PM2.5, could increase the risk in acquiring respiratory problems, such as asthma, lung diseases, cardiovascular and cardiopulmonary diseases and premature death [3]-[7]. Children belong to the sensitive groups that spend 90% of their daily lives indoor, such as in school classrooms [8]-[10]. Many studies have determined that children who spend their school sessions in limited space over a period of several hours (6 – 8 hours) per day could be exposed to high concentrations of PM, such as PM2.5 [11]-[17]. Young children are more susceptible to air pollutions because they breathe at a higher rate than adults, which is proportional to the growth of tissues, body weight and the immune system [18]-[22].
Malaysia, which is a developing country, has currently experienced rapid development and industrial activities to achieve the developed country status. At the same time, the Malaysian population increases daily and is currently 32.3
Abstract: Particles with aerodynamic diameters equal or less than 2.5 µm, which are known as fine particles (PM2.5), are major air pollutants that could seriously impact ambient and indoor air quality. The air quality in school environments less than 500 m away from the roadside is potentially affected by vehicles through exhaust emissions. Thus, the concentrations of ambient and indoor fine particles (PM2.5) were measured using a portable outdoor beta-attenuation monitor and an optical indoor direct reading monitor in two naturally ventilated school environments for 8 h during the teaching and learning sessions. In addition, meteorological parameters such as temperature, relative humidity and wind speed were measured under ambient and indoor conditions. PM2.5 samples were also collected and morphologically characterised. Pearson’s correlation was applied to identify the relationship between the ambient and indoor conditions of PM2.5, temperature, relative humidity and wind speed. Results showed that the indoor and outdoor PM2.5 in selected schools were varied. The concentration of indoor PM2.5 was higher than that of outdoor PM2.5 in both schools. Pearson’s correlation showed a significant correlation between indoor and outdoor PM2.5 in schools A (p = 0.006, r = 0.54) and B (p = 0.001, r = 0.74). In addition, ambient temperature, relative humidity and wind speed are the important factors that affect the outdoor concentrations of PM2.5.
million [23]. Hence, the demand on industrial activities and transportation has also increased to fulfil the daily life requirements. This condition increases air pollution, especially from anthropogenic sources, such as industrialisation and vehicle emissions. Anthropogenic sources, which are mostly from outdoor sources, are considered an important factor that influences the concentrations of indoor air pollutants [19]. In addition, few studies have determined the relationship between indoor and outdoor concentrations of air pollutants [24]-[26]. Agrawal et al. [27] and Gadkan et al. [28] reported that the ambient air in dense urban and suburban areas with buildings and high traffic activities influences the concentrations of indoor air pollutants in indoor environments. Therefore, the present study identified the variations of indoor and outdoor PM2.5 concentrations in school environments, determined the influence of outdoor to indoor PM2.5 concentrations in school, and identified the morphological properties of indoor and outdoor PM2.5 in school.
2.
Materials and Method
2.1
Location of Study Areas
In this study, two schools that are located in Seberang Perai, Pulau Pinang were selected as the study areas, as shown in Fig. 1. The two schools were selected because they are categorised as suburban areas and are located near the roadside, where school A is 31.1 m and school B is 36.6 m away from the roadside. The two schools are located at high-density traffic areas because school A is located at the state road and school B is located at the main federal road based on the road code of the Ministry of Works, Malaysia [29]. Fig. 2 shows the condition during the indoor and outdoor sampling and monitoring of school environment, and the coordinate for each school is provided in Table 1. The monitoring and sampling activities were conducted for 2 days with 8 h/day at each school.
Fig. 1 - Location of study areas
a) b)
Table 1 - Location of each school located in Seberang Perai, Pulau Pinang
School Coordinate
A 5˚29’5.914”N; 100˚29’9.423”E B 5˚16’28.646”N; 100˚28’39.298”E
2.2
Data and sample collection
Air quality sampling and monitoring were conducted in one classroom for each school throughout the school session. The measurements focused on the indoor and outdoor concentrations of PM2.5, temperature, relative humidity (RH) and wind speed throughout the school session. For indoor measurement, an optical direct reader (Environmental Sampler, E-sampler) with a flowrate of 2 L/min was used and placed at the back of the classroom at a height of 1.2 m from the floor and 1 m from the windows, door and soft board as recommended by the Department of Safety and Health Malaysia [30]Industrial Code of Practice for Indoor Air Quality 2010 (ICOP 2010). For outdoor measurement, a portable beta-attenuation monitor with a flowrate of 16.7 L/min (E-BAM) was used to measure and filter the PM2.5 samples. Pre-calibration was conducted to determine the calibration factor of the two instruments in comparing the indoor and outdoor PM2.5 concentrations. The two instruments were simultaneously run at a distance of more than 1 m. Then, the calibration factor was determined for the two instruments by applying a regression analysis, and the value of k-factor was 0.33779.
PM2.5 samples were filtered by using a glass fibre filter paper with 47 mm diameter and 2.0 µm pore size (indoor) and a glass fibre filter tape with 2.0 µm pore size (outdoor). For the analysis of morphological properties, the filtered paper was cut into half for indoor, and the filtered paper was first cut with a paper puncher with a diameter of 12 mm for outdoor. Then, the filtered paper was cut into half similar to the filtered paper for indoor by using a disposable scalpel. The morphological properties of the samples were analysed through field-emission scanning electron microscopy (FESEM) coupled with energy dispersive X-ray spectroscopy QUANTA FEG 650, as shown in Fig. 3 [31].
(a) (b)
(c) (d)
Fig. 3 - Field-Emission Scanning Electron Microscopy QUANTA FEG 650 (a) samples of PM2.5
were allocated in the vacuum (b) Vacuum Quarta (c) Field-Emission Scanning Electron Microscopy QUANTA FEG 650 (d) Identification of shape for PM2.5
2.3
Statistical Analysis
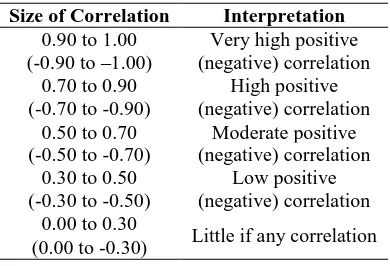
In this study, the indoor and outdoor PM2.5 concentrations and meteorological parameters (temperature, RH and wind speed) were continuously measured at 15 min intervals in which the particle samples are well filtered. All the data were arranged in a spreadsheet and statistically analysed using MS Excel 2007 and IBM Statistical Package for Social Science (SPSS Version 16.0, USA). Pearson’s correlation was performed by applying a bivariate correlation analysis, which is an important approach used to evaluate the relationship between the variables [32]-[34]. The relationship strength between indoor and outdoor PM2.5,temperature, RH and wind speed was determined based on Pearson’s correlation coefficient, which can be expressed in Eq. (1). The strength of relationship was referred to the Guildford’s
( )( )
( ) ( )
-
-2 2
-
-r
=
(1)
where: r = Pearson’s correlation coefficient, X = x variables, Y = y variables, X= sample mean for x variables and Y= sample mean for y variables
Table 2 - Correlation coefficient by Guildford’s Rule of Thumb
Size of Correlation Interpretation
0.90 to 1.00 Very high positive (-0.90 to –1.00) (negative) correlation
0.70 to 0.90 High positive (-0.70 to -0.90) (negative) correlation
0.50 to 0.70 Moderate positive (-0.50 to -0.70) (negative) correlation
0.30 to 0.50 Low positive (-0.30 to -0.50) (negative) correlation
0.00 to 0.30
Little if any correlation (0.00 to -0.30)
3.
Results and Discussion
3.1 Variations of PM
2.5, Temperature, Relative Humidity and Wind Speed for Indoor and
Outdoor in School
Table 3 and Table 4 show the variations of indoor and outdoor concentrations of PM2.5, temperature, RH and wind speed in schools A and B. The two schools experienced higher indoor PM2.5 concentrations than outdoor PM2.5 concentrations. In school A, the average indoor concentration was 58±11 µg/m3 and the average outdoor concentration was 32±10 µg/m3. In school B, the average PM
2.5 concentrations for indoor and outdoor were 71±22 and 36±9 µg/m3, respectively. For the average indoor concentration of PM2.5, schools A and B experienced high concentrations that exceed the 35 µg/m3 limit recommended by ASHRAE Standard 62.1-2010 [36]. The outdoor concentrations of PM
2.5 did not exceed the 50 µg/m3 limit of Malaysia Ambient Air Quality Standard-Interim 2 (MAAQS-IT-2). The temperature ranges were 27.3–30.9 °C for indoor school A and 24.5–33.3 °C for outdoor school A. Meanwhile, the indoor temperature range of school B was 29.1–33.0 °C, which exceeds the 23–26 °C and 25.0–35.2 °C indoor and outdoor temperature limits recommended by ICOP 2010, respectively. The RH in the two schools was within the range recommended by ICOP 2010 (40%–70%). The relative indoor and outdoor humidity of school A were 51%–71% and 39%–68%, respectively. The indoor and outdoor RH ranges for school B were 48%–51% and 48%–78%, respectively. Meanwhile, the average wind speed in all schools was within the limit of 0.15–0.50 m/s inside the classroom.
3.2 Influence of Outdoor PM
2.5and Meteorological Parameters on Indoor PM
2.5in School
Environment
The influence of outdoor concentrations on indoor concentrations was identified in the two schools. Pearson’s correlation analysis revealed a significant correlation between indoor and outdoor PM2.5 concentrations (p = 0.006; r = 0.542) in school A. In addition, indoor temperature (p = 0.001; r = −0.630) and RH (p = 0.001; r = 0.643) significantly influenced PM2.5 concentrations. Ambient PM2.5 in school A was significantly influenced by temperature (p = 0.000; r = −0.831), RH (p = 0.000; r = 0.859) and wind speed (p = 0.000; r = −0.873), as shown in Table 5. Pearson’s
correlation analysis also showed a significant correlation between the indoor and outdoor PM2.5 in school B (p = 0.001, r = 0.74). In addition, ambient temperature and RH significantly influenced the PM2.5 concentrations, where the p-values were 0.009 with r = 0.521 for temperature and PM2.5 and 0.008 with r = −0.528 for RH and PM2.5, as shown in
Table 6.
However, the relationship of ambient temperature, RH and wind speed with outdoor PM2.5 can be classified in the range of moderate to strong category. Meteorological parameters, such as temperature, RH and wind speed, act as important factors, which is similar to the findings of Tecer et al. [41], Tai et al. [42], Wang et al. [43] and Ching-Hui et al. [44].
Table 3 - Descriptive statistics of indoor PM2.5, temperature, relative humidity and wind speed
in schools A and B
School Descriptive Statistic
PM2.5
(µg/m3)
T (˚C)
RH (%)
WS (m/s)
A Max 80 30.9 71 0.6
Min 42 27.3 51 0.3 Avg 58 28.6 64 0.4
SD 11 1.3 7 0.1
B Max 116 33.0 51 0.6
Min 41 29.1 48 0.3 Avg 71 31.1 49 0.4
SD 22 1.3 1 0.1
Table 4 - Descriptive statistics of outdoor PM2.5, temperature, relative humidity and wind speed
in schools A and B
School Descriptive Statistic
PM2.5
(µg/m3)
T (˚C)
RH (%)
WS (m/s)
A Max 46 33.3 68 1.8
Min 21 24.5 39 0.7 Avg 32 28.0 56 1.1
SD 10 3.2 10 0.3
B Max 46 35.2 78 1.8
Min 23 25.0 48 0.5 Avg 36 29.4 65 1.0
SD 9 3.9 12 0.3
*Note: Max = Maximum, Min = Minimum, Avg = Average, SD = Standard Deviation, T = Temperature, RH = Relative humidity, WS = Wind speed
Table 5 - Pearson’s correlation between indoor and outdoor PM2.5, temperature, relative humidity
and wind speed inschool A
PM2.5 T RH WS
I O I O I O I O
a 1 0.54** 0.63** 0.65** 0.64
**
0.66 **
0.35 0.67 **
b 0.54** 1 0.73** 0.83** 0.76
**
0.85 **
0.49* 0.87**
Table 6 - Pearson’s correlation between indoor and outdoor PM2.5, temperature, relative humidity
and wind speed inschool B
PM2.5 T RH WS
I O I O I O I O
a 1 0.74** 0.08 0.09 0.12 0.08 0.12 0.37
b 0.74** 1 0.52** 0.52** 0.17 0.53
**
0.44 0.06
For Table 5 and Table 6:
3.3 Morphological Properties of Indoor and Outdoor PM
2.5for Indoor and Outdoor
Fig. 4(a) and Fig. 4(b) show the micrographs from high-resolution FESEM of fine particles from outdoor sources.
Fig. 4(a) shows the small clustered agglomerate soot, which are typical soot particles, that is carbon aggregates emitted from vehicles [31], [45]. Fig. 4(b) shows the cluster shape of particles from anthropogenic sources. Outdoor particles are mostly in spherical shape and have smooth surfaces produced from anthropogenic sources, such as combustion at high temperature [4]. Fig. 4 (c) and Fig. 4(d) show the flaky shape of particles identified from indoor samples, which is similar to the finding of Jan et al. [46].
Fig. 5 shows the micrograph for indoor and outdoor PM2.5 in school A. Fig. 5(a) shows the small clustered agglomerate soot mainly emitted from vehicle emissions [31], [45]. Fig. 5(a) shows the high-resolution FESEM micrograph with the percentage of each element of indoor particles. As shown in the pie chart in Fig. 5(a), the elements that exist in the particles are O, Si, Na, C, Ca, Mg and Al. The size range is O > Si > Na > C > Ca > Mg > Al for indoor particles in school A. Fig. 5(b) shows the outdoor particles with flaky shapes that are rich with oxygen, carbon and silica. In addition, other elements, such as Na, Al, K and Ca, are found. The trend of elements is O > C > Si > Na > Al > K > Ca.
Fig. 6(a) and Fig. 6(b) show the micrographs from high-resolution FESEM of fine particles from outdoor sources in school B. Fig. 6(a) shows the small clustered agglomerate soot, and Fig. 6(b) shows the irregular shape particles from outdoor sources. Fig. 6(c) shows the soot particles and Fig. 6(d) shows the flaky shape particles that are present inside the classroom. Fig. 7(a) shows the high-resolution FESEM micrograph with the percentage of each element of indoor particles that consist of elements, such as C, O, Na, Al and Si. The dominant element is in the order of C > O > Si >Na > Ca > Mg and Al. Fig. 7(b) shows the percentage of elements that consist the outdoor particles for school B, which is the order of O > Si > C> Na > Al.
The results on morphological properties of outdoor particles in schools A and B show the existence of soot particles and biological and irregularly shaped particles. Soot particles are usually obtained from incomplete combustion processes, such as vehicle emissions with diesel engines, gas burners, coal-fired power plants, domestic heating and biomass burning [47]-[50]. Biological shape particles are usually obtained from biological sources, such as trees and flowers for landscape purposes near the school area [31]. The morphological properties of indoor particles in schools A and B consist of soot particles and irregularly shaped particles. The indoor morphological properties of school B show that soot particles also exist inside the classrooms similar to outdoor particles. This condition shows the influence of outdoor sources on the indoor concentrations in school B [45].
(a) outdoor (b) outdoor
(c) indoor (d) indoor
(a) (b)
Fig. 5 - High resolution of FESEM micrographs with percentage of each element in for (a) indoor and (b) outdoor in school A
(a) outdoor (b)outdoor
(c) indoor (d) indoor
Fig. 6 - High resolution of FESEM of outdoor and indoor in school B. 6 (a) soot particles (b) irregular shape for outdoor and 6 (c) soot particles (d) irregular shape of indoor particles in school B.T
(a) indoor (b) outdoor
4.
Conclusion
The concentrations of outdoor and indoor PM2.5 varied. The indoor concentration was contributed by outdoor sources. Then, the trapped and resuspended concentrations were due to students’ activities. Pearson’s correlation analysis revealed a significant correlation between indoor and outdoor PM2.5 in schools A and B. This finding is also supported by a similar type of particles (i.e. soot particles) for indoors and outdoors in school B. The morphological characteristics were also identified for indoor and outdoor PM2.5 in schools A and B, which are soot, irregularly shaped and biological particles. The dominant elements are O and C for indoor and outdoor particles in both schools. In addition, ambient temperature, RH and wind speed are the important factors that influence the outdoor PM2.5 concentrations in schools
Acknowledgement
The authors would like to acknowledge the Ministry of Higher Education for financial support of this study through research grant 203/PAWAM/6071360.
References
[1] U.S Environmental Protection Agency (2009). Integrated science assessment for particulate matter. Washington: EPA/600/R-18/179.
[2] World Health Organization (2005). Air quality guideline – global update. Copenhagen: WHO Regional Office for Europe.
[3] Fromme, H., Diemer J., Dietrich S., Cyrys J., Heinrich J., Lang, W., Kiranoglu, M. and Twardella, D. (2008), Chemical and morphological properties of particulate matter (PM10, PM2.5) in school classrooms and outdoor air. Atmospheric. Environment, 42, 6507-6605
[4] Martin, L. D., Martins, J. A., Freitas, E. D., Mazzoli, C. R., Goncalves, F. L. T., Ynoue, R. Y., Hallak, R., Albuquerque, T. T. A. and de Andrade, M. F. (2010). Potential health impact of ultrafine particles under clean and polluted urban atmospheric condition: a model-based study. Air Quality, Atmospheric and Health, 3, 29-39. [5] Haverinen-Shaughnessy, U., Moschandreas, D. J. and Shaughnessy, R. J. (2011). Association between substandard
classroom ventilation rates and students’ academic achievement. Indoor Air, 21, 121-131.
[6] Sundell, J., Levin, H., Nazaroff, W. W., Cain, W. S., Fisk, W. J., Grimsrud, D. T., Gyntelberg, F., Li, Y., Persily, A. K., Pickering, A. C., Samet, J. M., Spengler, J. D., Taylor, S. T. and Weschler, C. J. (2011). Ventilation rates and health: Multidisciplinary review of the scientific literature. Indoor Air, 21, 191-204.
[7] Massey, D., Klushrestha, A., Masih, J. and Taneja, A. (2012). Seasonal trends of PM10, PM5.0, PM2.5 & PM1.0 in indoor and outdoor environment of residential homes located in North-Central India. Built Environment, 47, 223-231
[8] Robinson, J. and Nelson, W. (1995). Particles in our air: Concentrations and health effect. National human activity pattern survey data base. North Carolina: USEPA.
[9] Ali, H. H., Almomani, H. M. and Hindeih, M. (2009). Evaluating indoor environmental quality of public-school buildings in Jordan. Indoor Built Environment, 18, 66-76.
[10]Du, L., Batterman, S., Parker, E., Godwin, C., Chin, J. Y., O’Toole, A., Robins, T., Brakefield-Caldwell, W. and Lewis,T. (2011). Particle concentrations and effectiveness of free-standing air-filters in bedrooms of children with asthma in Derroit, Michigan. Built Environment, 46, 2303-2313.
[11]Fromme, H., Twardella, D., Dietrich, S., Heitmann D., Schierl R., Liebl, B. and Ruden, H. (2007). Particulate matter in the indoor air of classrooms-exploratory results from Munich and surrounding area. Atmospheric Environment, 45, 854-866.
[12]Franck, U., Herbath, O., Roder, S., Schlink, U., Borte, M., Diez, U., Krämer, U. and Lehman, L. (2011). Respiratory effects of indoor particles in young children are size dependent. Science of the Total Environment, 409, 121-131.
[13]Annesi-Maesano, I., Hulin, M., Lavaud, C., Raherison, C., Kopferschmitt, C., Blay, F. D., Charpin, D. A. and Denis, C. (2012). Poor air quality in classrooms related to asthma and rhinitis in primary schoolchildren of the French 6 cities study. Thorax 67, 682-688.
[14]Raysoni, A. U., Stock, T. H., Sarnat, A. J., Sosa, T. M., Sarnat, S. E., Holguin, F., Greenwald, R., Johnson, B. and Wen-Whai, L. (2013). Characterization of traffic-related air pollutant metrics at four schools in El Paso, Texas, USA: Implications for exposure assessment and sitingschools in urban areas. Atmospheric Environment 80, 140-151.
[16]Yang Razali, N. Y., Latif, M. T., Dominick, D., Mohamad, N., Sulaiman, F. R. and Srithawat, T. (2015). Concentration of particulate matter, CO, and CO2 in selected schools in Malaysia. Building and Environment87, 108-116.
[17]Stabile, L., Dell’Isola, M., Frattolillo, A., Massimo, A. and Russi, A. (2016). Effect of natural ventilation and manual airing on indoor air quality in naturally ventilated Italian classrooms. Build and Environment, 98, 180-189. [18]Mendell, M. J., Heath, G. A. (2005). Do indoor pollutants and thermal conditions in schools influence students’
performance? A critical review of the literature. Indoor Air ,15, 27-52.
[19]Tippayawong, N., Khuntong, P., Nitawichit, C., Khunatorn, Y. and Tankakitti, C. (2009). Indoor outdoor relationships of size-resolved particle concentrations in naturally ventilated school environments. Built Environment, 44, 188-197.
[20]Buananno, G., Giovinco, G., Morawska, L. and Stabile, L. (2015). Lung cancer risk of airborne particles for Italian population. Environmental Research,142, 443-451.
[21]Rivas, I., Viana, T., Moreno, T., Bouso, L., Pandolfi, M., Alvarez – Pedrerol, M., Forns, J., Alastuey, A. and Sunyer, J. (2015). Outdoor infiltration and indoor contribution of UFP and BC, OC, secondary inorganic ions and metals in PM2.5 in schools. Atmospheric Environment, 106, 129-138.
[22]Trassierra, C. V., Stabile, L., Cardellini, F., Morawska, L. and Buonanno, G. (2016). Effect of indoor-generated airborne particles on radon progeny dynamics. Journal of Hazardous Materials, 314, 155-163.
[23]Department of Statistics Malaysia (2018). Population and Demographic: Demographic Statistic First Quarter (Q1), 2018, Malaysia. Retrieved on May 8, 2018 from https://www.dosm.gov.my
[24]Branis, M., Rezacova, P. and Domasová, M. (2005). The effect of outdoor air and indoor human activity on mass concentrations of PM10, PM2.5, and PM1 in a classroom. Environmental Research, 99, 143-149.
[25]Morawska, L., Afshari, A., Bae, G. N., Buonanno, G., Chao, C. Y., Hänninen, O., Hofmann, W., Isaxon, C., Jayaratne, E. R., Pasanen, P., Salthammer, T., Waring, M. and Wierzbicka, A. (2013). Indoor aerosols: From personal exposure to risk assessment. Indoor Air, 23, 462-487.
[26]Latif, M. T., Yong, S. M., Saad, A., Mohamad, N., Baharudin, N. H., Mokhtar, M. B. and Tahir, N. M. (2014). Composition of heavy metals in indoor dust and their possible exposure: a case study of preschool children in Malaysia. Air Qual Atmosphere Health, 7,181-193.
[27]Agrawal, M., Singh, B., Rajput, M., Marshall, F. and Bell, J. N. B. (2003). Effect of air pollution on peri-urban agriculture: a case study. Environmental Pollution, 126, 323-329.
[28]Gadkan, N., Pervez, S. (2008). Source apportionment of personal exposure of fine particulates among school communities in India. Environmental Monitoring Assessment, 142, 227-241.
[29] Ministry of Works Malaysia (2018). Malaysian Roads: General Information. Retrieved on August 27, 2018 from http://www.kkr.gov.my/ms/node/33388
[30]Department of Safety and Health (2010). Industrial code of practice for indoor air quality. Malaysia: JKKP DP(S) 127/379/4-39.
[31]Zaki, T. N. M., Yusof, N. M., Shith, S. (2016). Morphology analysis of fine particles in background station of Malaysia. Sustainability in Environment, 1, 12-24.
[32]Elbayoumi, M., Ramli, N. A., Yusof, N. M., Yahya, A. S., Al Madhoun, W., Ul-Saufie, A. Z. (2014). Multivariate methods for indoor PM10 and PM2.5 modelling in naturally ventilated school buildings. Atmospheric Environment 94, 11-21.
[33]Barraza, F., Jorquera, H., Valdivia, G., Montoya, L. D. (2014). Indoor PM2.5 in Santiago, Chile spring 2012: Source apportionment and outdoor contributions. Atmospheric Environment, 94, 692-700.
[34]Yang, L., Haifeng, W., Shanshan, W., Lei, Z. and Qi, Z. (2017). The correlation between indoor and outdoor particulate matter of different building types in Daqing, China. Procedia Engineering 205, 360-3677.
[35]Guildford, J. P. and Frutcher, B. (1973). Fundamental Statistics in Psychology and Education (5th Edition). New York: McGraw-Hill.
[36]American Society of Heating, Refrigerating and Air-Conditioning Engineers (2010). Ventilation for acceptable indoor air. ASHRAE/ANSI Standard 62.1-2010. Atlanta, pp 28-49.
[37]Guo, H., Morawska, L., He, C., Zhang, Y. L., Ayoko, G. and Cao, M. (2010). Characterization of particle number concentrations and PM2.5 in a school: Influence of outdoor air pollution on indoor air. Environmental Science Pollution Research,17, 1268-1278.
[38]Mohammadyan, M., Alizadeh-Larimi, A., Etemadinejad, S., Latif, M. T., Heibati, B., Yetilmezsoy, K., Abdul-Wahab, S. A. and Dadvand, P. (2017). Particulate air pollution at schools: Indoor – outdoor relationships and determinants of indoor concentrations. Aerosol and Air Quality Research, 17, 857-864.
[39]Hassanvand, M. S., Naddafi, K., Faridi, S., Arhami, M., Nabizadeh, R., Sowlat, M. H., Pourpak, Z., Rastkari, N., Momeniha, F., Kashani, H., Gholampour, A., Nazmara, S., Alimohammadi, M., Goudarzi, G. and Yunesian, M. (2014). Indoor/outdoor relationships of PM10, PM2.5, and PM1 mass concentrations and their water-soluble ions in a retirement home and a school dormitory. Atmospheric Environment, 82, 375-382.
[41]Tecer, L. H., Süren, P., Alagha, O., Karaca, F. and Tuncel, G. (2008). Effects of meteorological parameters on fine and coarse particulate matter mass concentration in a coal-mining area in Zonguldak, Turkey. Journal of the Air and Waste Management Association, 58, 534-552.
[42]Tai, A. P. K., Loretta, J. and Jacob, D. J. (2010). Correlations between fine particulate matter (PM2.5) and meteorological variables in the United States: Implications for the sensitivity of PM2.5 to climate change. Atmospheric Environment, 44, 3976-3984.
[43]Wang, J. and Ogawa, S. (2015). Effects of meteorological conditions on PM2.5 concentrations in Nagasaki, Japan. International Journal of Environmental Research and Public Health, 12, 9089-9101.
[44]Ching-Hui, H., Heng-Cheng, L., Chen-Doa, T., Hung-Kai, H., Ie-Bin, L. and Chia-Chu, C. (2017). The interaction effects of meteorological factors and air pollution on the development of acute coronary syndrome. Scientific reports, Nature 7, 44004.
[45]Chitra, V. S. and Nagendra, S. M. S. (2012). Indoor air quality investigations in a naturally ventilated school building located close to an urban roadway in Chennai, India. Building and Environment, 54, 159-167.
[46]Jan, R., Roy, R., Yadav, S., Satsangi, P. G. (2017). Exposure assessment of children to particulate matter and gaseous species in school environments of Pune, India. Building and Environments, 111, 207-217.
[47]Maskey, S., Hoseung, C., Kwangyul, L., Nguyen, P. D., Khoi, T. T. (2016). Morphological and elemental properties of urban aerosols among PM events and different traffic systems. Journal of Hazardous Materials, 317, 108-118.
[48]Adachi, K. and Buseck, P. (2008). Internally mixed soot sulfates, and organic matter in aerosol particles from Mexico City. Atmospheric Chemistry and Physics, 8, 6469-6481.
[49]Chen, Y., Shah, N., Huggins, F. F., Huffman, G. P. (2005). Electron microscopy investigation of carbonaceous particulate matter generated by combustion of fossil fuels. Energy Fuels, 19, 1644-1651.