ABSTRACT
Manuscript type: Research paper.
Research aims: The objectives of this research are to study the accounting practices of investment property (IP) for the subsequent measurement, to investigate and compare the value relevance of the IP under the fair value model and cost model and to examine the factors affecting the accounting choices of the IP of firms listed on the Stock Exchange of Thailand.
Design/ Methodology/ Approach: The regression models used in this research are based on the works of Ohlson (1995) and Feltham and Ohlson (1995) which linked the accounting information of firms with stock prices. The models are applied to test and compare the value relevance of the IP under the fair value model and cost model for the years 2011-2012.
Research findings: The findings indicate that the number of Thai listed firms choosing the cost model for the subsequent measurement of the IP is considerably higher than those choosing the fair value model. The results also show that the IP is value relevant information in 2012 and in the two years’ analysis combined (2011-2012) but not in 2011. This paper reveals that the cost model of the IP is more significantly value relevant than the fair value model and that the
Accounting Practices and
Value Relevance of Investment Property:
Evidence from Firms Listed on
the Stock Exchange of Thailand
Kittima Acaranupong*
accounting choices of the IP are significantly affected by profitability and size.
Theoretical contribution/ Originality: This paper suggests that the accounting information of the IP is useful for valuing securities in the Thai stock market. The outcome also supports the bonus plan hypothesis under the Positive Accounting Theory (PAT) where higher earnings firms would predominantly use the cost model for the IP. It is further noted that larger firms in Thailand are more likely to use the fair value model for the IP, thereby supporting the size hypothesis.
Practitioner/ Policy implication: The outcome drawn from this paper provides information to the Federation of Accounting Professions (FAP) in Thailand when deliberating on the revision of the accounting standards related to fair value measurements. The FAP may consider taking steps to increase the reliability of fair value so as to encourage firms to select the fair value model for use. The results can also act as a catalyst for the Securities and Exchange Commission (SEC) such that when issuing the regulation on fair value disclosures, transparency and the reliability of financial statements are further increased.
Research limitation/ Implication: This paper examines the value relevance of only recognised IPs in the Statements of Financial Position. Future studies therefore, may need to investigate the relative value relevance of fair value disclosures in the notes to financial statements compared with the recognised fair value amounts of investment properties.
Keywords: Accounting Practices, Investment Property, Value Relevance JEL Classification: M41, G14
1. Introduction
accounting standards of other countries such as the member countries in the Association of Southeast Asian Nations (ASEAN) also began to converge their practices with the IAS/IFRS (Ibarra & Suez-Sales, 2011; Hla & Isa, 2015). In this regard, it can be said that the evidence drawn from Thailand’s condition will also serve some implications for other ASEAN countries. The main impact of adopting the IAS/IFRS by firms is that many types of assets and liabilities will be stated at fair values and this reflects the firms’ true financial position. Therefore, when used, the application of the IAS/IFRS will enhance the qualitative characteristics of the accounting information in terms of relevance (Barth, Landsman, & Lang, 2008).
The TAS 40 (Revised 2009) Investment Property is important for accountants, auditors and financial statement users in this regard because it will be the first time which the Federation of Accounting Professions (FAP) of Thailand had introduced a fair value accounting model for investment properties. The TAS 40 (Revised 2009) is mandated to be applied in financial statements beginning on or after 1 January 2011. Prior to 2011, investment properties were recognised as property, plant and equipment (PPE) in the Statement of Financial Position. A gain or loss due to a change in the fair value of the IP is considered as a new accounting item in the Income Statement. Further, the TAS 40 also allows firms to choose either the fair value model or the cost model for valuing their IPs, after the initial recognition is made. These accounting choices will make the comparability of the financial statements more difficult for financial statement users because the earnings of fair value model firms will include the gain or loss due to a change in the fair value of the IP while the cost model does not. Therefore, the earnings of these firms would be more volatile than those of the cost model firms. In addition, there are major differences noted among Thai listed firms in how they value their IPs which form a significant portion of the firms’ total assets.
Stock Exchange of Thailand in selecting the fair value model and the cost model of their IPs.
Prior studies (Lourenco & Curto, 2008; Pappu & Devi, 2011) in other countries found conflicting evidence about the effect of using fair value model in valuing assets. Pappu and Devi (2011), for instance, observed that the cost model of the IP is more relevant than the fair value model. However, Lourenco and Curto (2008) revealed that investors tend to distinguish the recognised cost, the recognised fair value and the disclosed fair value of the IP in listed firms in France, Germany, Sweden and the U.K. Based on this, Herrmann, Saudagaran, and Thomas (2006) concluded that the fair values of the property, plant and equipment (PPE) are more relevant for decision makers.
The adoption of the TAS 40 (Revised 2009) by Thailand provides researchers with the opportunity to examine whether valuing firms’ IPs through the fair value model or the cost model, can affect the value relevance of the IPs concerned. Therefore, the findings of this research will be able to provide evidence that can demonstrate whether the adoption of the IFRS (which predominantly uses the fair value model) would give more value relevant information when compared with the cost model. If the results of this research proved that the fair value model of the IP increases the value relevance of the IP when compared to that of the cost model, then it can be deduced that managers should select the fair value model for measurement. This is because adopting this accounting standard can enhance the ability of users to predict future stock prices. The current research is important because it is expected to provide the policy direction to the FAP as well as the regulatory bodies of Thailand with regard to fair value measurement and disclosure. This research also has managerial implications on decision makers who select the fair value model or the cost model for the subsequent measurements of the IPs.
The organisation of this paper will be as follows. Section 2 reviews prior literature. Section 3 explains the research methodology. Section 4 discusses the empirical results and Section 5 concludes the paper by providing some discussion and implications.
2. Literature Review
2.1 Accounting Practices of Investment Property in Thailand1
Prior to 2011, none of the TAS and TFRS requirements had indicated any specific accounting practices for investment property (IP). At that time, investment properties were included under property, plant and equipment (PPE). Therefore, the accounting practices of the IP then were the same as those practiced for the PPE. Following the TAS 16 Property, Plant and Equipment, the main measurement principle of the IPs was the cost model. Nonetheless, a firm can revalue its IP after an initial recognition. For example, if the IP’s carrying amount was increased as a result of the revaluation, the increase should be recognised in another comprehensive income and accumulated in equity, under the heading of revaluation surplus. However, the FAP in Thailand had issued the TAS 40 (Revised 2009) Investment Property which requires all firms to apply, beginning on or after 1 January, 2011. This standard is consistent with the IAS 40 (Bound Volume 2009) without any significant differences. The main content of the TAS 40 (Revised 2009) requirement is summarised as follows.
Investment property is property (land or a building – or part of a building – or both) held by the owner or the lessee under a financial lease to earn rentals or for capital appreciation or both, rather than for (a) use in the production or supply of goods or services or administrative purposes; or (b) sales in the ordinary course of business.
After the initial recognition, a firm shall select, as its accounting policy, either the fair value model or the cost model. A firm shall apply that policy to all of its IPs. The TAS 40 (Revised 2009) requirement permits firms to choose either the fair value model or the cost model for application. In the fair value model, the IP is measured after the initial recognition, at a fair value. A gain or loss arising from a change in the fair value of the IP shall be recognised as a profit or loss for the period in which it arises. In the cost model application, the firm should measure all of its IPs in accordance with the TAS 16 Property, Plant and Equipment except for those that meet the criteria to be classified as held for sale, which is in accordance with the TFRS 5 – Non-current Assets Held for Sale and Discontinued Operations. The cost model, as specified in the TAS 16, requires an IP to be measured after the initial recognition,
at a depreciated cost (less any accumulated impairment losses). A firm that chooses the cost model for the recognition of the IP in the Statement of Financial Position should disclose the fair value of its IPs in its note to financial statement.
2.2 Theories Related to the Research
2.2.1 Efficient Market Hypothesis (EMH)
The Efficient Market Hypothesis (EMH) assumes that all available infor-mation is fully reflected in the stock prices at any point of time (Malkiel & Fama, 1970; Fama, 1991). The EMH uses the information set to test the level of efficient markets (Watts & Zimmerman, 1986). Under the EMH, the accounting numbers in the financial statements can be used to determine whether they can convey useful information to the investors in the stock market (value relevance test) or not. If the accounting information is useful for valuing the market values of the equities, then the accounting information is significantly related to the stock prices. Based on this, it can be inferred that the accounting information is value relevant (e.g., Francis & Schipper, 1999; Landsman, 2007).
Guidi and Gupta (2011) examined the EMH for selected ASEAN stock markets from January 2000 until April 2011. From their findings, they concluded that the stock market in Thailand is weak form efficient. In another study, Munir, Ching, Furouka, and Mansur (2012) tested the EMH of selected Asian countries from 1990 until 2009. Their findings are consistent with Guidi and Gupta (2011) thereby, supporting that the stock prices in Thailand which are in the non-stationary process is compatible with the weak form of the EMH. In another study, Yu, Nartea, Gan, and Yao (2013) investigated the predictive ability and profitability of two trading rules: the moving average (MA) and the trading range breakout (TRB) for five selected members of the ASEAN countries. Their results suggested that the average return generated by each trading signal decreased dramatically over the study period for Malaysia and Thailand. This implies that these markets have informational efficiency over the years.
to Market (B/M Anomaly) cannot be used to predict future security returns. Thus, they concluded that the Thai stock market is semi-strong form efficient.
2.2.2 Positive Accounting Theory (PAT)
The Positive Accounting Theory (PAT) is used to investigate the deter-minants affecting the accounting choices. Watts and Zimmerman (1986) described three main hypotheses about the manager’s accounting choices: the bonus plan hypothesis, the debt/equity hypothesis and the size (political cost) hypothesis.
The bonus plan hypothesis: Ceteris paribus, managers of firms with
bonus plans are more likely to choose accounting procedures that shift the reported earnings from future periods to the current period. Under the bonus plan hypothesis, the managers’ compensation depends on the firms’ earnings. The bonus gives the managers’ incentives for selecting the accounting policies which increase or decrease the earnings. The incentives also depend on whether the earnings are below the target, between the target and upper bound, or above upper bound. If the current earnings are above upper bound, the managers have the incentive to use the accounting procedures to reduce and defer the current earnings. If the current earnings are between the target and upper bound, the managers have the incentives to select the accounting methods which enable the current earnings to increase to upper bound. Managers of firms where the bonus plans are linked to the firms’ earnings are more likely to choose the income increasing strategy (see, Aitken & Loftus, 1994). However, if the current earnings are far below the target and the loss of bonus is highly possible, the managers have the incentives to use the accounting choices for decreasing the current earnings so that future earnings are expected to increase. This is called the “Big Bath” behaviour.
The debt/equity hypothesis: Ceteris paribus, the larger the firms’
more likely to increase earnings to avoid the breach of debt covenant which concurs with the debt/equity hypothesis (see, Daley & Vigeland, 1983; Dhaliwal, Heninger & Hughes II, 1999).
The size (political cost) hypothesis: Ceteris paribus, the larger the
firms, the more likely the managers will choose the accounting pro-cedures that defer the reported earnings from the current period to future periods. The size (political cost) hypothesis predicts that larger firms are more likely to choose the accounting choices that reduce current earnings. Size is a measure for political attention. It is costly for firms to become informed about whether accounting earnings really represent the monopoly profits and to contract with others in the political process to enact laws and regulations that can improve their wealth. Moreover, size as a measure of the political cost, is negatively related to the income increasing strategy (see, Skinner, 1993; Dhaliwal et al., 1999). This means that smaller firms tend to use the income increasing strategy while larger firms tend to use the income decreasing technique.
2.3 Prior Research and Development of Research Hypotheses
2.3.1 Accounting Choices and Factors Affecting the Accounting Choices of Investment Property
the fair value model for their IPs because of the countries’ conservative approach and their lack of incentives to use the fair value measurement (Cairns et al., 2011). It appears that only 23 per cent of firms in Germany select the fair value model for their IP valuations (Christensen & Nikolaev, 2013) while only 23.3 per cent of firms in Nigeria endorse the fair value model for their IPs (Isa, 2014). This can be attributed to the lack of reliability for the fair value model. Laux and Luez (2009) indicated that the fair value accounting practices tend to carry implication problems and other litigation risks. Likewise, Nellessen and Zuelch (2011) also observed that the net asset value tend to depart from the market capitalisations of the European properties’ firms. They indicated that the deviation is a result of the fair value model’s inadequate reliability which is caused by the limitation of appraisals and the diversity of applied approaches. Comparatively, some previous studies noted some contradicting results. For instance, Dietrich, Harris, and Muller III (2001) investigated the reliability of the mandatory annual fair value estimates for the U.K. investment property. They found that the appraisal estimates have understated the actual selling prices which are considerably less bias and carry more accurate measures of the selling prices than the historical cost model.
Previous studies (Aitken & Loftus, 1994; Demaria & Dufour, 2007) have also examined the determinants of the accounting choices between the fair value model and the cost model of the IPs. Aitken and Loftus (1994) noted that the compensation or bonus plan is a determinant of the accounting choices of the IP. However, Demaria and Dufour (2007) found that there is no relationship between the compensation plan and the fair value option of the IP.
and Tower (2006) and Israeli (2015). According to Astami and Tower (2006), lower financial leverage firms tended to pursue the income increasing strategy of the PPE. Likewise, the results drawn from Israeli’s (2015) study showed that firms with higher leverage have a greater prob-ability of adopting the fair values of the IP. Other studies (e.g., Aitken & Loftus, 1994; Demaria & Dufour, 2007; Quagli & Avallone, 2010; Waweru, Ntui, & Mangena, 2011; Taplin et al. 2014; Isa, 2014) found that the level of the debt does not affect the accounting choices of the IPs.
Besides leverage, size is also a likely factor to influence the accounting choices of the IPs. Previous studies (Demaria & Dufour, 2007; Quagli & Avallone, 2010; Waweru et al., 2011; Taplin et al. 2014; Isa, 2014) showed different results regarding the size factor. In her study, Isa (2014) defined the fair value model of the IP as an income decreasing strategy and the cost model of the IP as an income increasing strategy. Isa (2014) found that larger firms tend to use the fair value model for their IPs as an income decreasing strategy, thereby, supporting the size (political cost) hypothesis of the Positive Accounting Theory. Quagli and Avallone (2010), Waweru et al. (2011) and Taplin et al. (2014) however, noted that larger firms are more likely to adopt the income increasing strategy by using the cost model of the IPs. Other studies (Aitken & Loftus, 1994; Astami & Tower, 2006; Demaria & Dufour, 2007) revealed an insignificant relationship between firm size and the accounting policy choices of the IPs.
The contradicting results of the determinants affecting the account-ing choices of IPs can be explained by the different samples used for
Table 1: Relationship between Positive Accounting Theory (PAT) and Accounting Choices of Investment Property
Positive Accounting Theory Accounting Choices of Strategy Investment Property*
Bonus plan hypothesis Cost model Income increasing strategy Debt/equity hypothesis Cost model Income increasing strategy Size (Political cost) hypothesis Fair value model Income decreasing strategy Note: * Waweru et al. (2011) and Isa (2014) defined the cost model of IP as income
examination, the variations in the research methodologies employed as well as the different accounting choices being examined. Based on the Positive Accounting Theory (PAT) (see details in section 2.2.2) and the related literature review, the relationship between the PAT and the accounting choices of the IPs is further summarised in Table 1.
2.3.2 Value Relevance of Investment Property
The value relevance of the IP has been investigated in many countries such as New Zealand (Owusu-Ansah & Yeoh, 2006), Hong Kong (So & Smith, 2009), Portugal (Selas, 2009), Malaysia (Pappu & Devi, 2011; Ishak, Saringat, Ibrahim, & Wahab, 2012; Zi, Hassan, & Embong, 2014) and other European countries (Lourenco & Curto, 2008; Israeli, 2015; Muller, Riedl, & Sellhorn, 2015). The results of these studies, however, are not consistent. It appears that the unrealised gains on the investment properties in New Zealand (NZ) are not significantly different from the recognition of the unrealised gains in the revaluation reserves in terms of their value relevance (Owusu-Ansah & Yeoh, 2006). Nonetheless, So and Smith (2009) found otherwise. Examining the value relevance of the revisions made in Hong Kong Accounting Standard (HKKS) 40 (Revised 2004) Investment Property, the researchers found a significantly higher market price reaction and returns when changes in the fair values of the IPs are presented in the Income Statements. Consistent with the findings of So and Smith (2009), the outcome noted by Selas (2009) also implied that the fair value of the IP for Portuguese listed firms have value relevance, even in firms where the investment properties are not considered as the core business.
Pappu and Devi (2011) investigated the value relevance of the IP under the IAS 40 in the context of Malaysia. They found that the IP is significantly related to the market value of equity. Zi et al. (2014) studied the value relevance of the IP in the Malaysian Real Estate Investment Trusts. They revealed that the fair values of the IP in the Balance Sheet are significantly related to the share prices while the changes in the fair values presented in the income statements are not significantly related to the share prices. In contrast, Ishak et al. (2012) provided evidence which showed that there is an insignificant association between the fair values of the IP and the share prices.
Sweden and the U.K. They found that the IPs recognised at cost or fair values are value relevant. Similarly, Israeli’s (2015) investigation on the value relevance of the IPs which either recognised fair values or disclosed fair values of firms in the European Union showed that the IPs are value relevant. Consistent with the findings in Lourenco and Curto (2008) and Israeli (2015), Muller et al.’s (2015) study also indicated that the fair values of the IPs stated in the Statement of Financial Position or the disclosed fair values in the notes to financial statements are related to the market value of equity.
2.3.3 Comparative Value Relevance of Investment Property Between the Fair Value Model and the Cost Model
equity when compared with the recognised fair values of IP firms. In other words, investors place a smaller valuation weight on the disclosed IP amounts in the notes to financial statements relative to the recog-nition of the IP amounts stated in the financial statements. The smaller valuation of the disclosed fair values of the IP is removed by the lower information processing cost and the higher reliability of the fair values.
2.3.4 Development of Research Hypotheses
No previous research has examined the value relevance of the IP in Thailand. Based on the findings of previous studies (see details in section 2.3.2 above), the IP is expected to be value relevant information after the TAS 40 (Revised 2009) was adopted. Based on this, the first hypothesis set in terms of the alternative hypothesis is stated as follows:
H1: Investment property is significantly related to stock price.
From what has been discussed above, it seems clear that there are supporting and contradictory evidence about the comparative value relevance of fair value model and the cost model of the IP (see details in section 2.3.3 above). Due to this discrepancy, this paper is unable to predict whether the fair value model is more value relevant than the cost model of the IP or vice versa. Therefore, the second hypothesis set in terms of the alternative hypothesis is stated as follows:
H2: There is a difference in the value relevance between the fair
value model and the cost model of investment property.
3. Research methodology
3.1 Sample Selection and Data Collection
only 5 per cent of non-December year-ending firms, their exclusion from the sample data will not affect the findings of the current research.
This research uses the stock price as of 31 March of the following year-ending because Thai listed firms need to send their yearly financial statements to the Securities and Exchange Commission (SEC) within three months after the fiscal year ended. Thus, the available accounting information disclosed will be reflected in the stock prices as of 31 March. The sample firms were not listed on the Rehabilitation Sector or the Non-performing Groups (NPG). The firms listed on the Stock Exchange of Thailand (SET) as of 30 May 2013 composed of seven industries and 23 sectors. The total number of firms listed was 401 excluding firms with negative book values of equities. The period of study is the year 2011 and 2012. This research uses accounting data from the year 2011 ending 2012 and the reasons are as follows: (1) TAS 40 (Revised 2009) requires the IP to be separated from the PPE as a new accounting item in the Statement of Financial Position since the year 2011; and (2) the FAP had revised 18 Thai Accounting Standards and Thai Financial Reporting Standards and 15 Thai Standing Interpretations and Thai Financial Reporting Interpretations in 2012 and their draft forms were issued in 2013.
As a result of these changes noted in the accounting standards, the value relevance of the accounting information may be affected (Barth et al., 2008). This is also attributed to the fact that all the accounting information between 2011 and 2012 was prepared under the same revised version of the accounting standards (TAS/TFRS: Revised 2009) including the TAS 40 (Revised 2009). Even though the FAP has revised the TAS 40 Investment Property in 2014 which becomes effective on or after 1 January 2015, the TAS 40 (Revised 2014) requirement has changed the definition and measurement of the fair values of investment properties according to the introduction of the TFRS 13 Fair Value Measurement. Nonetheless, the fair values of investment properties are determined by the external and independent appraisers for both the TAS 40 (Revised 2009) and the TAS 40 (Revised 2014). In this regard, the findings of this paper are still relevant as the differences between the TAS 40 (Revised 2009) and the TAS 40 (Revised 2014) are minor.
Exchange of Thailand. The samples collected amounted to 345 firms. A detailed information of these sample firms is summarised in Table 2. Table 2: Sample Characteristics
Sample Characteristics Number of Firms
Number of listed companies on SET 401
Less Non-December year-ending firms* 21
Negative book value of equities 7
Missing data** 22
Outlier data*** 6
Total 345 Notes: * See explanation in section 3.1 Sample selection and data collection.
** Missing data may occur because some firms enter the rehabilitation plan (or classified as the non-performing groups: NPG). Therefore, stock price data of these firms are unavailable. In addition, some firms are delisted from the stock exchange during the years of study. Further, some firms are newly listed firms in year 2012, thus there are no financial statements covering throughout the years of study.
*** Outlier data are excluded from the sample because their values are extreme approximately +/-1%.
Table 3: The Number of Investment Property Firms and Non-Investment Property Firms
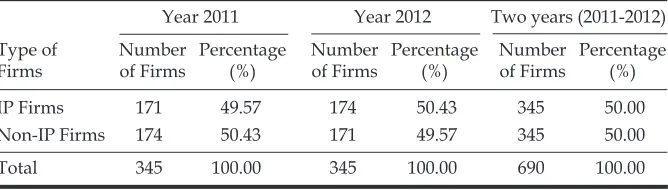
Year 2011 Year 2012 Two years (2011-2012) Type of Number Percentage Number Percentage Number Percentage Firms of Firms (%) of Firms (%) of Firms (%)
IP Firms 171 49.57 174 50.43 345 50.00
Non-IP Firms 174 50.43 171 49.57 345 50.00
Total 345 100.00 345 100.00 690 100.00
Note: * The classification of investment property firms (IP firms) and non-investment property firms (Non-IP firms) is based on the presentation of investment property in Statement of Financial Position.
Table 3 highlights the number of IP firms in 2011 and 2012 to be 171 firms (49.57 per cent of total samples) and 174 firms (50.43 per cent of total samples), respectively. The final sample extracted for the purpose of this research thus focused on the IP firms only (firms which presented their IPs in the Statements of Financial Position). Overall, these samples comprise a total of 345 years (171 years in 2011 and 174 firm-years in 2012). Further to that, the classification also shows that most of the IP firms are in the Property and Construction industry while the least number of IP firms are from the Technology industry.
3.2 Research Model and Research Methodology
3.2.1 Testing the Value Relevance of Investment Property
As mentioned before, the current research aims to investigate the value relevance of the IP of public listed firms in Thailand by developing the research models that are based on the works of Ohlson (1995) and Feltham and Ohlson (1995). Model (1) and model (2) were used to test the first hypothesis and they are set as follows:
Pit = a0 + a1EPSit + a2BVEIPit + a3IPit + it (1)
Pit = a0 + a1EPSit + a2BVEIPit + a3IPit + a4SIZEit + a5LEVit + (2)
a6GROWTHit + it
Pit = stock price of firm i year t as of the three months
after the fiscal year-ended;
EPSit = earnings per share of firm i year t;
BVEIPit = book value of equity per share (exclude the
invest-ment property) of firm i year t;
IPit = investment property per share of firm i year t;
SIZEit = size of firm i year t (measured by log of total assets);
LEVit = leverage of firm i year t (measured by total debt to
total asset ratio);
GROWTHit = growth of firm i year t (measured by market to book
value of equity ratio); and
it = error term.
Maydew, & Weiss, 1997; Charitou, Clubb, & Andreou, 2001; Habib & Azim, 2008; Shamki, 2013) tended to use firm size as the control variable. However, firm leverage may be used as the control variable in cases where its risk level is associated with its moderating role. This is in accordance with the factors that may influence the value relevance of the accounting information of firms (Kothari, 2000; Habib & Azim, 2008). With regard to firm growth, the valuation implications of the accounting earnings and book values are expected to be high for high growth firms (Charitou et al., 2001).
3.2.2 Testing the Differences in Value Relevance and Comparative Value Relevance of Investment Property between the Fair Value Model and the Cost Model
The samples being analysed in this study comprise a total of 345 firm-years. These were divided into: Group 1 – fair value model firms (firms selecting the fair value model for the subsequent measurement of the IP) and Group 2 – cost model firms (firms selecting the cost model for the subsequent measurement of the IP). The regression model (1) was used to analyse all the IP firms, the fair value model firms and the cost model firms. The differences of the value relevance of the accounting information noted between the fair value model and the cost model were then compared using the F-test (see, Zar, 1984). F-value was calculated as follows:
F =
with k-1 and DFp, degree of freedom
SSc = combined residual sum of squares from multiple regression
analysis on sum of square and sum of cross products of explanatory variables in model (1);
SSp = pooled residual sum of square of regression model (1) of the
fair value model firms and the cost model firms; k = number of regression models; and
DFp = number of pooled residuals degree of freedom.
If the F-test was rejected, it could be inferred that the independent variables in model (1) have affected the stock prices between the fair value model and the cost model differently. Following this, model (3) was employed to test the comparative value relevance of the IP between
(SSc – SSp)/k-1
the fair value model and the cost model. This was achieved by adding the dummy variable which partitioned the firms into the fair value model group and the cost model group. Model (4) was then applied for the same test with the control variables. Model (3) and model (4) were subsequently used to test the second hypothesis. Models (3) and (4) are presented below:
Pit = 0 + 1D+ 2EPSit + 3BVEIPit + 4IPit + 5D * IPit + it (3)
Pit = 0 + 1D + 2EPSit + 3BVEIPit + 4IPit + 5D * IPit + (4)
6SIZEit + 7LEVit + 8GROWTHit + it
D = dummy variable indicating the choices of the valuation of investment property between the fair value model and the cost model, if the firm chose the fair value model D = 1, other-wise if the firm chose the cost model D = 0;
Other variable definitions are same as models (1) and (2).
3.2.3 Testing the Factors which Affect the Accounting Choices for the Subsequent Measurement of Investment Property
The current research tests the factors which may determine the account-ing choices of firms usaccount-ing the fair value model and the cost model for the subsequent measurement of their IPs. Based on the Positive Accounting Theory (PAT) and previous studies (see details in sections 2.2.2 and 2.3.1), a test was conducted to determine whether the earnings per share (EPS), debt to equity (DE ratio) and size (political cost) have any impact on the accounting choices of firms. The current research defines the fair value model as income decreasing strategy and the cost model as income increasing strategy, based on the definitions of Missonier-Piera (2004), Astami and Tower (2006), Waweru et al. (2011) and Isa (2014). The binary logit regression model was then used for testing the factors (EPS, DE ratio and Size). This binary logit regression model is then presented as follows:
Yit = 0 + 1EPSit + 2DEit + 3SIZEit + it (5)
Yit = accounting choices for subsequent measurement of IP of
firm i year t (=1 if the firm selects the fair value model; and
= 0 if the firm selects the cost model);
EPSit = earnings per share of firm i year t;
SIZEit = size of firm i year t (measured by log of total assets); and
it = error term.
4. Empirical Results
The aim of the current research is to investigate the accounting practices and the value relevance of the IP of public listed firms in Thailand. In addition, the value relevance of the IPs between the fair value model firms and the cost model firms will also be compared. This is followed by the examination of the determining factors that may affect the accounting choices of firms using the fair value model and the cost model of the IP. The results are presented according to the research objectives noted above.
4.1 Descriptive Statistics and Correlation Analysis for Investment Property Firms
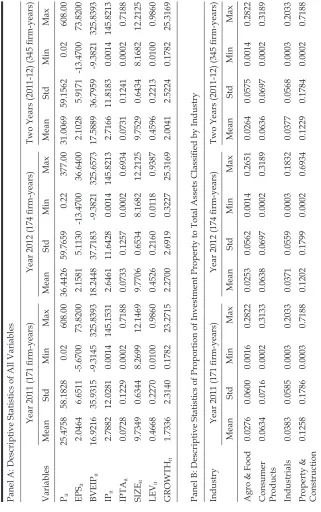
Table 4 presents the descriptive statistics for all the variables noted in the IP firms (Panel A) and the descriptive statistics of the proportion of the IP to the total assets classified by the industry (Panel B). Table 5 shows the results of the correlation analysis between all the variables in the research model.
Table 4: Descriptive Statistics for Investment Property Firms Panel A: Descriptive Statistics of All Variables
Year 2011 (171 firm-years)
Year 2012 (174 firm-years)
Two Years (2011-12) (345 firm-years)
Variables Mean Std Min Max Mean Std Min Max Mean Std Min Max Pit 25.4758 58.1828 0.02 608.00 36.4426 59.7659 0.22 377.00 31.0069 59.1562 0.02 608.00 EPS it 2.0464 6.6511 -5.6700 73.8200 2.1581 5.1130 -13.4700 36.6400 2.1028 5.9171 -13.4700 73.8200 BVEIP it 16.9216 35.9315 -9.3145 325.8393 18.2448 37.7183 -9.3821 325.6573 17.5889 36.7959 -9.3821 325.8393 IPit 2.7882 12.0281 0.0014 145.1531 2.6461 11.6428 0.0014 145.8213 2.7166 11.8183 0.0014 145.8213 IPTA it 0.0728 0.1229 0.0002 0.7188 0.0733 0.1257 0.0002 0.6934 0.0731 0.1241 0.0002 0.7188 SIZE it 9.7349 0.6344 8.2699 12.1469 9.7706 0.6534 8.1682 12.2125 9.7529 0.6434 8.1682 12.2125 LEV it 0.4668 0.2270 0.0100 0.9860 0.4526 0.2160 0.0118 0.9387 0.4596 0.2213 0.0100 0.9860 GROWTH it 1.7336 2.3140 0.1782 23.2715 2.2700 2.6919 0.3227 25.3169 2.0041 2.5224 0.1782 25.3169
Panel B: Descriptive Statistics of Proportion of Investment Pro
perty to Total Assets Classified by Industry
Industry
Year 2011 (171 firm-years)
Year 2012 (174 firm-years)
Two Years (2011-12) (345 firm-years)
Mean Std Min Max Mean Std Min Max Mean Std Min Max
Agro & Food
Table 4: (continued) Panel B: Descriptive Statistics of Proportion of Investment Pro
perty to Total Assets Classified by Industry
Industry
Year 2011 (171 firm-years)
Year 2012 (174 firm-years)
Tw o Ye ar s ( 20 11 -1 2) (3 45 fi rm -y ea rs ) Mean Std Min Max Mean Std Min Max Mean Std Min Max Resources 0.0235 0.0654 0.0005 0.2403 0.0194 0.0543 0.0005 0.2074 0.0214 0.0588 0.0005 0.2403 Services 0.0838 0.1161 0.0002 0.5354 0.0931 0.1268 0.0002 0.4894 0.0885 0.1208 0.0002 0.5354 Technology 0.0483 0.0641 0.0004 0.1419 0.0439 0.0393 0.0003 0.1024 0.0459 0.0481 0.0003 0.1419 Total 0.0728 0.1229 0.0002 0.7188 0.0733 0.1257 0.0002 0.6934 0.0731 0.1241 0.0002 0.7188 Notes:
Definition of variables is as follows. P it
=
stock price of firm
i
year
t
as of three months after the fiscal year ended;
EPS
it
=
earnings per share of firm
i year t ; BVEIP it =
book value of equity per share (exclude investment property) of
firm i year t ; IPit =
investment property per share of firm
i year t ; IPTA it =
investment property divided by total asset of firm
i year t ; SIZE it =
size of firm
i
year
t
(measured by log of total assets);
LEV
it
=
leverage of firm
i
year
t
(measured by total debt to total asset ratio);
GROWTH
it
=
Growth of firm
i
year
t
(measured by market to book value of equity ratio).
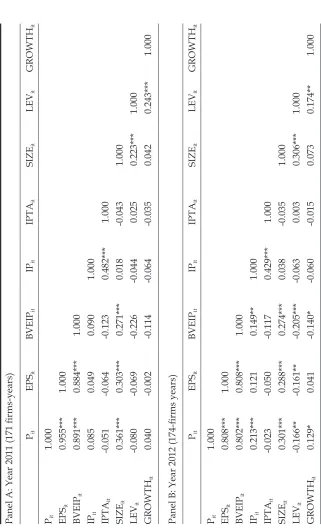
Table 5: Correlation Analysis between All Variables Panel A: Year 2011 (171 firms-years) Pit EPS it BVEIP it IPit IPTA it SIZE it LEV it GROWTH it Pit 1.000 EPS it 0.955*** 1.000 BVEIP it 0.891*** 0.884*** 1.000 IPit 0.085 0.049 0.090 1.000 IPTA it -0.051 -0.064 -0.123 0.482*** 1.000 SIZE it 0.361*** 0.303*** 0.271*** 0.018 -0.043 1.000 LEV it -0.080 -0.069 -0.226 -0.044 0.025 0.223*** 1.000 GROWTH it 0.040 -0.002 -0.114 -0.064 -0.035 0.042 0.243*** 1.000
Panel B: Year 2012 (174-firms years)
Table 5: (continued) Panel C: Two years (2011-2012) (345 firms-years) Pit EPS it BVEIP it IPit IPTA it SIZE it LEV it GROWTH it Pit 1.000 EPS it 0.877*** 1.000 BVEIP it 0.842*** 0.840*** 1.000 IPit 0.148*** 0.079 0.120** 1.000 IPTA it -0.036 -0.057 -0.119** 0.455*** 1.000 SIZE it 0.331*** 0.293*** 0.273*** 0.028 -0.039 1.000 LEV it -0.125** -0.108** -0.215*** -0.053 0.014 0.264*** 1.000 GROWTH it 0.098* 0.019 -0.126** -0.062 -0.024 0.062 0.201*** 1.000 Notes:
*** significant level at 0.01. ** significant level at 0.05. * significant level at 0.10. Definition of variables is as follows. P it
=
stock price of firm
i
year
t
as of three months after the fiscal year ended;
EPS
it
=
earnings per share of firm
i year t ; BVEIP it =
book value of equity per share (exclude investment property
) of firm
i year t ; IPit =
investment property per share of firm
i year t ; IPTA it =
investment property divided by total asset of firm
i year t ; SIZE it =
size of firm
i
year
t
(measured by log of total assets);
LEV
it
=
leverage of firm
i
year
t
(measured by total debt to total asset ratio);
GROWTH
it
=
Growth of firm
i
year
t
(measured by market to book value of equity ratio).
Table 5 indicates that stock prices are positively and significantly correlated with EPS, BVEIP and SIZE for 2011, 2012 and the two years’ analysis combined. In addition, the stock prices are positively and significantly related to the IP and GROWTH but negatively correlated with LEV in 2012 and the two years’ analysis combined. The findings presented in this table suggest that some explanatory variables are highly and significantly correlated such as EPS and BVEIP, EPS and SIZE, BVEIP and SIZE, SIZE and LEV, LEV and GROWTH for 2011, 2012 and the two years’ analysis combined. However, some of the significant correlations (between EPS and LEV, BVEIP and LEV, BVEIP and GROWTH) only appear in 2012 and the two years’ analysis combined. The findings in Table 5 indicate the high correlation for some explanatory variables which may cause multicollinearity problems in the regression analysis. Therefore, the statistical analysis for multi-collinearity will be discussed in section 4.3.
4.2 Number of Fair Value Model Firms and Cost Model Firms
The TAS 40 (Revised 2009) has identified the option for IP measurement after its initial recognition. Firms can choose either the fair value model or the cost model (see details in Section 2.1) for valuing their IPs. Table 6 summarises the number of public listed firms in Thailand that has selected the fair value model or the cost model for their IP practices in 2011, 2012 and the two years’ analysis combined (2011-2012).
From Table 6, it can be seen that 21 firms (12.28 per cent) in 2011 and 24 firms (13.79 per cent) in 2012 have selected the fair value model for their subsequent measurement of investment property. In total, 150
Table 6: The Number of Firms Choosing the Fair Value Model or the Cost Model of Investment Property
Alternative of Year 2011 Year 2012 Two Years (2011-2012) Investment
Property Number Percentage Number Percentage Number Percentage Valuation of Firms (%) of Firms (%) of Firms (%)
Fair Value 21 12.28 24 13.79 45 13.04
Model
Cost Model 150 87.72 150 86.21 300 86.96
firms (87.72 per cent in 2011 and 86.21 per cent in 2012) choose the cost model instead. Since the number of firms choosing the cost model is significant, it can be deduced that the main accounting practices for the firms’ subsequent measurement of the IP in Thailand is the cost model. This outcome matches those of Cairns et al. (2011), Christensen and Nikolaev (2013) and Isa (2014).
4.3 Regression Results for the Value Relevance of the Investment Property The current research uses the regression analysis models, Models (1) and (2) for the IP Firms. The results are shown in Panel A and Panel B of
Table 72 respectively.
Panels A and B in Table 7 indicate that the overall model is sig-nificant at the 0.01 level for 2011, 2012 and the two years’ analysis
combined. The adjusted R2 of model (1) are as follows: 92 per cent in
2011, 72.1 per cent in 2012, and 80.9 per cent for the two years’ analysis
combined. For model (2), the adjusted R2 are 92.9 per cent in 2011, 75.4
per cent in 2012 and 83.1 per cent for the two years’ analysis combined.
The adjusted R2 noted in both models are considerably high. Previous
studies (Selas, 2009; Pappu & Devi, 2011; Zi et al., 2014) have also
observed high adjusted R2 in their research models for testing the value
relevance of the IPs. Further to this, Table 7 also shows that the earnings
per share (a1) and the book value of equity per share (exclude IP) (a2) in
model (1) and model (2) are positively and significantly related to the stock prices in 2011, 2012 and the two years’ analysis combined. This implies that the firms’ earnings and book values are useful information for investors to use when valuing their securities. This outcome is also consistent with those of previous studies (e.g., Collins et al., 1997; Francis & Schipper, 1999). Interestingly, the earnings coefficients shown in Table 7 are largely relative with the book values coefficients. This outcome is also compatible with those of Francis and Schipper (1999), Graham and King (2000), Chen, Chen, and Su (2001), Kadri, Aziz, and Ibrahim (2009) and Kwong (2010).
The findings in the current research indicate that the coefficient of
the IP (a3) in 2011 is not significantly related to stock price but the IP is
positively and significantly related to stock price in 2012 and the two
Table 7:
Regression Results of Model (1) and Model (2)
Panel A:
Regression Results of Model (1)
Pit = a0 + a1 EPS it + a2 BVEIP it + a3 IPit + it (1) Variables Year 2011 Year 2012
Two years (2011-2012)
(n=171) (n=174) (n= 345) Coefficients t value p value Coefficients t value p value Coefficients t value p value Constant 5.627 3.921 0.000*** 11.512 4.281 0.000*** 8.160 5.213 0.000*** EPS it 6.734 16.597 0.000*** 5.383 6.763 0.000*** 5.807 13.387 0.000*** BVEIP it 0.336 4.456 0.000*** 0.659 6.086 0.000*** 0.558 7.970 0.000*** IPit 0.139 1.318 0.189 0.486 2.333 0.021** 0.301 2.529 0.012** F-test 657.076*** 150.100*** 487.079*** Adj. R 2 0.920 0.721 0.809 Panel B:
Regression Results of Model (2) with Control Variables
Pit = a0 + a1 EPS it + a2 BVEIP it + a3 IPit + a4 SIZE it + a5 LEV it + a6 GROWTH it + it (2) Variables Year 2011 Year 2012
Two years (2011-2012)
Table 7:
(continued)
Panel B:
Regression Results of Model (2) with Control Variables
Pit = a0 + a1 EPS it + a2 BVEIP it + a3 IPit + a4 SIZE it + a5 LEV it + a6 GROWTH it + it (2) Variables Year 2011 Year 2012
Two years (2011-2012)
(n=171) (n=174) (n= 345) Coefficients t value p value Coefficients t value p value Coefficients t value p value SIZE it 7.180 3.520 0.001*** 5.408 1.381 0.169 6.375 2.818 0.005*** LEV it -2.685 -0.455 0.650 -14.394 -1.235 0.218 -7.509 -1.146 0.253 GROWTH it 1.748 3.259 0.001*** 4.317 4.865 0.000*** 3.367 6.176 0.000*** F-test 374.353*** 89.571*** 283.263*** Adj. R 2 0.929 0.754 0.831 Notes:
*** significant level at 0.01. ** significant level at 0.05. * significant level at 0.10. The definition of variables is as follows. Pit
=
stock price of firm
i
year
t
as of three months after the fiscal year-ended;
EPS
it
=
earnings per share of firm
i year t ; BVEIP it =
book value of equity per share (exclude investment property
) of firm
i year t ; IPit =
investment property per share of firm
i year t ; SIZE it =
size of firm
i
year
t
(measured by log of total asset);
LEV
it
=
leverage of firm
i
year
t
(measured by total debt to total asset ratio);
GROWTH
it
=
growth of firm
i
year
t
(measured by market to book value of equity ratio); and
it
=
years’ analysis combined for both models (1) and (2). The results of the value relevance of the IP in 2012 and the two years’ analysis combined appear to be consistent with the first hypothesis, thereby supporting Lourenco and Curto (2008), Pappu and Devi (2011), Zi et al. (2014), Israeli (2015) and Muller et al. (2015). The findings also support the Efficient Market Hypothesis (EMH) of Thailand’s stock market. This means that the IP (one type of publicly available information) can convey useful information to investors in Thailand. However, the IP in 2011 is not value relevant and this is possibly because 2011 was the first year where Thailand was adopting the TAS 40 (Revised 2009) which had introduced the IP as a new accounting item to be included in the Statement of Financial Position. Consequently, the Thai investors were not aware of using this information in valuing their securities in that particular year.
With regard to the control variables noted in model (2), the findings suggest that leverage is insignificantly associated with stock price whereas growth is positively and significantly related to stock price in 2011, 2012 and the two years’ analysis combined. Size is positively and significantly related to stock price in 2011 and the two years’ analysis combined but not significantly related to stock price in 2012. The findings highlight the significant association between the control variables and stock prices. This outcome is also consistent with the findings of Collins et al. (1997), Charitou et al. (2001), Habib and Azim (2008) and Shamki (2013).
4.4 Testing the Differences of the Value Relevance of Investment Property between the Fair Value Model and the Cost Model
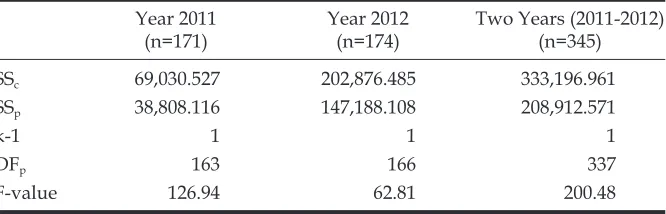
The differences of the value relevance of the IP between the fair value model and the cost model, under the TAS 40 (Revised 2009) requirement, are examined by using the F-test. The results are presented in Table 8.
The F-values for 2011, 2012 and the two years’ analysis combined are 126.94, 62.81 and 200.48, respectively. These are then compared with the F-value presented in the Table of Critical Values of the F-distribution at the confidence level of 95 per cent for the degree of freedom 1, 163 (in 2011); 1, 166 (in 2012); and 1, 337 (for the two years’ analysis combined:
2011-2012). The F-value shown approximates to 3.84.3 Based on this, it
can be concluded that all the independent variables in model (1) affect the stock prices differently. This means that the value relevance of the IP between the fair value model and the cost model is significantly different and this is consistent with the second hypothesis.
4.5 Regression Results for the Comparative Value Relevance of
Investment Property under the Fair Value Model and the Cost Model The results of the comparative value relevance of the IP under the fair
value model and the cost model are presented in Table 9.4
Panels A and B in Table 9 show the consistent findings: the overall model (3) and model (4) are statistically significant at 0.01 level. The
adjusted R2 of model (3) are as follows: 92.6 per cent in 2011, 75.1 per
cent in 2012 and 82.3 per cent for the two years’ analysis combined. For
model (4), the adjusted R2 are: 93.5 per cent in 2011, 78.6 per cent in 2012
and 84.5 per cent for the two years’ analysis combined. The adjusted R2
of both models are quite high, concurring with the results presented in
Table 7. Both model (3) and model (4) indicate that earnings (2) and
Table 8: Differences of Value Relevance of Investment Property between the Fair Value Model and the Cost Model
Year 2011 Year 2012 Two Years (2011-2012) (n=171) (n=174) (n=345)
SSc 69,030.527 202,876.485 333,196.961
SSp 38,808.116 147,188.108 208,912.571
k-1 1 1 1
DFp 163 166 337
F-value 126.94 62.81 200.48
Notes: The definition of variable is as follows.
SSc = combined residual sum of squares from multiple regression analysis on sum of square and sum of cross products of explanatory variables in model (1);
SSp = pooled residual sum of square of regression model (1) if fair value model and cost value model;
k = number of regression models; and
DFp = number of pooled residuals degree of freedom.
Table 9:
Regression Results of Model (3) and Model (4)
Panel A:
Regression Results of Model (3)
Pit = 0 + 1 D + 2 EPS it + 3 BVEIP it + 4 IPit + 5 D*IP it + it (3) Variables Year 2011 Year 2012
Two years (2011-2012)
(n=171) (n=174) (n= 345) Coefficients t value p value Coefficients t value p value Coefficients t value p value Constant 3.356 2.232 0.027* 6.771 2.400 0.017** 4.861 2.926 0.004*** D 10.894 2.811 0.006*** 12.566 1.833 0.069* 11.091 2.661 0.008*** EPS it 6.671 16.692 0.000*** 4.808 6.301 0.000*** 5.550 13.086 0.000*** BVEIP it 0.344 4.673 0.000*** 0.699 6.806 0.000*** 0.584 8.603 0.000*** IPit 0.819 3.252 0.001*** 3.071 5.174 0.000*** 1.708 5.521 0.000*** D*IP it -0.873 -3.151 0.002*** -2.947 -4.686 0.000*** -1.684 -5.041 0.000*** F-test 427.622*** 105.521*** 320.223*** Adj. R 2 0.926 0.751 0.823 Panel B:
Regression Results of Model (4) with Control Variables
Pit = 0 + 1 D + 2 EPS it + 3 BVEIP it + 4 IPit + 5 D*IP it + 6 SIZE it + 7 LEV it + 8 GROWTH it + it (4) Variables Year 2011 Year 2012
Two years (2011-2012)
Table 9:
(continued)
Panel B:
Regression Results of Model (4) with Control Variables
Pit = 0 + 1 D + 2 EPS it + 3 BVEIP it + 4 IPit + 5 D*IP it + 6 SIZE it + 7 LEV it + 8 GROWTH it + it (4) Variables Year 2011 Year 2012
Two years (2011-2012)
(n=171) (n=174) (n= 345) Coefficients t value p value Coefficients t value p value Coefficients t value p value BVEIP it 0.387 5.149 0.000*** 0.821 8.151 0.000*** 0.664 9.859 0.000*** IPit 0.896 3.781 0.000*** 3.165 5.739 0.000*** 1.799 6.209 0.000*** D*IP it -0.936 -3.593 0.000*** -2.992 -5.122 0.000*** -1.741 -5.568 0.000*** SIZE it 7.169 3.635 0.000*** 5.571 1.516 0.132 6.552 3.006 0.003*** LEV it -3.898 -0.686 0.494 -15.870 -1.455 0.147 -8.761 -1.394 0.164 GROWTH it 1.744 3.378 0.001*** 4.336 5.214 0.000*** 3.376 6.441 0.000*** F-test 306.371*** 80.263*** 235.227*** Adj. R 2 0.935 0.786 0.845 Notes:
*** significant level at 0.01. ** significant level at 0.05. * significant level at 0.10. The definition of variables is as follows. Pit
=
stock price of firm
i
year
t
as of three months after the fiscal year-ended;
D
=
dummy variable, D = 1 if firm chooses the fair value model and D = 0 if firm chooses the cost model;
EPS
it
=
earnings per share of firm
i year t ; BVEIP it =
book value of equity per share (exclude investment property
) of firm
i year t ; IPit =
investment property per share for firm
i year t ; SIZE it =
size of firm
i
year
t
(measured by log of total asset);
LEV
it
=
leverage of firm
i
year
t
(measured by total debt to total asset ratio);
GROWTH
it
=
growth of firm
i
year
t
(measured by market to book value of equity ratio); and
it
=
book values (3), are positively and significantly related to stock prices. In other words, they are value relevant information.
Further to this, the coefficients of the IP (4) are related to stock
prices in 2011, 2012 and the two years’ analysis combined. This means that Thai investors use the IP to value their stock prices and this outcome is consistent with many previous studies (e.g., Pappu & Devi, 2011; Zi et al., 2014). The coefficients of the interaction term between
the dummy variable and the investment property per share (5) in both
model (3) and model (4) are negatively significant. This means that there is a significant difference in the value relevance of the fair value model and the cost model of the IP, thereby supporting the second hypothesis. In addition, the value relevance of the fair value model is significantly less than that of the cost model. This outcome is consistent with the findings of Pappu and Devi (2011), thereby supporting the conclusion that the cost model of the IP is more significant value relevance than that of the fair value model. Based on this, it can be deduced that Thai investors recognise the importance of cost valuation because it is more objective and more reliable than the fair value. The reliability of the fair value model of the IP depends on the judgment of the management and other external appraisers (Landsman, 2007; Laux & Luez, 2009; Nellesen & Zuelch, 2011). The fair value of the IP has low reliability because there are diverse approaches in appraising the fair values of the IP (Nellesen & Zuelch, 2011) and also because of the lack of official exchange market of the IP in Thailand.
4.6 Factors Affecting the Accounting Choices between the Fair Value Model and the Cost Model
Very few Thai listed firms have selected the fair value model (see details in section 4.2) in their accounting practices but what are the factors affecting this outcome have not been examined. Therefore, based on the Positive Accounting Theory (PAT) and previous studies, this research has proposed that the bonus plans, debt to equity and size (political cost) hypothesis could affect the manager’s decision of selecting the measurement choices of the IP. The result of the binary logit regression model is presented in Table 10.
As can be noted in Table 10, the EPS, DE and SIZE can explain the
accounting choices of the IP with the Nagelkerke R2 which indicates a
two years’ analysis combined (2011-2012). The EPS is negatively and significantly related to the accounting choices whilst size is positively and significantly related to the accounting choices. This means that higher EPS firms tend to use the cost model more than the fair value model. In addition, larger firms are more likely to select the fair value model than smaller firms.
The results shown for 2011 and the two years’ analysis combined, as noted in this paper, support the bonus plan and size hypothesis under the Positive Accounting theory (PAT). It appears that higher EPS firms in Thailand select the cost model for the income increasing strategy and this outcome is consistent with Aitken and Loftus (1994). When the bonus is linked to earnings, the Thai managers have the incentives to select the accounting choices to boost their current earnings. Further, larger firms pursue the income decreasing accounting technique to reduce political attention. This outcome supports the findings of Skinner (1993), Dhaliwal et al. (1999) and Isa (2014). Nonetheless, the DE ratio Table 10: Results of Binary Logit Regression
Yit = 0 + 1EPSit + 2DEit + 3SIZEit + it (5)
Variables Year 2011 Year 2012 2011-2012
(n= 171) (n=174) (n=345)
Coefficient Sig. Coefficient Sig. Coefficient Sig. Constant -9.238 0.027** -6.416 0.075* -7.353 0.006*** EPSit -0.341 0.050** -0.053 0.348 -0.101 0.093* DEit -0.150 0.431 -0.113 0.470 -0.109 0.330 SIZEit 0.799 0.065* 0.492 0.184 0.588 0.033**
Cox & Snell R2 0.049 0.014 0.023
Nagelkerke R2 0.094 0.025 0.042
Notes: *** significant level at 0.01. ** significant level at 0.05. * significant level at 0.10.
Definition of variables is as follows.
Yit = accounting choices for subsequent measurement of IP of firm i year t
(=1 if the firm selects the fair value model, and = 0 if the firm selects the cost model);
EPSit = earnings per share of firm i year t;
DEit = total debt to total equity ratio of firm i year t;
SIZEit = size of firm i year t (measured by log of total assets); and
is not significantly related to the accounting choice and this concurs with Aitken and Loftus (1994), Demaria and Dufour (2007), Quagli and Avallone (2010), Waweru et al. (2011); Taplin et al. (2014) and Isa (2014).
In 2012, none of the three variables (EPS, DE and Size) are found to affect the accounting choices between the fair value model and the cost model of the IP in the two-tailed test. Only the size variable in the binary logit regression is observed to be positively and significantly related
to the accounting choices at 0.1 level (p value = 0.184/2 = 0.092) for the
one-tailed test in 2012. The result in 2012 also seems to support the size (political cost) hypothesis, i.e. larger firms listed in Thailand choose the fair model for the income decreasing strategy.
5. Conclusion, Discussion and Implication 5.1 Conclusion
The findings in this paper imply that about half of the listed firms have shown the IP in their Statement of Financial Position. More than 85 per cent of the samples select the cost model for their IP valuation. In 2012 and the two years’ analysis combined, the investment property is found to be value relevant but it is not related to stock price in 2011. In addition, the value relevance of the fair value model of IP is less than that of the cost model. Finally, the determinants of the accounting choices of the IP are profitability and size.
5.2 Discussion
consistent with many past studies (e.g., Lourenco & Curto, 2008; Pappu & Devi, 2011; Zi et al., 2014; Israeli, 2015; Muller et al., 2015). Moreover, the results also suggest that the cost model of the IP carries more value relevance than the fair value model. These findings are consistent with those of Pappu and Devi (2011). The plausible reason that can explain this phenomenon is that the fair values of the IP in Thailand are still rarely practiced due to unavailable reliable sources caused by a lack of the official trading market of the IPs.
The results also note that the main determinants affecting the accounting choices of the IPs in Thai listed firms are profitability and size. It appears that the executive compensation plans in Thailand are positively and significantly associated with the current earnings (Wanna, 2011). Thus, managers of Thai listed firms with higher profitability have the incentives to select the income increasing method (cost model for IP) as compared to firms with lower profitability (Aitken & Loftus, 1994). The result also observes that larger listed firms in Thailand are more likely to select the income decreasing method (fair value model of IP). This outcome is also noted in many past literatures (e.g., Skinner, 1993; Dhaliwal et al., 1999; Isa, 2014). It is found that leverage is not a determinant for the accounting choices of the IP and this outcome also concurs with many previous studies (e.g., Aitken & Loftus, 1994; Demaria & Dufour, 2007). Therefore, it can be said that the evidence drawn from this paper confirms the importance of the bonus plan and size (political cost) hypothesis under the Positive Accounting Theory. These factors also act as the determinants of the accounting choices of the IP in Thailand’s business environment. However, there is no evidence to demonstrate that a debt contract is a significant factor for selecting the subsequent measurement of the IP.
5.3 Implication
concerned. The fair value model provides the current price information which reflects the current financial position. However, it is less reliable and needs more managerial discretions (e.g., Landsman, 2007; Nellessen & Zuelch, 2011). There are no specific markets or trading prices for IP in Thailand, a scenario that is similar to all non-financial assets (e.g., PPE). To encourage the Thai listed firms to select the fair value model for the measurement of all non-financial assets, the FAP should endeavour to issue a general guidance for measuring fair values. Most Thai listed firms select the cost model which supports the bonus plan hypothesis. The findings of this paper offer managerial implications to firms for selecting the appropriate accounting policies.
In addition, the accounting choices of the TAS 40 make the com-parability of the financial statements more difficult. The earnings of the recognised fair values of the IP firms are more volatile than those of firms choosing the cost model due to the changes in the fair values of IPs as presented in the Income Statement. Investors should be aware of the differences in the accounting practices of the IP especially when making their investment decisions.
5.4 Limitation and Suggestion for Future Research
This research has studied the usefulness of the IP in terms of its value relevance as noted in the Statement of Financial Position. Further studies may investigate the relative value relevance of the fair value disclosures in the notes to financial statements (if firms choose the cost model) compared with the recognised fair value amounts of IPs (if firms select the fair value model). In addition, future studies should examine the value relevance of unrealised gains or losses that arise from changes in the fair values of the IPs in the Income Statement. Future research can be extended into investigating the value relevance of other assets under the fair value measurement such as the PPE, trading securities and available-for-sales securities. Tentative future topics should include com-parative international studies by comparing the accounting practices and value relevance of IP in other countries, especially among members of the ASEAN Economic Cooperation (AEC) countries.
References
Aitken, M.J., & Loftus, J.A. (1994). Determinants of accounting policy choice in the Australian property industry: A portfolio approach. Accounting and
Astami, E.W., & Tower, G. (2006). Accounting-policy choice and firm character-istics in the Asia Pacific region: An international empirical test of Costly Contracting Theory. The International Journal of Accounting, 41(1), 1-21. doi: 10.1016/j.intacc.2005.12.004
Barth, M.E., Landsman, W., & Lang, M. (2008). International accounting stan-dards and accounting quality. Journal of Accounting Research, 46(3), 467-498. doi: 10.1111/j.1475-679X.2008.00287.x
Cairns, D., Massoudi, D., Taplin, R., & Tarca, A. (2011). IFRS fair value mea-surement and accounting policy choice in the United Kingdom and Australia. The British Accounting Review, 43(1), 1-21. doi: 10.1016/j. bar.2010.10.003
Chancharas, N., Sektrakul, K., & Chancharas, S. (2009). Examining the market efficiency of the Thai stock market: SUE, P/E and B/M Anomalies models.
Journal of Accountancy and Management, Mahasarakham University, 1(1), 1-21.
Available at http://www.acc.msu.ac.th/newsEventAcc-biz/Event/Up_ journal/Journal13_id82.pdf (accessed on 21 May 2013).
Charitou, A., Clubb, C., & Andreou, A. (2001). The effect of earnings perma-nence, growth, and firm size on the usefulness of cash flows and earnings in explaining security returns: Empirical evidence for the UK. Journal of
Business Finance and Accounting, 28(5&6), 563-594. doi:
10.1111/1468-5957.00385
Chen, C.J.P., Chen, S., & Su, X. (2001). Is accounting information value-relevant in the emerging Chinese stock market? Journal of International Accounting,
Auditing, and Taxation, 10(1), 1-22. doi: 10.1016/S1061-9518(01)00033-7
Christensen, H.B., & Nikolaev, V.V. (2009). Who uses fair value accounting for
non-financial assets after IFRS adoption? Unpublished SSRN working
paper. Available at http://papers.ssrn.com/sol3/papers.cfm?abstract_ id=1269515 (accessed on 21 May 2013).
Christensen, H.B., & Nikolaev, V.V. (2013). Does fair value accounting for non-financial assets pass the market test? Review of Accounting Studies, 18(3), 734-775. doi: 10.1007/s11142-013-9232-0
Collins, D.W., Maydew, E.L., & Weiss, I.S. (1997). Changes in the value-relevance of earnings and book values over the past forty years. Journal
of Accounting and Economics, 24(1), 39-67. doi: 10.1016/S0165-4101(97)
00015-3
Daley, L.A., & Vigeland, R.L. (1983). The effects of debt covenants and political costs on the choice of accounting methods: The case of accounting for R&D costs. Journal of Accounting and Economics, 5, 195-211. doi: 10.1016/0165-4101(83)90012-5
Demaria, S., & Dufour, D. (2007). First time adoption of IFRS, fair value option,
conservatism: Evidences from French listed companies. Proceedings of 30