resolution are necessary. In this case, if 2-dimensional structures are observed, more detailed characteristics of edge turbulence can be clarified, since the propagation direction of the fluctuations and the mode number are directly visually studied. Therefore, a high-speed vacuum ultraviolet (VUV) camera system for 2-dimensional imaging of edge turbulent structures was developed and installed in the Large Helical Device (LHD). This optical system is composed of two multi-layer mirrors made of Mo/Si and a micro-channel plate (MCP). VUV emissions from plasmas are reflected at the multi-layer mirrors with high reflectivity and imaged on the MCP. The VUV emission of impurity carbon (n=4-2 transition of C VI) near 13.5 nm can be observed with this system. In this paper, the components of this VUV camera system and the analytical method and calculations are described in detail. Moreover, preliminary results observed in the LHD are presented.
c
2010 The Japan Society of Plasma Science and Nuclear Fusion Research
Keywords: 2-dimensional imaging, vacuum ultraviolet, impurity carbon, turbulent structure DOI: 10.1585/pfr.5.S1037
1. Introduction
In fusion plasmas, edge turbulent transport greatly af-fects plasma confinement. For plasmas with an edge trans-port barrier, edge turbulence suppression by sheared E× B flow has been observed [1]. Recently, oscillating E×B flows called zonal flows have emerged as an important part of the overall physics of turbulence [2].
The measurement of edge turbulence requires both high temporal and high spatial resolution. A 2-dimensional edge turbulent structure is necessary to clarify the prop-agation direction of fluctuations, mode structure, and so on. In the Large Helical Device (LHD), an edge transport barrier and an internal diffusion barrier have recently been observed and intensively studied. Measuring the edge tur-bulent structure in the plasmas is important for clarifying the physical mechanisms of these transport barriers.
Therefore, we have developed a new 2-dimensional imaging diagnostic for edge turbulent structures, the high-speed vacuum ultraviolet (VUV) camera system. VUV emission from impurity carbon reflects a density fluctua-tion, from which the edge density fluctuation can be esti-mated. This system is more sensitive than a pinhole-type optical system. This high-speed VUV camera system was installed on the LHD, and preliminary data were obtained.
2. High-speed VUV camera system
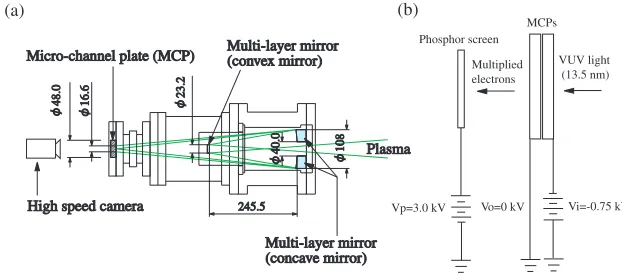
A high-speed VUV camera system consists of multi-layer mirrors, a micro-channel plate (MCP), and a visi-ble high-speed camera, as shown in Fig. 1 (a). Since VUVauthor’s e-mail: [email protected]
light is transferred only in a vacuum region, the whole sys-tem is placed in a vacuum chamber except for the visible high-speed camera.
The multi-layer mirrors are made of Mo/Si (typical thickness: 6.66 nm, dMo:dSi =4:6) and the reflectivity is
about 50–60 % [3]. These mirrors reflect mainly VUV light of 13.5 nm (half-band width: about 1-2 nm). This wavelength corresponds to the impurity carbon line (n= 4-2 transition of C VI) [4]. The system has two multi-layer mirrors. One reflects the VUV light by a convex mirror (curvature radius: 144.5 mm); the other reflects the light and images onto a detector by a concave mirror (curvature radius: 390 mm), as shown in Fig. 1 (a). The diameter of the first mirror is 23.2 mm. The number of photons col-lected by this mirror is much larger than that measured by a simple pinhole camera.
An MCP (Burle Industries Inc., APD 3040FM 12/10/8 I 60:1 P-20), which can multiply secondary electrons 2-dimensionally, is used for detection. Particles, VUV light, and X-ray light can produce secondary electrons. There-fore, an MCP is generally used to detect them. In the high-speed VUV camera system, the multi-layer mirrors do not reflect X-ray light, and charged particles do not come to the MCP due to the magnetic field in the LHD. Neutral particles do not directly enter the MCP because the multi-layer mirrors block the direct path to the MCP. The effect of the entrance of scattered neutral particles is considered to be small. Moreover, the MCP is negatively biased in order to repel secondary electrons generated in the VUV camera system. Thus, it is mainly VUV light of 13.5 nm
c
Fig. 1 (a) High-speed VUV camera system and (b) micro-channel plate section.
Fig. 2 Comprehensive view of high-speed VUV camera system together with LHD vacuum vessel and plasma.
that is multiplied by the MCP, and we can use the MCP as a VUV detector. The MCP has two layers; high voltages are supplied to them as shown in Fig. 1 (b). One, on the plasma side, is the input (Vi); the other, on the phosphor side, is the output (Vo). Typical applied Vi and Vo voltages are−0.75 kV and 0 V, respectively. The MCP used here has a phosphor screen 48 mm in diameter to image the out-put signal optically. For the phosphor, voltage is supplied up to Vp= +3.0 kV to project multiplied electrons to the phosphor screen.
The intensity of the radiation from the plasma varies significantly as the plasma parameters change. Therefore, the multiplication factor at the MCP should be carefully controlled; we remotely control the high-voltage power supply to adjust the multiplication factor.
The 2-dimensional image on the phosphor screen is recorded by a visible high-speed camera. We use a Phan-tom v4.2 camera made by Vision Research, Inc. which can record up to 25,400 pictures per second (pps) at 128×128 pixels; data from this camera are digitally recorded in 8 bits. The obtained data are transferred to a PC through an optical fiber and stored on the PC.
A comprehensive view of the high-speed VUV camera system together with the LHD vacuum vessel and plasma is shown in Fig. 2. The focal length of the multi-layer mirrors is about 7 m; thus, the mirrors are displaced from the plasma center by this length. The plasma image is
re-duced to 1/60 by the mirror optics and focused on the MCP screen. Since the diameter of the diagnostic port used here is smaller than that in the initial design, only 1/3 of the im-age, which corresponds to 5.5 mm at the entrance of the MCP, can be measured at present.
3. Viewing area and simulated image
A top view of the magnetic field lines and view-ing area of the VUV camera are shown in Fig. 3 (a). Figure 3 (b) shows the last closed flux surface at poloidal planes projected onto the MCP screen. In this viewing field, only the area indicated by the blue circle can be mea-sured, due to the limited diagnostic port size. The mag-netic field lines in the horizontally elongated section at Rax=3.8 m, Bax=−2.763 T, andγ=1.262 are shown inFig. 4. The plasma is surrounded by the ergodic region. It is possible to measure the C VI radiation from this ergodic layer together with the plasma. The trace of the X-points in Fig. 4 is shown in Fig. 3 (b) by green Xes.
sight-Fig. 3 (a) Top view of magnetic field lines and sight lines of VUV camera. Vertical axis shows the distance from the MCP. (b) Last closed flux surfaces [solid line area in (a)] projected onto MCP detector plane. The x and y axes are coordinates on the MCP. Blue circle represents the area where signal is expected. Green Xes are the X-points of magnetic field lines in Fig. 4. Red quadrangle corre-sponds to the region used in Fig. 5.
lines can be converted to a point on a reference flux surface. We can simulate the line-integrated image by assuming the local emissivity on the reference flux surface [5–7].
Figure 5 shows a simulated image of the VUV cam-era using the method described above. In the calcula-tion, the radiation profile is assumed to be proportional to exp(−((ρ−0.7)/0.1)2). Here,ρis the normalized minor
radius. The peak of the radiation is determined by the lo-cation where the C5+ ions are localized. It is estimated
Fig. 4 Magnetic field lines in horizontally elongated section at Rax=3.8 m, Bax=−2.763 T, andγ=1.262.
Fig. 5 Simulated image of VUV camera based on calculation. Image region corresponds to red quadrangular region in Fig. 3 (b), and blue circle represents the imaging area of the MCP.
by the IONEQ code [8] developed by Dr. A. Weller, using plasma parameters in the experimental condition shown in Fig. 7.
The upper-left and lower-right areas indicated by ar-rows are brighter than other areas. This is due to geomet-rical effects; the length of sightlines within the edge radia-tion region is longer for the two brighter areas (see Fig. 3). Also, in the viewing area denoted by the circle, the lower left area is darker than other areas. The Latter characteris-tic can also be seen in the experimental data.
4. Experimental results
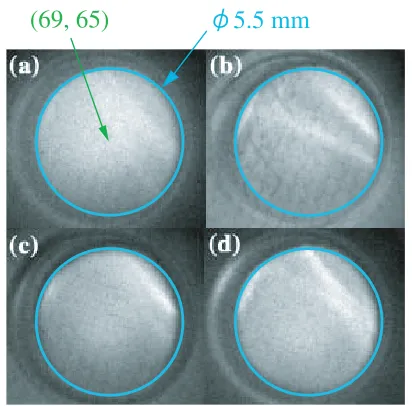
Fig. 6 Time evolution of NBI: (a) Wp, (b) nL, (c) Isx, (d) Prad, (e) Hα, (f) C III, and (g) VUV emission at (x, y)=(69, 65) pixels, which is the center of the MCP. The CDC occurs at t=3.24 s.
Figure 6 shows the time evolution of neutral beam in-jection (NBI), plasma stored energy (Wp), line-integrated
electron density (nL), intensity of soft X-ray radiation (Isx),
total power of radiation (Prad), Hαemission, C III emission,
and measured VUV emission at (x, y)=(69, 65) pixels, which is the center of the MCP. The plasma was heated by four NBIs, and hydrogen pellets were injected for t= 2.65-3.0 s. The electron density suddenly decreases at t= 3.24 s, as shown in the nL panel. The Isxobserved in the
core plasma also rapidly decreases, and that in the edge plasma slightly increases. This event is called core density collapse (CDC) [9]. The radial profiles of Teand nebefore
Fig. 7 Radial profiles of (a) Teand (b) nebefore and after CDC from Thomson scattering measurements.
and after CDC from Thomson scattering measurements are shown in Fig. 7. The electron density in the core region de-creases, and the density of the edge region increases. The time evolution of the emission at (x, y)=(69, 65) is sim-ilar to that of C III emission, Prad, and Hα emission. A
rapid change at the CDC event is clearly detected in the present system. The ability to measure a 2-dimensional VUV image with a very fast framing rate is demonstrated here. However, the increase in the signal at the end of the discharge might be caused by low-energy stray light. Therefore, the observed signal might be not only carbon impurity emission at 13.5 nm. We will improve the high-speed VUV camera system by using a low-energy cut-off filter to prevent stray light. A Zr thin film is planned at present.
The 2-dimensional images just before the CDC at t
Fig. 8 2-dimensional images just before the CDC at t=3.2375 s (a), and just after the CDC at t =3.23975 s (b), t = 3.24025 s (c), and t=3.24175 s (d). Region inside the circle 5.5 mm in diameter represents the imaging area of the MCP.
edge region is not spatially uniform. The reconstruction of this 2-dimensional VUV emission is now proceeding.
5. Summary
A high-speed VUV camera system was developed, and preliminary data were obtained. Two-dimensional VUV emissions were successfully observed. To observe
TOR agreement (NIFS07KETE001), and the JSPS-CAS Core University Program in the field of Plasma and Nu-clear Fusion.
We express our gratitude to Dr. Kuninori Sato for the loan of his MCP and to Dr. A. Weller for use of the IONEQ code.
[1] P.W. Terry, Rev. Mod. Phys.72, 109 (2000).
[2] P.H. Diamondet al., Plasma Phys. Control. Fusion47, R35 (2005).
[3] H. Takenaka et al., Transactions of MRS-Japan 28, 95 (2003).
[4] D. Stutmanet al., Rev. Sci. Instrum.77, 10F330 (2006). [5] S. Ohdachiet al., Plasma Sci. & Tech.8, 45 (2006). [6] Y. Nagayama, J. Appl. Phys.62, 2702 (1987).
[7] N. Iwama and S. Ohdachi, J. Plasma Fusion Res.82, 399 (2006).
[8] A. Welleret al., JET-IR(87)10.