Structural Optimization of the Blanket First Wall to Reduce
Thermal Stress Using the Taguchi Method
Wenhai GUAN, Makoto FUKUDA, Shuhei NOGAMI, Akira HASEGAWA, Hisashi TANIGAWA
1),
Takanori HIROSE
1), Hiroyasu TANIGAWA
2)and Hitoshi TAMURA
3)Department of Quantum Science and Energy Engineering, Tohoku University, Sendai 980-8579, Japan 1)Japan Atomic Energy Agency, Naka, Ibaraki 311-0193, Japan
2)Japan Atomic Energy Agency, Rokkasho, Aomori 039-3212, Japan 3)National Institute for Fusion Science, Toki 509-5292, Japan
(Received 28 January 2014/Accepted 17 September 2014)
The first wall of a fusion reactor blanket faces the core plasma directly. The first wall endures high heat loads that lead to high thermal stresses. To ensure the reliability of the first wall structure, it is desirable to reduce the thermal stress. In this study, structural optimization of the blanket first wall was carried out using the Taguchi method. The finite element method was used to conduct a numerical simulation to investigate the thermo-mechanical responses of the blanket first wall. The optimal configuration of the blanket first wall was derived.
c
2014 The Japan Society of Plasma Science and Nuclear Fusion Research
Keywords: blanket first wall, thermal stress, Taguchi method, structural optimization DOI: 10.1585/pfr.9.1405143
1. Introduction
1.1
Thermal fatigue of blanket first wall
The current concept of a test blanket module (TBM) for a fusion reactor consists of a first wall (FW) and sev-eral fabrication parts. Because the FW of a fusion reactor blanket faces the core plasma directly, the structural com-ponents of FW must be able to resist high heat loads. From the perspective of withstanding high heat loads, a thin FW structure is recommended.The various loading conditions encountered during the normal operation of a fusion reactor result in thermal stress induced by high heat loads and thermal fatigue dur-ing power cycldur-ing. The corresponddur-ing temperature varia-tion, which is one of the main causes of damage to the FW, should be considered. Therefore, thermal fatigue should be considered in the design, manufacture, operation, and inspection of an FW. To improve the strength and relia-bility of an FW structure while extending its lifetime, it is desirable to reduce the thermal stress through structural optimization.
The Japan Atomic Energy Agency (JAEA) has pro-posed the TBM design, which has a solid frame structure and solid breeder structure, taking into account manufac-turability using the hot isostatic pressing (HIP) process, as shown in Fig. 1 [1–3]. In this design, the solid frame struc-ture of the TBM comprises the FW and fabricated rectan-gular cooling channels. The solid breeder structure con-sists of multiple layers of pebble beds made of a tritium breeding material and neutron-multiplying material.
Fig-author’s e-mail: [email protected]
Fig. 1 TBM concept [1].
ure 2 shows the dimensions of part of the FW model de-sign options proposed by the JAEA. In this study, the anal-ysis object was a section of half of an FW configuration (solid lines) with a height (H) and width (W) of 18 mm and 5.5 mm, respectively. The cross-sectional area of the cooling channel is 32 mm2[4].
1.2
Taguchi method
The design of a complicated structure, such as a fu-sion reactor blanket and its FW, which depends on many critical dimension parameters, has always been a challenge to researchers. Therefore, a suitable optimization design
c
Fig. 2 Configuration of the section of the FW.
technique for use during the research stage is desired. The Taguchi method (TM) is one of the methods used to ob-tain robust optimized designs that has been used in many fields, especially for product development, and is famous for quickly producing high quality and efficiency at low cost in design and manufacture. To optimize the FW struc-ture, TM was used in this study. TM, developed by Genichi Taguchi, is a statistical method used to improve product quality, and it is commonly used in improving industrial product quality. At the beginning of TM design, the de-sign parameters and levels affecting the process need to be determined. Design parameters that are treated as control factors, such as the dimensions of the FW, are variables within the process that affect performance measures. The levels of the design parameters are varied within defined ranges. TM is then used to design experiments using spe-cially constructed tables known as orthogonal arrays (OA) to indicate the number of conditions considered in each ex-periment. An OA is a factorial design used to ascertain the effects of multiple process variables on performance char-acteristics while minimizing the number of experiments. Based on the OA analysis results, the resulting data are transformed into sensitivity values. These sensitivity val-ues are helpful in identifying the control factors and levels used in the analyses that have the greatest effects on the performance characteristics. The signal-to-noise (S/N) ra-tio is typically used in TM to evaluate the variara-tion in per-formance of an output characteristic. To simplify the anal-ysis, noise factors are not defined; instead, the same sen-sitivity values were used in this study to evaluate the per-formance of output characteristics. After identifying the optimal parameters and levels, a confirmation experiment is needed [5–8]. Details on the sensitivity calculations and optimal level determinations are discussed in later sections.
The steps in TM are summarized as follows:
(1) The main effects are evaluated, and control factors and levels are determined for the analysis object.
(2) An OA is established on the basis of the control fac-tors and levels.
(3) An experiment is conducted according to the OA to analyze the data.
(4) The results of the experiment are obtained, and the optimal factors and levels are determined on the basis of the sensitivity effects.
(5) The optimal factors and levels are used together in a confirmation experiment.
1.3
Objective
An important objective of this study was to determine how to reduce the temperature and thermal stress on the FW while eliminating stress concentrations by changing the FW configuration within the allowable ranges of the parameters. Another objective was to identify an optimal configuration for the FW that would ensure its stable and secure operation in a fusion reactor. An evaluation of the variation in the design parameters for the optimal configu-ration was also necessary.
2. Analysis
2.1
FE-model
A two-dimensional thermo-mechanical analysis was conducted in this study. The finite element method (FEM) was used for the calculations. The analysis object and boundary conditions (BC) were implemented using the partial FE model of the FW shown in Fig. 3. The thermo-mechanical analyses were conducted using ANSYS ver. 14.0. Two-dimensional generalized plane elements were used for the simulations. The values assigned to the temperature-dependent thermal and mechanical material properties of the elastic properties of F82H used in the analysis were based on data obtained from JAEA. The F82H was developed by JAEA and JFE [9,10], as the prime candidate for fusion blanket structural material has been applied to fusion reactors because of the relatively high re-sistance to degradation of material performance.
A high heat load can lead to high thermal stress at the top surface induced by thermal expansion of the FW. Thus, to reduce the stress at the top surface, a design con-cept that to import a slit in the structural optimization was considered. As a load condition, a heat flux of 1 MW/m2
was considered for the top surface of the FW. The temper-ature of the cooling water and the value of the heat transfer coefficient of the FW were 573 K and 0.024 W/mm2/K,
re-spectively [11]. Nuclear heat generation occurring in the FW was also considered, with a value of 58 MW/m3taken
as an input.
temper-Fig. 3 Boundary conditions of the partial FW model (a) BC #1, (b) BC #2 [12].
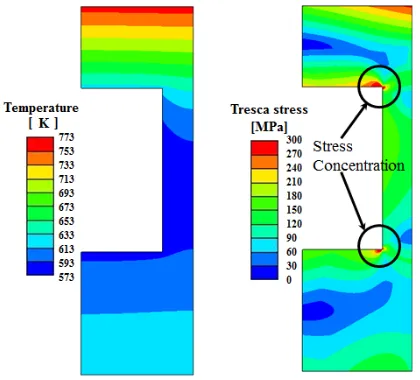
Fig. 4 Temperature and Tresca stress distribution of the refer-ence FW model.
ature distribution results obtained for the half-FW model, the mechanical analyses were separated into two types, as in previous research [12]. One type of analysis simulated the central part of the FW (BC #1). The other type simu-lated the side wall part of FW between the blanket modules (BC #2), as shown in Fig. 3 [12].
2.2
Analysis of rectangular and circular
models
Figure 4 shows the temperature and Tresca stress dis-tributions of the reference FW model (rectangular model). For comparison with the reference model, an FW model design with a circular cooling channel was also analyzed. The cooling channel of the circular model had the same
Fig. 5 Temperature and Tresca stress distribution of the circular FW model.
cross-sectional area and the same outer dimensions as the reference model, as shown in Fig. 5.
The thermo-mechanical analyses of the rectangular model and circular model were conducted for the same load conditions. The analysis results showed that stress concentrations occurred in the reference model, as a result of temperature differences between the top surface and the corners of the cooling channel of the rectangular model, as shown in Fig. 4. During power cycling and with the corresponding temperature variation, these stress concen-trations occurred repeatedly, leading to cracks at the cor-ners of the cooling channel as a result of thermal fatigue to the point of fracture. However, stress concentrations were not observed along the circular cooling channel in the cir-cular model shown in Fig. 5. It was therefore concluded that it would be useful to eliminate stress concentrations by changing the shape of the cooling channel to ensure safety of the FW during normal operations. In addition, the stress distributions of the rectangular model and circular model were found to be quite different. Comparison of the re-sults for the reference model and the circular model makes it possible to identify a reference model configuration that has a reasonable possibility of being an optimum config-uration. It is considered necessary to optimize the shape of the current FW design to eliminate stress concentrations and reduce thermal stress while guaranteeing normal oper-ation of the fusion reactor.
2.3
Structural optimization using TM
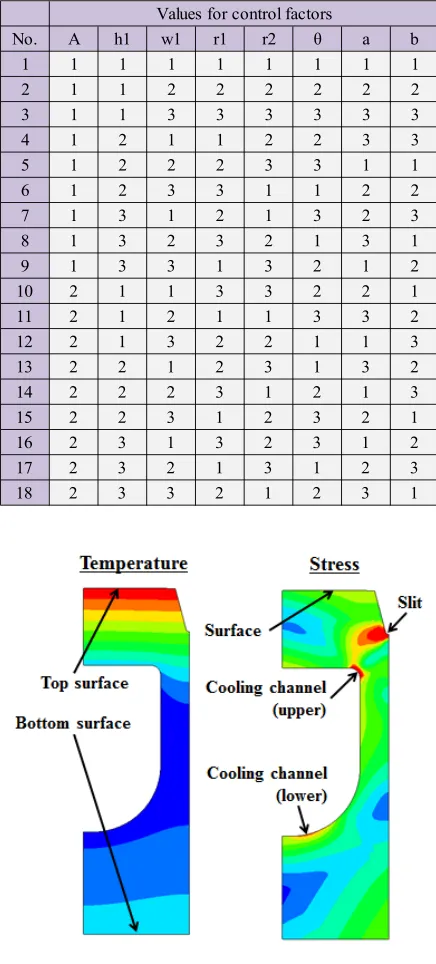
As mentioned in Sec. 1.2, in this study, according to the definition of OA, every controllable dimension of the half-FW design was identified and parameterized (Fig. 6). Based on the selected parameters, seven control factors at three levels each and one control factor at two levels were selected for the L18 OA. Table 1 lists the selected designFig. 6 Control factors with design parameters.
Table 1 Control factors.
which has eighteen rows and eight columns. Each entry of the columns h1, w1, r1, r2, θ, a, and b was selected from among three levels, and the entries in column A were selected from among two levels. Column A is a nullable column with a control factor at two levels that is used in the L18 OA. The nullable column serves as an error column
used for comparison with the factorial effects of the other control factors [13]. In addition, when the design target does not have enough parameters to serve as control factor, a nullable column with one control factor at two levels, as presented in Table 2 [13], is used in the OA to ensure the smooth conduct of the experiment.
With this OA, the required number of finite element analysis experiments was reduced from 4374 (21×37) to
18. Use of an OA can substantially reduce the number of experiments required to analyze a design, in comparison to an analysis of all levels of all control factors. Therefore, what type of level combination is used in an experiment should be taken into account. If any two columns are se-lected, nine possible combinations exist as a row: (1,1), (1,2), (1,3), (2,1), (2,2), (2,3), (3,1), (3,2), and (3,3). It can easily be proven that each combination appears exactly
Table 2 Information in the L18OA.
Fig. 7 Evaluation point of temperature and stress of FW.
the same number of times as the number of rows. Based on the homogeneity and orthogonality ensured by TM, the L18OA can be determined. Details of the L18OA method
are given in Refs. [14–17]. Using the selected control fac-tors and their levels, eighteen models are applied to the L18
OA, which means that eighteen models were analyzed us-ing FEM in this study.
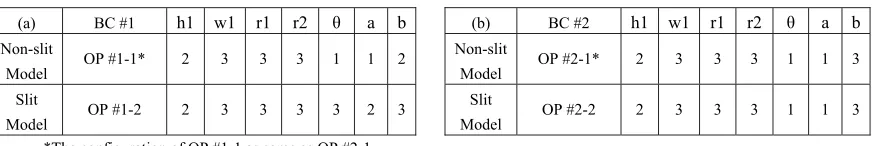
Table 3 The optimum control factors and levels of BC (a) #1 and (b) #2.
use as evaluation criteria in the optimization. In the case of temperature, the values used were the top and bottom surface temperatures. In the case of stress, the values used were the stresses at the top surface, the upper and lower parts of the cooling channel, and the slit part. Based on the results of the FEM analyses of the eighteen models, the temperature or stress value at each of these points was transformed into a sensitivity value. In the assessment of performance, regardless of which sensitivity values are se-lected, the lowest value of every control factor is always preferred. Using the procedure for calculation of the sen-sitivity values for an L18 OA, with the peak stress and the
temperature values at the every evaluation points, the sen-sitivity values can be determined. A sensen-sitivity value can be determined using the following equations of sensitivity:
S =10log1
nSm, (1)
Sm=
n
i=1yi
2
n , (2)
where S is the sensitivity value, yi is the peak stress or temperature at the evaluation point, and n is the number of evaluation points [18]. For a given level of a control fac-tor, the sensitivity value is calculated and highlighted. The minimum sensitivity value is then selected by comparing the values for the three levels for each control factor. In addition, column A is a nullable column in L18 OA, and
the factorial effect of column A is an average of the other factorial effects of the same level. Furthermore, the facto-rial effect of column A was used as a standard to assess the variation in the other control factor across their levels [13]. Because the goal of the analyses was to minimize the ef-fect of sensitivity, the minimum input leads directly to the minimum output. Thus, in this study, the minimum tem-perature and stress values were sought as output at every point of reference on the FW. Based on the sensitivity val-ues, optimal configurations of the FW and optimal factors and levels could thus be determined.
3. Results and Discussion
Based on the results of the thermo-mechanical analy-ses of the eighteen models, the temperature and stress val-ues at the evaluation points of every part were summarized and transformed into sensitivity values. Figure 8 shows the graphs obtained of the factorial effects. The minimum
Fig. 8 Graphs of factorial effects for BC #1 and BC #2.
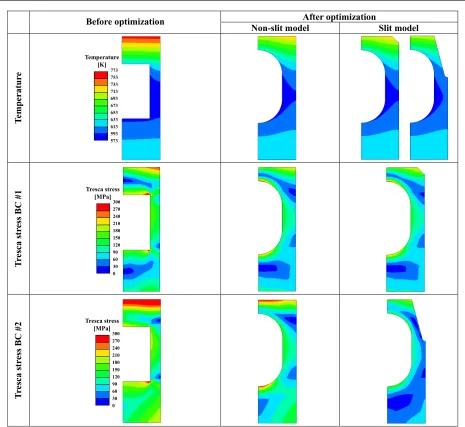
Fig. 10 Temperature and Tresca stress distributions along with the difference between the reference model and the optimum model (F82H).
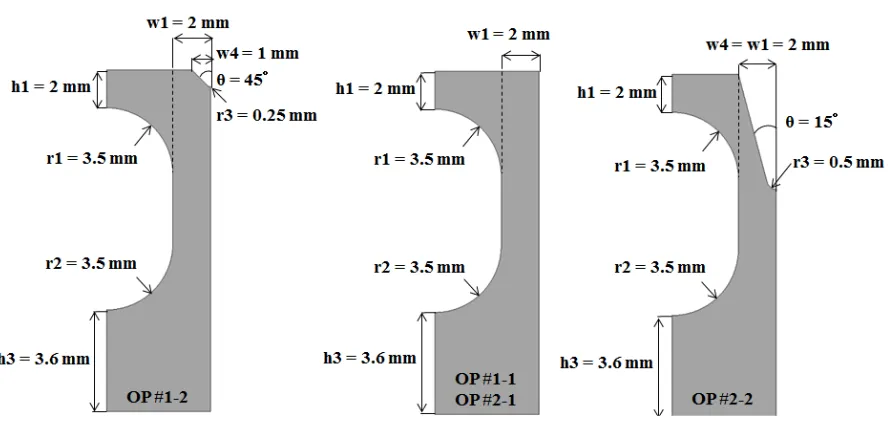
BC #2, regardless of the presence of a slit. Based on these results, the optimum levels were determined and are listed in Tables 3 (a) and 3 (b), and the optimum configurations for the FW are shown in Fig. 9.
The optimum configurations for the FW were calcu-lated for the same load (see Sec. 2.1) and boundary condi-tions (i.e., BC #1 and BC #2) as for the reference model. The temperature distribution results are summarized in row 1 of Fig. 10. The results for the maximum top-surface and bottom surface temperatures are summarized in Table 4.
Figure 12 shows the reduction in the normalized tem-peratures for BC #1 and BC #2 in comparison to the ref-erence model. The maximum top surface temperature of the non-slit model (OP #1-1) decreased by approximately 7%. With the slit model, the maximum top surface tem-perature decreased by approximately 7% and 11% for OP #1-2 and OP #2-2, respectively. The bottom surface
tem-perature barely changed, as shown in Figs. 10 and 12. The Tresca stress distribution results are shown in rows 2 (BC #1) and 3 (BC #2) of Fig. 10. The results for the top surface Tresca stress and upper and lower cooling channel Tresca stresses are summarized in Table 4.
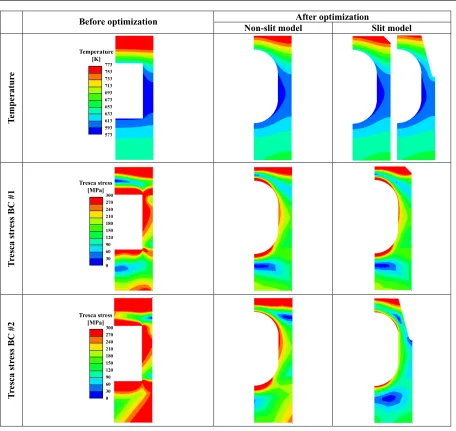
Fig. 11 Temperature and Tresca stress distributions along with the difference between the reference model and the optimum model (SUS316).
respectively.
The results of the thermal analyses indicate that af-ter optimization, the top surface temperature decreases to some degree, especially for the slit model. The slit re-duces the temperature from heat load because the top sur-face of the FW for input heat flux is increased. The re-sults of the mechanical analysis indicate that with opti-mized performance in the case of BC #1, the stress at every evaluation point is significantly decreased from that given by the Tresca stress distribution. No stress concentrations were observed for the optimum model. The percentage de-creases in stress for the slit model were slightly higher than for the non-slit model. In contrast, in the case of BC #2, the top-surface stress and the lower cooling channel stress are significantly reduced with the slit model. This means that more attention should be paid to the thermal expansion that occurs between blankets and leads to thermal stress. The
results showed the ability of a slit to reduce the thermal stress due to thermal expansion.
For the same reason as the slit, the coefficient of ther-mal expansion of the material has a large effect in reduc-ing thermal stress that should be completely understood. Therefore, it is assumed that a material with a higher coeffi -cient of thermal expansion and lower thermal conductivity than F82H would be more effective for structural optimiza-tion purposes.
To demonstrate that TM is useful for structural opti-mization when used with other materials, another material SUS316 was also considered [19, 20]. Because of its lower thermal conductivity and higher coefficient of thermal ex-pansion, the predicted temperatures and stresses are higher than those predicted for F82H.
Table 4 Maximum temperatures and Tresca stresses obtained using material of F82H.
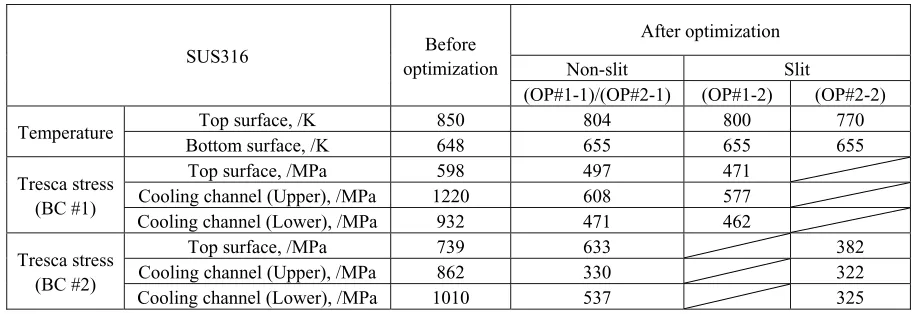
Table 5 Maximum temperatures and Tresca stresses obtained using material of SUS316.
Tresca stresses are summarized in Table 5.
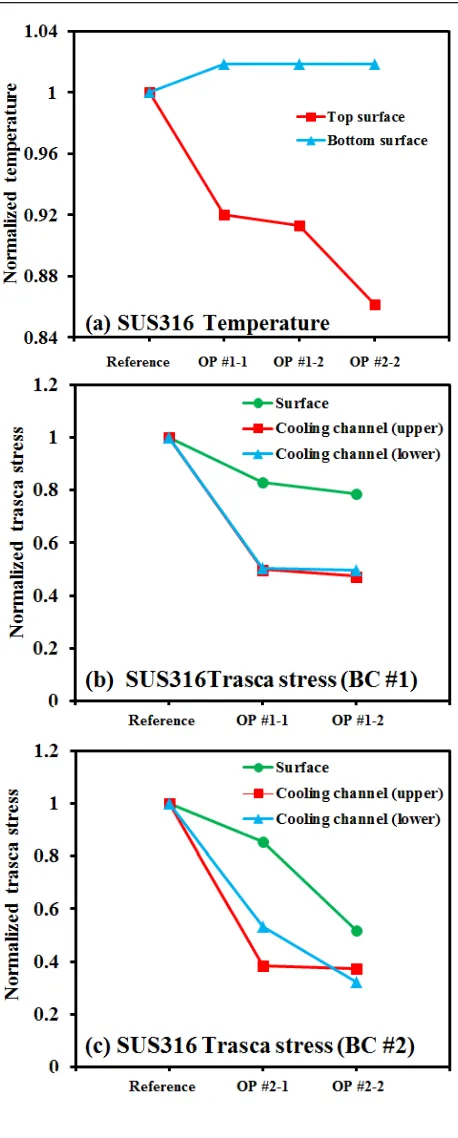
Figure 13 shows the reduction in the normalized tem-peratures and Tresca stresses for BC #1 and BC #2 in com-parison to those for the reference model. For the non-slit model, the maximum top-surface temperature was de-creased by approximately 8%. For the slit model, the max-imum top-surface temperatures were decreased by approx-imately 9% and 14% for BC #1 and BC #2, respectively. In the case of BC #1, for the non-slit model, the maximum top-surface stress, upper cooling channel stress and lower cooling channel stress were decreased by approximately 17%, 50%, and 50%, respectively. For the slit model, these stresses were decreased by approximately 21%, 53%, and 50%, respectively. In the case of BC #2, for the non-slit model, these stresses were decreased by approximately 14%, 62%, and 47%, respectively. For the slit model, these stresses were decreased by approximately 48%, 63%, and 68%, respectively.
For all of the temperatures and stresses considered, the percentage decreases at every evaluation point were higher than those for F82H. These results indicate that a mate-rial with a higher coefficient of thermal expansion performs
better for structural optimization purposes. The results also show that the slit model is more effective for optimization purposes than the non-slit model. The same was true with F82H.
4. Conclusions
In this study, the JAEA reference model and eighteen models developed using TM were simulated by ANSYS. The analysis results were used to determine the optimum configuration of the FW of a fusion reactor blanket. The performance of the optimized configuration was demon-strated as well. The results obtained are summarized as follows:
1. After optimization, the maximum top-surface temper-ature and the maximum cooling channel stress were reduced by 11% and 69%, respectively.
2. A slit part in the model was found to reduce thermal stress at the top surface.
3. The temperature and stress results show that the Taguchi method was used successfully in this study to perform structural optimization.
demon-Fig. 12 Normalized temperatures and Tresca stresses obtained using material of F82H: (a) Temperature, (b) Tresca stress for BC #1, (c) Tresca stress for BC #2.
strated by the results of thermo-mechanical analyses, the feasibility of using slits in real FW applications for future needs to be discussed, given the manufacturing obstacles posed by this complicated configuration and its higher processing cost.
5. Among the parameters selected for examination in this study, the circular part of the cooling channel and
Fig. 13 Normalized temperatures and Tresca stresses obtained using material of SUS316: (a) Temperature, (b) Tresca stress for BC #1, (c) Tresca stress for BC #2.
Acknowledgments
The authors would like to express their appreciation to Mr. Y. Kitamura of Advanced CAE Solutions, Inc. for support on FEM analysis.
[1] T. Nishitani, H. Tanigawaet al., Fusion Eng. Des.386–388, 405 (2009).
[2] S. Nishioet al., Fusion Eng. Des.81, 1271 (2006). [3] Y. Nomoto, S. Suzuki, K. Ezato, T. Hirose, D. Tsuru, H.
Tanigawa, T. Hatano, M. Enoeda and M. Akiba, Fusion Eng. Des.81, 719 (2006).
[4] H. Tanigawa,5.1 blanket and thermal conversion system, J. Plasma Fusion Res.87Supplement, 132 (2011).
[5] Z.-Y. Wu, H.-W. Wu and C.-H. Hung, Fuel117, 8 (2014). [6] R. Sreenivasulu, Procedia Engineering64, 785 (2013). [7] G. Ambrogioa, F. Gagliardia and L. Filice, Procedia CIRP
12, 270 (2013).
[8] G. Taguchi,Functionality Evaluation for Robust Design – For the Efficient Technology Development(Japanese Stan-dards Association, Tokyo, 2000).
[9] M. Tamura, H. Hayakawa, H. Tanimura, A. Hishinuma and T. Kondo, J. Nucl. Mater.141–143, 1067 (1986).
[10] H. Tanigawa, K. Shiba, H. Sakasegawa, T. Hirose and S.
Jitsukawa, Fusion Eng. Des.86, 2549 (2011). [11] S. Suzukiet al., J. Plasma Fusion Res.82, 768 (2006). [12] M. Enoeda, M. Akiba, S. Tanaka, A. Shimizu, A.
Hasegawa, S. Konishi, A. Kimura, A. Kohyama, A. Sagara and T. Muroga, Fusion Eng. Des.81, 415 (2006).
[13] Y. Watanabe, Hajimete no parameta sekkei (Union of Japanese Scientists and Engineers, Tokyo, 2013) p.68-69 (in Japanese).
[14] H. Yano,Hinshitsu kougaku keisan hou nyumon(Japanese Standards Association, Tokyo, 1998) p.51 (in Japanese). [15] S. Yamada, Jikken keikaku hou -houhou hen- (Union of
Japanese Scientists and Engineers, Tokyo, 2004) p.87-91 (in Japanese).
[16] H. Morita,Saishin jikken keikaku hou no kihon to shikumi (Shuwa System, Tokyo, 2010) p.152-153 (in Japanese). [17] G. Taguchi, Jikken keikaku hou (jou) (Maruzen, Tokyo,
1962) p.78-79 (in Japanese).
[18] K. Tatebayashi, Nyuumon taguchi mesoddo (Union of Japanese Scientists and Engineers, Tokyo, 2004) p.33 (in Japanese).
[19] C.F. Lucks and H.W. Deem, ASTM STP227, 20 (1958). [20] M. Grujicic and H. Zhao, Mater. Sci. Eng. A252, 117
![Fig. 1TBM concept [1].](https://thumb-us.123doks.com/thumbv2/123dok_us/8440452.1701194/1.595.343.512.386.575/fig-tbm-concept.webp)