HProve
: A Hypervisor Level Provenance System to
Reconstruct Attack Story Caused by Kernel Malware
Chonghua Wang
1, Libo Yin
1,∗, Jun Li
1, Xuehong Chen
1, Rongchao Yin
1, Xiaochun Yun
2, Yang
Jiao
3, Zhiyu Hao
3,
1China Industrial Control System Cyber Emergency Response Team, Beijing, China, 100040
2National Computer Network Emergency Response Technical Team/Coordination Center of China, Beijing, China,
100029
3Institute for Information Engineering, Chinese Academy of Sciences, Beijing, China, 100093
Abstract
Provenance of system subjects (e.g., processes) and objects (e.g., files) are very useful for many forensics tasks. In our analysis and comparison of existing Linux provenance tracing systems, we found that most systems assume the Linux kernel to be in the trust base, making these systems vulnerable to kernel level malware. To address this problem, we presentHProve, a hypervisor level provenance tracing system to reconstruct kernel malware attack story. It monitors the execution of kernel functions and sensitive objects, and correlates the system subjects and objects to form the causality dependencies for the attacks. We evaluated our prototype on 12 real world kernel malware samples, and the results show that it can correctly identify the provenance behaviors of the kernel malware with a minor performance overhead.
Received on 12 November 2018; accepted on 17 December 2018; published on 25 January 2019
Keywords: Provenance Tracing; System Logging; Kernel Malware; Forensic Investigation
Copyright © 2019 Chonghua Wang et al., licensed to EAI. This is an open access article distributed under the terms of the Creative Commons Attribution license (http://creativecommons.org/licenses/by/3.0/), which permits unlimited use, distribution and reproduction in any medium so long as the original work is properly cited.
doi:10.4108/eai.8-4-2019.157417
1. Introduction
Nowadays, enterprises are suffering from rapidly increasing serious attack threats, especially Advanced Persistent Threat (APT). Compared to traditional attacks, APT attacks are stealthier and more sophisti-cated by employing multi-step intrusive attacks. This kind of attacks would impose disastrous impacts on the systems if the associated attack vector aims at kernel [1– 3, 6,7]. Detecting such attacks is an urgent matter in enterprise environments, but is far from enough. In addition to detecting the existence of the attacks, deep investigation should be performed to find out where the attacks are, how the attacks are derived, and when they are introduced. For instance, a kernel mode attack can modify kernel objects or entities, which is potentially more dangerous. Acquiring such details about how the kernel objects and entities are manipulated is crucial to understand the attack for forensic investigations.
Provenance1 tracing [8, 12, 24, 29, 33, 34, 44] is an useful technique for security investigation that can
∗
Correspondingauthor.Email:[email protected]
provide a detailed record of the origin and evolution of events and entities in a system. Given a corrupted entity (e.g., a file, a data structure, a pointer, etc.), it could help to answer two questions:
1. What-provenance: What is the source/entry point of the corrupted entity? Which other entities in the system were derived from (and corrupted by) the entity?
2. How-provenance: Building causality dependencies to show the events /entities that led to the corruption of the entity and those that have been further corrupted by the entity.
For a provenance system, the provenance information should be complete and faithful to provide the holistic view of the events occurred in the system for forensic applications. If the investigator fails to foresee the need for a particular kind of provenance information to be captured, then it would be difficult to rebuild the complete causality dependencies. Whereas an
1The termprovenance comes from the art world, where it refers to
untrusted kind of provenance information could infer an innocent source.
State-of-the-Art: Lots of existing works employ audit logging to record events (e.g., memory reads and writes, process reading a file, messages being sent or received, etc.) during system execution and then correlate these events for building the causality dependencies during investigation [8, 12, 24, 29, 33, 34, 44]. Specifically, Bates et al. [12], present Linux Provenance Modules (LPM) framework to capture whole-system provenance including a detailed record of processes, IPC mechanisms, network activities and the kernel itself. LPM takes the kernel mechanisms, provenance recorder and storage back-ends as the Trusted Computing Base (TCB). There is no mechanism for protecting LPM from the rest of the kernel meaning that it trusts the kernel code. These systems assume the Linux kernel to be in the trusted computing base (TCB), making these systems vulnerable to kernel malware. If an intruder employs a kernel malware to compromise the kernel, it is trivial to cheat or even undermine the audit logging, thus leading to inaccurate provenance results. However this assumption does not hold in practical settings in the examples of kernel malware.
Our approach: The key to solve the above problem is to backtrack an untrusted kernel using an external monitor. Thus, we choose to use virtualization techniques to solve this problem. The kernel itself is excluded from our TCB and we only trust the hypervisor. The hypervisor in general has a smaller code base, and is more trustworthy [32]. In specific, we present a hypervisor level provenance tracing system, HProve, to address the above problems and complement existing provenance systems. On one hand, HProve ports the logging module to the hypervisor to keep the log recorded trustworthy, especially for kernel malware. On the other hand, in order to obtain complete provenance information, HProve employs lightweight record and replay techniques to record the whole execution of system and replay the system meanwhile instrumenting hypervisor for provenance. For efficiency, execution traces recorded do not include the state of emulated hardware devices focusing on the provenance tracing process rather than replaying a generic VM.HProveis able to replay and analyze a trace without having access to the VM image that was used for recording. Meanwhile to reduce runtime overhead, the instrumentation code is inserted into the hypervisor only when necessary during replay. After obtaining the execution traces, the backtracking technique is applied to the kernel APIs to find out the caller-callee chain usingfunction call convention.2.HProve achieves this by ourprovenance tap points uncoveringtechnique.
In summary, we make the following contributions:
- We presentHProve, a hypervisor level provenance tracing system that can replay kernel level malware attack to acquire accurate provenance details.
- To provide valuable insights about how kernel malware impacts on the kernel internals, we devise a novel approach to backtrack the ker-nel for acquiring caller-callee chain of kerker-nel functions reversely and correlate malware behav-iors with tampered kernel objects to explore the causality dependencies.
- We have built a proof-of-concept prototype
of HProve to demonstrate the feasibility of
our approach. We have conducted extensive experiments with a variety of representative malware samples collected in the wild, and demonstrated that our system could correctly build the causality dependencies within the victim system.
2. Background and Motivation
In this section, we give a brief introduction of kernel malware and describe the motivation of our approach.
2.1. Background
A kernel malware is typically used by loading a malicious kernel module into the kernel and then interacting with the kernel data to hide itself without being detected. As an example, an investigator may employ monitoring tools to find malicious files in directories, whereas a kernel-based malware may first detect such attempts and delete the malicious files before the kernel returns the identification of the files or return an empty result. To achieve an malicious goal, the kernel-mode components of malware typically employ hooking or DKOM (Direct Kernel Object Manipulation) strategies [4]. For hooking, the malware hijacks the key functionalities of the operating system such as the system call table, VFS (Virtual File System) functions, or IDT(Interrupt Descriptor Table) and then points to malicious functions. They are loaded in terms of LKM (Loadable Kernel Module) that have the same privilege of kernel. For DKOM, adversaries directly tamper with pointers fields or data values of sensitive kernel objects to hide or manipulate the OS semantics. DKOM adversaries are loaded through the kernel memory devices such as /dev/kmem. Such devices give access to the memory region occupied by the running
2A function call convention is a scheme to pass function arguments
kernel. It is possible to overwrite kernel at the runtime and thus perform arbitrary modifications. We collect a variety of kernel malware samples and manually analyzed them. In summary, there are several categories that kernel malware falls into: system service hijacking ( e.g., hooking system call table entries and replacing
system call table), dynamic kernel object hooking (KOH, e.g., VFS hooking) and DKOM [36,40].
2.2. Motivation
Kernel malware is considered as one of the most stealthy threats in computer security field and becomes a major challenge for security research communi-ties [10,13, 40] since it has the equal privilege as the kernel and often higher privileges than most security tools. Recently lots of work were proposed to tackle this attack: kernel rootkit detection [21,22,37,43,48], kernel rootkit prevention [26, 36, 38, 42] and kernel rootkit profiling [23,27,39,45]. However, these works suffer from several drawbacks. Specifically, detection is done after the victim system has been attacked, but the malware behaviors may have been missed. Prevention is adapted to detection systems, which is mainly to enforce kernel integrity, whereas it lacks the under-standing of what had happened in the past. Profiling is capable of producing malware traces, such as hook-ing behavior, target kernel objects, user-level impact and injected code [45]. However, profiling does not focus on obtaining the connections among these traces. These systems do not meet the goal of comprehensively revealing the causality dependencies among kernel malware behaviors and impacts on the victim system. For this goal, we need to solve three key challenges:
1)What kernel functions, kernel APIs and system calls have been called by malware?,2)What kind of kernel objects (e.g., pointer fields and data values, etc.) have been accessed or damaged by malware?, 3) How to connect kernel malware behaviors and impacts on the victim system?
Provenance tracing is an efficient approach to address these challenges since it can associate these events together to find the causality dependencies among them. The provenance records provide the holistic view of the whole system, thus can be well suited to system forensics. Even though the system is subverted by malware, provenance points out the possibility to restore the victim system to a good state in confidence.
Limitations of the State-of-the-Art. Existing systems [12,
24, 25, 29, 34] make the assumption that the kernel is trusted, which is usually not the case. There are following concerns on these systems: Circumvention), the adversary may attempt to hide its behaviors by circumventing the provenance recorder. As an example, the malware may unlink itself from the module list provided by/proc/modules, which makes the
malware behaviors stealthy; Deception), the adversary may trick the provenance recorder to collect inaccurate information. For example, the adversary may use a malicious system call handling function to send fake behavior to the system;Termination), the adversary may kill the provenance recorder process to make the system unable to track provenance.
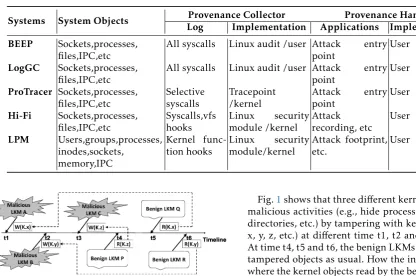
Regarding these concerns, we have studied prove-nance systems like LPM [12], BEEP [24], LogGC [25], ProTracer [29], Hi-Fi [34] and analyzed their features in terms of system objects, provenance collector and prove-nance handler. We illustrate these features regarding provenance systems aiming at user space and kernel space malware respectively. System objects are critical for provenance systems to be recorded. They are mainly composed of files, processes, IPCs, sockets, etc in user space malware provenance, whereas kernel malware provenance is aimed at kernel APIs, kernel data struc-tures, memory regions, instructions, etc. The granu-larity of recorded system objects determines whether the provenance information collected is complete or not. Provenance collector is responsible for observing and recording system objects and the related events. For user space malware provenance, the provenance collector mainly places hooks and analysis codes into the kernel or user space to capture a variety of events: file reads and writes, process communication, network communication, etc. For kernel malware provenance, the provenance collector should trace the entire kernel to capture kernel API calls, kernel objects changes, memory accesses, etc. Note that, user space malware provenance systems trust the kernel, whereas kernel space malware provenance systems exclude the kernel from the Trusted Computing Base . To achieve fidelity, the provenance collector can be deployed to hypervi-sors. Provenance handler is responsible for correlating the events and system objects to build the causality dependencies. For user space malware provenance sys-tems, it is implemented in user space whereas kernel malware provenance systems implement provenance handler in hypervisor level. Many provenance applica-tions can be deployed atop provenance handler, such as interpreting, processing and storing collected prove-nance data. User space malware proveprove-nance systems (e.g, BEEP [24], ProTracer [29], etc.) may aim to find out which process/thread (e.g, firefox, pine, etc.) or the specific link within a program brings in the malware source. Whereas kernel malware provenance systems concern on the entire impacts on the kernel.
Table 1. Study of State-of-the-art Provenance Systems
Systems System Objects Provenance Collector Provenance Handler Log Implementation Applications Implementation BEEP Sockets,processes,
files,IPC,etc
All syscalls Linux audit /user Attack entry point
User
LogGC Sockets,processes, files,IPC,etc
All syscalls Linux audit /user Attack entry point
User
ProTracer Sockets,processes, files,IPC,etc
Selective syscalls
Tracepoint /kernel
Attack entry
point
User
Hi-Fi Sockets,processes, files,IPC,etc
Syscalls,vfs hooks
Linux security
module /kernel
Attack recording, etc
User
LPM Users,groups,processes,
inodes,sockets, memory,IPC
Kernel func-tion hooks
Linux security
module/kernel
Attack footprint, etc.
User
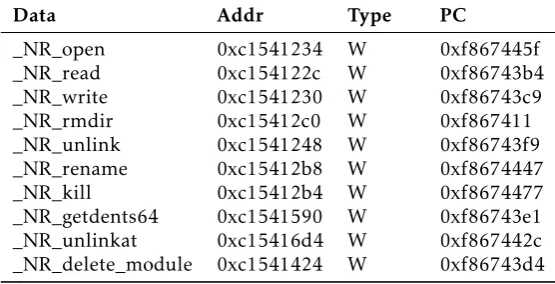
Figure 1. An abstract diagram to illustrate a scenario that needs kernel malware attack provenance. W denoteswriteoperation, R denotesreadoperation and K.x denotes kernel object x. The end that the dash line points to is the source of the data read by benign LKMs.
or other processes). The fifth and sixth columns show provenance applications that can be deployed atop the provenance handler ( e.g., ProTracer backtracks the entry points of attack) and implementation layer of the provenance handler.
Motivating Scenario. Suppose a user wants to install
a kernel driver and downloads a LKM without being aware that it is malicious. The malicious LKM subverts important kernel objects (e.g., K.x, K.y and K.z as shown in Figure 1) to hide itself and transfers confidential information. The system investigator inspects the victim system and starts scanning and monitoring work as usual. But nothing has been detected for some days which may raise questions to the administrator. Also the user may download more than one malicious LKM which manipulates multiple kinds of kernel objects. What the system investigator needs to know is which LKM tampered with what kind of kernel objects. He has to design some investigation techniques to detect dependences among LKMs, files, kernel objects and memory accesses or even instructions and build causality dependencies through causal analysis of the historical events.
Fig.1shows that three different kernel malware issue malicious activities (e.g., hide processes, hide files and directories, etc.) by tampering with kernel objects (e.g., x, y, z, etc.) at different time t1, t2 and t3 respectively. At time t4, t5 and t6, the benign LKMs begin to read the tampered objects as usual. How the investigator knows where the kernel objects read by the benign LKMs come from? Have they been modified by the malicious LKM A or B or C? All these questions can be answered by kernel malware provenance.
3. System Overview
3.1. Scope, Assumptions and Threat Model
In this paper, we do not differentiate the terms of kernel malware and kernel rootkit. Both of them represent the kernel-mode components of malicious behaviors. According to what we have discussed in Section 2.1, kernel malware may issue malicious activities in different ways, but the essence of them is the same: they need to tamper with kernel objects. Regarding the scope of different categories of kernel malware and to focus on the provenance problem itself for kernel malware, system call hooking is our initial implementation decision for a prototype and our approach can be extended with other approaches which handle DKOM and VFS hijacking. Once the detection of DKOM and VFS hijacking is included [47], our method can perform provenance tracing from there. And we did not consider kernel ROP or other advanced kernel malware in this paper.
Figure 2. System Overview of HProve. PTP in the causality dependences denotes Provenance Tap Points which are shortly to be defined in next section.
the system call table and the corresponding entries so that we can locate them in memory and reveal each access on them. Meanwhile, we assume thefunction call conventionsis not variable so that we can infer the caller of kernel APIs accurately. AsHProveis implemented on Linux, these assumptions are reasonable and practical.
We define a threat against HProve as any way of compromising the fidelity or completeness of the provenance information collected. HProve guarantees that even though the kernel is compromised by the adversaries, we can track the tampered objects and further conduct provenance tracing. The hypervisor level attack is out of scope of HProve, and we can employ hypervisor integrity checking techniques such as [28, 38] to ensure the intactness of the hypervisor before conducting provenance tracing.
3.2. Overview
We present HProve to complement current provenance techniques. HProve is designed to comprehensively reveal the causality dependences among kernel mal-ware behaviors and impacts on the victim system. It is capable of obtaining a deep insight on what kind of behaviors kernel malware may conduct. The prototype ofHProveis composed of the record, replay, instrumen-tation, and provenance components as illustrated in Fig. 2.
First, it employs a lightweight recorder to record whole system execution of the guest OS. The recorder is lightweight since it dose not record the emulated hard-ware devices. ThenHProveleverages a replayer with an instrumentation engine to analyze the execution traces recorded by the recorder. The replayer supports on-the-fly instrumentation. The instrumentation engine is capable of keeping track of a series of kernel functions (e.g., kmalloc, vmalloc, load_module, etc.) and tracing memory access to sensitive kernel objects (e.g, system call table, etc.) during the replay phase.HProveacquires complete provenance information during replay phase.
The provenance component is responsible for retriev-ing provenance information by analyzretriev-ing the standard
function call conventionsand building complete causal-ity dependencies regarding impacts from kernel mal-ware to a victim system. HProve supports off-the-shelf Linux OSes of different guest kernel versions.
Since kernel malware could manipulate the entries of the system call table via system call table hijacking, HProvekeeps track of the changes of these entries. Then it obtains the allocated memory region of the system call tablein memory and records memory access of the memory region. There are a few hundreds of entries in the system call table (e.g., 350 and 312 entries in Linux 3.2 kernel for 32-bit and 64-bit respectively), thus only a few hundreds of memory addresses are to be tracked byHProve. Writes to these entries are considered as suspicious and recorded. Note that the writes to system call table entries make the relative system call service routine points to the malicious function in kernel malware. The above process is achieved by our technique : Memory Access Tracing. To associate the memory access to these sensitive entries with the impacts on the kernel, HProve captures the program counter that initiates the access points and backtracks the kernel starting from the kernel API that calls theprogram counter. Backtracking makes it possible to trace back to the original point at which malware has been loaded into the kernel. This is achieved by our technique:Provenance Tap Point Uncovering.
4. Design and Implementation
In this section, we first present several definitions used in our approach. Then we describe the design and implementation ofHProvein details.
4.1. Definitions
Provenance Tap Points . We define a provenance tap
point, an execution point [15] in the kernel at which we wish to capture a set of function callers. It is defined as a four-tuple:
(call_site, func_entry, func_arg, func_ret_val),
where func_entry is the kernel function whose caller to be tracked, func_arg refers to the argument of the function,func_ret_valis the return value of the function and call_site denotes the caller of the function_entry. Before identifying theprovenance tap points, we initially identify instruction level tap points, which we call raw tap points. Each raw tap point is defined formally as a pair:
(call_site, program_counter),
address of the instruction. To determine the call site, we use the return address of the call to thefunc_entry. In the instruction stream, the return address is the address of the instruction after the call instruction. Once a raw tap point is discovered, data-flow analysis and memory introspection [19] are needed to correlate the identified instruction with a certain argument of the kernel function. Hence, we can eventually retrieve the function level tap point:provenance tap points.
Memory Access Trace . Memory Access Traceis used to
connect the kernel events and function calls within the kernel, where each accessmis formatted as a four-tuple:
m=(addr, data, type, program_counter).
Addr is the address of memory being accessed. Data
is the amount of data written or read. Type is the type of the memory access (either a read or a write).
Program_counter is the address of the instruction invoking the access.
4.2. Design Goals
HProve employs kernel event replay to track the
provenance of kernel malware attacks. We have the following goals for designingHProve.
- G1: Fidelity. The provenance information col-lected should be secure and trustworthy for obtaining true causality dependences.
- G2: Flexibility. It should be flexible to add custom instrumentation code into malicious code execution so that it can conduct various provenance analyses depending on needs.
- G3: Efficiency.The efficiency for kernel malware attack provenance tracing is considered in two-fold: 1) It should be efficient to collect abundant information to build causality dependencies;2) The performance overhead for replay should be acceptable.
The architecture ofHProve is depicted in Fig.2. The record and replay modules are implemented in the virtualization layer using QEMU to achieve fidelity (G1). The instrumentation process is completed during the replaying phase rather than the recording phase which offers the provenance analysis with different requirements determined in the off-line stage, ensuring that the information to be collected is flexible to choose (G2). Execution traces recorded do not include the state of the emulated hardware devices to make the recorder lightweight.HProve focuses on the analysis of a process for provenance tracing rather than the replay of a generic VM.HProveis able to replay and analyze a trace without the access to the VM image that is used for recording. Meanwhile to reduce runtime overhead,
Figure 3. Illustration on How Our Instrumentation Engine Works during Replay
the instrumentation code is inserted into the translated code only when necessary during replay (G3).
4.3. Recording Non-deterministic Events
HProve leverages Panda [14], built atop on QEMU, to record the non-deterministic events (e.g., IN, the data entering the CPU on port input; INT, a hardware interrupt and its parameters; DMA, the data written to RAM during a direct memory access operation from a peripheral device). Panda extends the original recording process of the QEMU emulator and the recorded information can be replayed deterministically for the entire execution at any later time. Since the execution traces recorded do not include the state of emulated hardware devices, it does not support the execution of device code during replay. However, this feature satisfies our requirements. Eliminating the execution traces of device code helps to reduce the logging overhead significantly.
4.4. Instrumentation during Replay
Before discussing the instrumentation details during replay, we introduce theQEMU Translation Blockfirst.
QEMU Translation Block. The guest code is split into
"translation blocks" (corresponds to a list of instructions terminated by a branch instruction). QEMU then translates them into an intermediate language using TCG (Tiny Code Generator), which provides the APIs to insert additional code. This intermediate translated block is converted into a corresponding basic block of binary code that can be directly executed on the host. Fig. 3 shows how the guest code is transformed into translation blocks.
Instrumentation before/after Execution . HProveinstruments
Figure 4. Building Causality Dependencies among Kernel Malware Behaviors and Impacts on the Victim System. PTP denotesProvenance Tap Point
First, it conducts source code analysis of the typical execution route of kernel malware and reveals the common characteristics of them. We found that before loading a LKM malware, it is inserted into the kernel using utilities such as insmod or modprobe. Then the kernel initializes the LKM through system calls, calls
load_module function to load the LKM, and allocates memory space for it. We set the insmod or modprobe
operation as the start point and the allocating memory operation as the end point of the work done by kernel for all the LKMs. We define the timeline between the start point and the end point as Top-Half, and the timeline after the end point is defined as Bottom-Half. The analysis of the events occurrs during Top-Half is completed byProvenance Tap Point Uncovering. And the events occur duringBottom-Halfis analyzed byMemory Access Tracing.
Uncovering Provenance Tap Points. No matter what kind
of objects will the kernel malware manipulate, its execution file should be allocated into the memory. Since HProve records whole execution of the running kernel, it instruments analysis code into the recorded traces to track the kernel allocation/deallocation related functions (e.g., kmalloc/kfree, vmalloc/vfree). Whenever these kinds of allocation/deallocation events occur at runtime, HProve replays the execution for capturing the allocated address range and location of the code that calls the memory allocation function. As defined in Section4.1, HProve determines thecall_site,
func_entry, func_arg, func_ ret_val for Provenance Tap Point in the replay phase. HProve instruments provenance code before (after) the execution of each basic block during replay as depicted in Fig. 3. Take an allocation function (e.g.,vmalloc) as afunc_entry, the address of objects being allocated can be determined by thefunc_arg, and the size of object can be determined byfunc_ret_val. Take a deallocation function (e.g.,vfree) as afuc_entry, the address of objects being deallocated can be determined by thefunc_arg.Call_sitedetermines
which function calls the func_entry. Each item of the
Provenance Tap Point can be captured by analyzing
function call conventionswithin the hypervisor.
To capture thecall_site,HProveuses the return address of the call tofunc_entry. In the instruction stream, the return address is the address of the instruction after theCALLinstruction.Func_argandfunc_ret_valcan be captured through the stack or registers. Integers up to 32-bits as well as 32-bit pointers are delivered via the
EAX register. Func_arg is delivered through the EBP
with corresponding offsets. Func_arg and func_ret_val
are only available when func_entry returns to the call_site. In order to capturefunc_argandfunc_ret_val
at the correct time, HProve uses a shadow stack to store these values. Specifically,HProve checks if it ends with aCALLinstruction after each basic block executes during replay. If so, the return address is pushed into a shadow stack. Correspondingly, before execution of each basic block, HProve checks whether it matches a return address on the shadow stack; If so, we know that the current function has returned, thus HProve pops it from the shadow stack and captures the return value from theEAXregister as well as the function arguments fromEBPwith corresponding offsets. ThenHProvereads the value from the registers and memory addresses using the introspection technique [19]. The obtained values of provenance tap points will be stored in the form of (calle_site, func_entry func_arg,func_ret_val) as described in Section4.1.
Memory Access Tracing. After malware being allocated
into the memory, it is able to start carrying out malicious activities. These events occur in the phase of Bottom-Half. Typically, LKM malware would try some tricks (e.g., bypassCR0protection and search for
System.mapfile ) to get the entry address ofsystem call table, and manipulate the relativesystem call entriesfor different purposes. Fortunately, there are only a few hundreds of system call entries in Linux as discussed in Section 3.2. HProve keeps track of these addresses to check whether there is a write operation executed on them with low overhead, if so it records the PC
that initiates thewriteoperation. The retrieved values of memory access traces will be stored in the form of
m=(addr, data, type, program_counter) as described in Section4.1.
4.5. Causality Dependencies
To build causality dependencies, HProve uncovers the connections among the events occurr in the Top-Half and Bottom-Half. When the allocation function allocates memory for LKM malware,HProveacquires the address range that is being allocated by interpreting the
the pc locates within one of the address range that has been allocated for malware. If so,HProvecorrelates the writes on system call entries with the func_entry
that execute the allocation. ThenHProvedetermines the
call_site of the func_entry that executes the allocation by the Provenance Tap Point Uncovering technique. Through backtracking successively,HProveacquires the complete call_site to determine the original malware source that initials the write operation on system call entries.
5. Evaluation
In this section we present the effectiveness of using HProve to build causality dependencies among kernel malware behaviors and impacts on the system. Then we evaluate HProve’s efficiency to show that our approach does not incur significant overheads. In our experiments, the host machine is an Intel Core i5 desktop running Ubuntu 12.04. We use Linux kernels as the guest VM. To validate our experiments results with the ground truth, we have collected 12 kernel malware samples that contain a mix of malicious capabilities found in the wild, including 10 system services hijacking malware (e.g., kbeast, xinqyiquan, etc.), 1 DOH malware (e.g., adore-ng-.0.56), and 1 DKOM malware (e.g., hp rootkit).
5.1. Effectiveness
Before verifying the effectiveness of HProve, we show that kernel malware could bypass Linux audit utilized by state-of-the-art provenance systems like BEEP [24], LogGC [25], and ProTracer [29]. These systems employ the audit system to log system calls for analysis. We execute our collected kernel malware samples one by one, then start the audit system and set some rules [5] to record system calls triggered by the malware. Since all LKMs loaded into the kernel can be exported through/proc/modulesdirectory, if everything goes well, the audit system can log LKM lists by monitoring /proc/modules. Take Kbeast as an example, it manipulates the system call entry_NR_delete_module
to cheat kernel, thus the Kbeast would not be listed through/proc/modules. As a result, the audit system fails to logKbeast, leading to inaccurate provenance results by BEEP, LogGC and ProTracer. Other kernel malware that employ similar hooking mechanisms would bypass the audit system as well. We did not test LPM and Hi-Fi that employ the Linux Security Module for logging. However, since both of these systems intercept system calls as provenance information and thus they could be bypassed by kernel malware that manipulate system call entries. To evaluate the effectiveness of our system, we should obtain provenance tap points and memory access traces of the targeted kernel objects accurately with HProve. In the experiment setup, HProve loads 12
Figure 5. Illustration of Caller-callee Relationship Chain When LKMs Are Inserted into Kernel. These functions on the left are served as func_entry of the Provenance tap point. The right is the kernel space address of thefunc_entry.
kernel malware samples and 6 benign LKMs into the guest kernel. Once all of these modules are loaded into the kernel, HProve starts recording whole execution of the guest kernel with the lightweight recorder. Then the recorded traces are instrumented with provenance code during its replay to obtain provenance tap points, and
memory access traces. After that provenance information is retrieved to build the causal dependencies.
Provenance Tap Points. As discussed in Section 4.4,
LKMs are inserted into the kernel by the insmod or
modprobeutility in Linux. These utilities encapsulate a
sys_init_module system call which performs initializa-tion and calls theload_modulefunction. This function is responsible for loading the LKM from the user space to the kernel space. First, it calls the copy_and_check
function which calls the vmalloc function to allocate temporary memory for copying the LKM file into the memory region. Second, theload_modulefunction calls
layout_and_allocate to allocate the final memory for a specific section of the LKM (e.g., core space, .init.text, etc). The remaining caller-callee relationship chain is shown as below:
layout_and_allocate−→move_module −→module_alloc_update_bounds −→module_alloc−→__vmalloc_node_range.
Table 2. Allocated Start Address Range for Each Kernel Malware
Address range
Kbeast Xing-yiquan
Suter-usu
Knark Enye-lkm
Synap-sys
Rial Kis Kbdv3
Adore-0.42
Adore-ng0.56
Start address
0xf86-73000
0xf86-82000
0xf86-85000
0xf86-83000
0xf86-75000
0xf86-77000
0xf86-71000
0xf86-89000
0xf86-68000
0xf86-79000
0xf86-64000
Size/Bytes 215 308 276 413 356 218 196 525 298 418 382
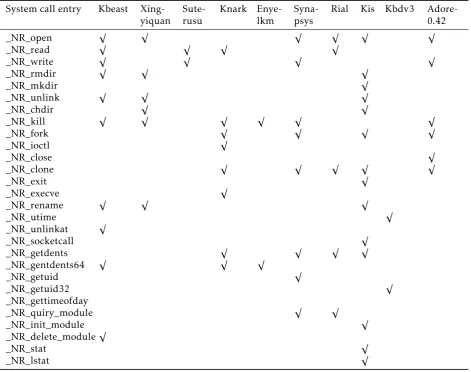
Table 3. One ofMemory Access TraceTable Obtained by HProve._NR_openis the entry of system callsys_openand so forth.
Data Addr Type PC
_NR_open 0xc1541234 W 0xf867445f
_NR_read 0xc154122c W 0xf86743b4
_NR_write 0xc1541230 W 0xf86743c9
_NR_rmdir 0xc15412c0 W 0xf867411
_NR_unlink 0xc1541248 W 0xf86743f9
_NR_rename 0xc15412b8 W 0xf8674447
_NR_kill 0xc15412b4 W 0xf8674477
_NR_getdents64 0xc1541590 W 0xf86743e1
_NR_unlinkat 0xc15416d4 W 0xf867442c
_NR_delete_module 0xc1541424 W 0xf86743d4
With this prior knowledge, HProve treats these functions shown in Fig. 5as the function_entryof one of theprovenance tap points. Take__vmalloc_node_range
as an example, it is used for allocating specific pages in physical memory for LKMs. We can infer other items of
provenance tap points(e.g.,call_site,function_argument,
function_return_value ) with provenance tap point uncoveringand memory introspection techniques [19].
Specifically, once we have inferred
mod-ule_alloc_update_bounds,HProve acquires the allocation information of LKMs including the address range from the provenance tap point. The address range is critical for HProve to link the causality dependency between
Top-Half and Bottom-Half as discussed in Section 4.5. In our experiments, HProve uncovers provenance tap points for all kernel malware samples. The address range allocated for each malware sample is shown in Table 2. Since DKOM type malware are loaded into kernel in terms of /dev/kmem, we do not list it in the table.
Memory Access Traces. Before building the complete
causality dependencies, the memory region which the LKMs belong to needs to be identified.HProveachieves this by recording the memory access to the system call table for the running malware. We then build the
Memory Access Trace tuple for each system call entry manipulated by each kernel malware. In the tuple,PCis critical field to determine which LKM is manipulating the relative system call entry. As discussed above,HProve acquires various memory regions that are allocated for the LKMs loaded into the kernel. IfPCfollows in one of
the memory regions, then the two events are correlated. A table for theMemory Access Tracetuples is constructed for each kernel malware sample.
Table3shows one of the results obtained byHProve. As we can see, in the second row, _NR_open entry is located at 0xc1541234 and has been written by PC 0xf867445f. HProve refers to the result of Table 2 and determines that thisPCand otherPCsin Table3belong to the memory region allocated forKbeast.
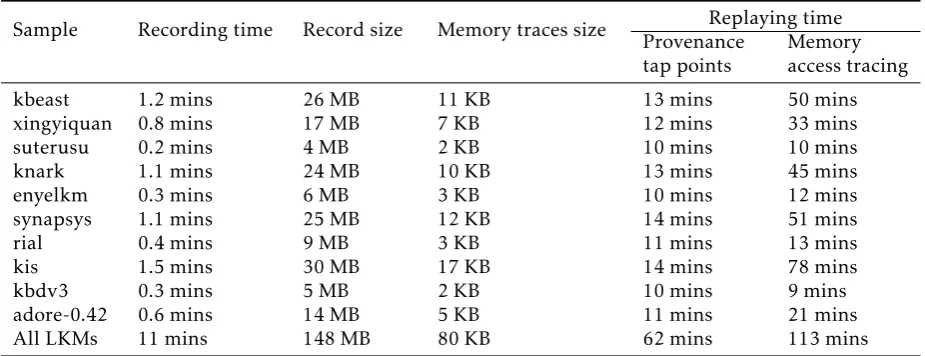
After correlatingmemory access traceswithprovenance tap points, HProve is able to identify which malware manipulates which kind of kernel objects. Table 4 shows the system call entries that are manipulated by kernel malware samples of system services hijacking we collect. For instance,Kbeast tampered with_NR_open,
_NR_read,_NR_write,_NR_rmdir,_NR_unlink, etc. We also analyze the source code of all the malware samples for the validation purposes, and it turned out that the entries discovered by our provenance tracing method correctly matched the malware behaviors in the source code.
5.2. Efficiency
Table 4. Manipulated System Call Entries. ‘√’ denotes that the entry has been manipulated.
System call entry Kbeast Xing-yiquan
Sute-rusu
Knark Enye-lkm
Syna-psys
Rial Kis Kbdv3
Adore-0.42
_NR_open √ √ √ √ √ √
_NR_read √ √ √ √
_NR_write √ √ √ √
_NR_rmdir √ √ √
_NR_mkdir √
_NR_unlink √ √ √
_NR_chdir √ √
_NR_kill √ √ √ √ √ √
_NR_fork √ √ √ √
_NR_ioctl √
_NR_close √
_NR_clone √ √ √ √ √
_NR_exit √
_NR_execve √
_NR_rename √ √ √
_NR_utime √
_NR_unlinkat √
_NR_socketcall √
_NR_getdents √ √ √ √
_NR_gentdents64 √ √ √
_NR_getuid √
_NR_getuid32 √
_NR_gettimeofday
_NR_quiry_module √ √
_NR_init_module √
_NR_delete_module√
_NR_stat √
_NR_lstat √
kernel at a time and repeat 10 times. For each case, we report the recording time, the size of a record, the size of a memory trace, and the replay time in Table5. The second column of Table5presents the recording time of the sample’s execution. The third column shows the size of impact traces that are recorded by the lightweight recorder of HProve. The forth column lists the size of memory access traces of the system call entries. The fifth and sixth columns present the replay time for
Provenance Tap Points Uncovering and Memory Access Tracingrespectively.
As we can see, a record size in the table is at most 30MB for the evaluated LKM samples, which is acceptable for these samples executing millions of instructions. Since there are only a few hundreds of memory addresses to be tracked, the size of memory traces is at most 17KB. The duration of replaying
Memory Access Tracing for all LKM samples is 113 minutes and the average duration of replayingMemory Access Tracingfor each malware sample is 32.2 minutes. Replaying for uncoveringProvenance Tap Pointstook 62
minutes for all LKM samples and 11.8 minutes for each malware sample in average.
6. Discussion
In this section ,we discuss the limitations ofHProveand our future work.
HProve employs Panda [14] to record the whole execution of system, it shares the overhead with Panda for keeping track of instructions and the program counter at the instruction level. Recording under hardware virtualization of KVM and replaying using CPU emulation would be a significant speedup. We plan to migrate Panda to leverage such techniques to get better performance.
Table 5. Evaluation for space and time for provenance
Sample Recording time Record size Memory traces size Replaying time
Provenance tap points
Memory access tracing
kbeast 1.2 mins 26 MB 11 KB 13 mins 50 mins
xingyiquan 0.8 mins 17 MB 7 KB 12 mins 33 mins
suterusu 0.2 mins 4 MB 2 KB 10 mins 10 mins
knark 1.1 mins 24 MB 10 KB 13 mins 45 mins
enyelkm 0.3 mins 6 MB 3 KB 10 mins 12 mins
synapsys 1.1 mins 25 MB 12 KB 14 mins 51 mins
rial 0.4 mins 9 MB 3 KB 11 mins 13 mins
kis 1.5 mins 30 MB 17 KB 14 mins 78 mins
kbdv3 0.3 mins 5 MB 2 KB 10 mins 9 mins
adore-0.42 0.6 mins 14 MB 5 KB 11 mins 21 mins
All LKMs 11 mins 148 MB 80 KB 62 mins 113 mins
being tracked is modified (e.g., the malware creates new kernel objects with altered semantics). We have tested a type of DKOM and VFS hijacking malware (e.g.,
hp rootkit, adore-ng-0.56) that can elude our system. But our approach can be easily extended with other approaches which handle DKOM and VFS hijacking. Once the detection of DKOM and VFS hijacking is included [9,47], our method can perform provenance tracing from there. Other thansystem call table, we can keep track of other sensitive kernel objects that DKOM or VFS hijacking malware may manipulate. Note that if the kernel malware disguises itself as a benign kernel module such as a device driver,HProvestill works.
Since HProve locates the address of an instruction executing a malicious memory operation into the code region of the kernel malware, it cannot handle kernel ROP or other advanced kernel malware. We consider to extend our system to adapt to more categories of kernel malware in our future work.
7. Related Work
Kernel Malware: Many researchers have studied the behaviors of kernel malware and proposed lots of effective approaches to detect their existence. HookFinder [27] identifies all the impacts made by the malicious code and keeps track of the impacts flowing across the system to identify the hooking behavior of a rootkit in the kernel execution. HookMap [43] employs a more elaborate method to identify all potential hook in the execution path of kernel code that could be utilized by the kernel level malware. K-Tracer [23] discovers information about rootkit capabilities through its data manipulation behavior to help defend against rootkit as well as user-level malware that gets help from them. PoKeR [39] is a kernel rootkit profiler that generates multi-aspect kernel rootkit profiles (e.g.,hooking behavior, targeted
kernel objects, user-level impacts and injected code) during rootkit execution. Rkprofiler [45] is also a kernel malware profiler that can track both pointer-based and function-based object propagation, while PoKeR only tracks the pointer-based object propagation. To complement these work, our work analyzes the behavior of kernel malware reversely (from bottom to top and from impact to cause) which is orthogonal to theirs.
kernel, which makes the provenance results untrusted. Our contribution is to complement these techniques by porting the provenance collector as well as the analysis module into the hypervisor for the resistance to kernel level malware.
Deterministic Replay: Deterministic replay creates an execution that is logically equivalent to an original execution of interest. It records the not-deterministic events(e.g., hardware interrupts, I/O inputs, DMA events) and replays the system at a checkpoint deterministically [14–18,30,31,35,46]. Deterministic replay is helpful to roll back a victim system after an attack for forensic analysis. Our system utilizes the record and replay technique of Panda to obtain the execution traces of the whole system. HProve instruments the provenance code in the replay phase to obtain causality dependencies among behaviors of kernel malware and impacts on the victim system.
Kernel Monitoring: Kernel monitoring helps to understand the exact execution of the whole system. DRIP [20] is a framework for purifying trojaned kernel drivers. It records all kernel API invocations from the driver to the kernel, aim at eliminating malicious effects from the driver. Gateway [41] isolates all drivers from the kernel code by creating a separate address space for drivers to monitor the interaction of drivers with the core kernel. It records kernel APIs invocation by drivers to monitor the untrusted kernel-mode execution. Starting from the interface of system calls, the exported kernel APIs, and the data structure definitions for kernel driver developers, AutoTap automatically tracks kernel objects, resolves their kernel execution context, and associates the accessed context with the objects [47]. Note that AutoTap does not build connections among these objects or the causality dependencies among the objects and the subjects that access them.HProve is capable of monitoring some kernel functions to backtrack causality dependencies among kernel malware behaviors and impacts on the victim system.
8. Conclusion
We develop HProve, a hypervisor level provenance tracing system that can backtrack the causality dependencies among impacts on a victim system and kernel malware behaviors. It is capable of understanding the kernel APIs triggered and the objects manipulated by kernel malware. HProve is a new system that provides the capability of replaying kernel malware attack story for provenance tracing. Such hypervisor level technique is needed in current cloud computing environment, especially for large enterprises. Due to the limitations ofHProve discussed in Sec. 6, more efficient designs for kernel malware provenance are still highly needed.
References
[1] An analysis of a windows kernel-mode vulnerability (cve-2014-4113). http://blog.trendmicro.com/ trendlabs-security-intelligence/an-analysis-
of-a-windows-kernel-mode-vulnerability-cve-2014-4113/.
[2] Analysis of cve-2015-2360–duqu 2.0 zero day vul-nerability. http://blog.trendmicro. com/trendlabs-
security-intelligence/analysis-of-cve-2015-2360-duqu-2-0-zero-day-vulnerability/.
[3] Dissecting turla rootkit malware using dynamic analysis.
https://www.lastline.
com/labsblog/dissecting-turla-rootkit-malware-using-dynamic-analysis/. [4] Dkom(direct kernel objectmanipulation). https:
//www.blackhat. com/presentations/win-usa-04/bh-win-04-butler.pdf.
[5] Linux audit system. https://wiki.archlinux.org/ index.php/Audit_framework.
[6] Operation pawn storm ramps up its activities; targets nato, white house. http://blog.trendmicro.com/
trendlabs-security-intelligence/operation- pawn-storm-ramps-up-its-activities-targets-nato-white-house/.
[7] Unmasking kernel exploits. https:// www.lastline.
com/labsblog/unmasking-kernel-exploits/.
[8] Ma, S, Lee, K., Kim, C., Rhee, J., Zhang, X., and Xu, D. Accurate, low cost and instrumentation-free
security audit logging for windows. In Proceedings of Annual Computer Security Applications Conference (ACSAC), pages 401–410, 2011.
[9] Aristide, F. , Andrea, L., Davide, B., and Engin, K.
Hypervisor-based malware protection with AccessMiner.
Computers & Security, 9 April 2015.
[10] Bahram, S., Jiang, X., Wang, Z., Grace, M., Li, J., Srinivasan, D.,Rhee, J., andXu, D. Dksm: Subverting
virtual machine introspection for fun and profit. In
Proceedings of IEEE Symposium on Reliable Distributed Systems (SRDS), pages 82–91, 2010.
[11] Bates, A.,Pohly, D.,Butler, K.,Wang, C.,Guan, Y., and Kasera, S. Secure and Trustworthy Provenance Collection for Digital Forensics, pages 141–176. 2016.
[12] Bates, A., Tian, D., Butler, K., and Moyer, T.
Trustworthy whole-system provenance for the linux kerne. InUSENIX Security, pages 319–334, 2015. [13] Carbone, M.,Cui, W.,Lu, L.,Lee, W.,Peinado, M., and
Jiang, X. Mapping kernel objects to enable systematic
integrity checking. In Proceedings of ACM Conference
on Computer and Communications Security (CCS), pages
555–565, 2009.
[14] Dolan-Gavitt, B., Hodosh, J., Hulin, P., Leek, T., and Whelan, R.Repeatable reverse engineering with panda.
InProceedings of the 5th Program Protection and Reverse Engineering Workshop, pages 4:1–4:11, 2015.
[15] Dolan-Gavitt, B., Leek, T., Hodosh, J., and Lee, W.
Tappan zee (north) bridge: mining memory accesses for introspection. In Proceedings of ACM Conference
on Computer and Communications Security (CCS), pages
[16] Dovgalyuk, P., Dmitriev, D., andMakarov, V. Don’t
panic: Reverse debugging of kernel drivers. In
Proceedings of the 2015 10th Joint Meeting on Foundations of Software Engineering, ESEC/FSE 2015, pages 938–941, 2015.
[17] Dunla, G.,Lucchetti, D.,Dominic, G.,Fetterman, M.,
andChen, P. Execution replay of multiprocessor virtual
machines. In Proceedings of ACM SIGPLAN/SIGOPS International Conference on Virtual Execution Environ-ments (VEE), pages 121–130, 2008.
[18] Dunlap, G., King, S. T., Cinar, S., Basrai, M. A.,
and Chen, P. M. Revirt: Enabling intrusion analysis
through virtual-machine logging and replay. In
USENIX Symposium on Operating Systems Design and Implementation (OSDI), pages 211–224, 2002.
[19] Garfinkel, T. andRosenblum, M. A virtual machine
introspection based architecture for intrusion detection. InProceedings of Network and Distributed System Security
Symposium (NDSS), pages 191–206, 2003.
[20] Gu, Z., Sumner, W. N., Deng, Z., Zhang, X., and Xu, D. Drip: A framework for purifying trojaned
kernel drivers. In IEEE/IFIP International Conference on Dependable Systems and Networks (DSN), pages 1–12, 2013.
[21] Jiang, X., Wang, X., and Xu, D. Stealthy malware
detection through vmm-based out-of-the-box semantic view reconstruction. InProceedings of ACM Conference
on Computer and Communications Security (CCS), pages
128–138, 2007.
[22] Kruegel, C.,Robertson, W., andVigna, G. Detecting
kernel-level rootkits through binary analysis. In
Proceedings of Annual Computer Security Applications Conference (ACSAC), pages 91–100, 2004.
[23] Lanzi, A., Sharif, M., andLee, W. K-tracer: A system
for extracting kernel malware behavior. InProceedings of Network and Distributed System Security Symposium (NDSS), 2009.
[24] Lee, K., Zhang, X., and Xu, D. High accuracy attack
provenance via binary-based execution partition. In
Proceedings of Network and Distributed System Security
Symposium (NDSS), 2013.
[25] Lee, K.,Zhang, X., andXu, D.Loggc: garbage collecting
audit log. InProceedings of ACM Conference on Computer
and Communications Security (CCS), pages 1005–1016,
2013.
[26] Li, J., Wang, Z., Jiang, X., Grace, M., and Bahram, S. Defeating return-oriented rootkits with "return-less"
kernels. InEuroSys, pages 195–208, 2010.
[27] Liang, Z.,Yin, H., andSong, D.Hookfinder: Identifying
and understanding malware hooking behaviors. In
Proceedings of Network and Distributed System Security
Symposium (NDSS), pages 41–57, 2008.
[28] Litty, L. and Lagar-Cavilla, H. A. Hypervisor
support for identifying covertly executing binaries. In
Proceedings of the 17th Conference on Security Symposium, pages 243–258, 2008.
[29] Ma, S., Zhang, X., and Xu, D. Protracer: towards
practical provenance tracing by alternating between logging and tainting. In Proceedings of Network and Distributed System Security Symposium (NDSS), 2016.
[30] Malyugin, V.,Sheldon, J., Venkitachalam, G., Weiss-man, B., andXu, M. Retrace: Collecting execution trace
with virtual machine deterministic replay. InProceedings of the Third Annual Workshop on Modeling, Benchmarking and Simulation, 2007.
[31] Oliveira, D., Crandall, J., Wassermann, G., Wu, S.F., Su, Z., and Chong, F. Execrecorder: Vm-based
full-system replay for attack analysis and full-system recovery. In Proceedings of the 1st Workshop on Architectural and
System Support for Improving Software Dependability,
pages 66–71, 2006.
[32] P. M. ChenandB. D. Noble. When virtual is better than
real [operating system relocation to virtual machines]. In
Proceedings Eighth Workshop on Hot Topics in Operating Systems, pages 133–138, 2001.
[33] Pei, K., Gu, Z, Saltaformaggio, B., Ma, S., Wang, F., Zhang, Z., Si, L., Zhang, X., and Xu, D. Hercule:
Attack story reconstruction via community discovery on correlated log graph. InProceedings of Annual Computer
Security Applications Conference (ACSAC), pages 583–
595, 2016.
[34] Pohly, D.,McLaughlin, S.,McDaniel, P., andButler, K.
Hi-fi: Collecting high-fidelity whole-system provenance. InProceedings of Annual Computer Security Applications Conference (ACSAC), pages 259–268, 2012.
[35] Ren, S., Tan, L., Li, C., Xiao, Z., and Song, W.
Samsara: Efficient deterministic replay in multiprocessor environments with hardware virtualization extensions.
In Proceedings of USENIX Annual Technical Conference
(ATC), pages 551–564, 2016.
[36] Rhee, J., Riley, R., Xu, D., and Jiang, X. Defeating
dynamic data kernel rootkit attacks via vmm-based guest-transparent monitoring. In 2009 International Conference on Availability, Reliability and Security, pages 74–81, 2009.
[37] Rhee, J.,Xu,D. Riley,R., andJiang, X. Kernel malware
analysis with un-tampered and temporal views of dynamic kernel memory. InProceedings of International Symposium on Research in Attacks, Intrusions and Defenses (RAID), pages 178–197, 2010.
[38] Riley, R., Jiang, X., and Xu, D. Guest-transparent
prevention of kernel rootkits with vmm-based memory shadowing. InProceedings of International Symposium on Research in Attacks, Intrusions and Defenses (RAID), pages 1–20, 2008.
[39] Riley, R.,Jiang, X., andXu, D. Multi-aspect profiling of
kernel rootkit behavior. InEuroSys, pages 47–60, 2009. [40] Rudd, E.,Rozsa, A.,Gunther, M., andBoult, T.A survey
of stealth malware: Attacks, mitigation measures, and steps toward autonomous open world solutions. IEEE Communications Surveys Tutorials, PP(99):1–28, 2016. [41] Srivastava, A. and Giffin, J. Efficient monitoring
of untrusted kernel-mode execution. In Proceedings of Network and Distributed System Security Symposium (NDSS), 2011.
[42] Wang, Z and Jiang, X. Hypersafe: A lightweight
approach to provide lifetime hypervisor control-flow integrity. InProceedings of IEEE Symposium on Security and Privacy (S&P), pages 380–395, 2010.
[43] Wang, Z.,Jiang, X.,Cui, W., andWang, X. Countering
discovery. InProceedings of International Symposium on Research in Attacks, Intrusions and Defenses (RAID), pages 21–38, 2008.
[44] Xu, Z., Wu, Z., Li, Z., Jee, K.,Rhee, J., Xiao, X.,Xu, F., Wang, H., andJiang, G.High fidelity data reduction for
big data security dependency analyses. InProceedings of ACM Conference on Computer and Communications Security (CCS), pages 504–516, 2016.
[45] Xuan, C., Copeland, J., and Beyah, R. Toward
revealing kernel malware behavior in virtual execution environments. InProceedings of International Symposium on Research in Attacks, Intrusions and Defenses (RAID), pages 304–325, 2009.
[46] Yan, L.,Jayachandra, M.,Zhang, M., andYin, H. V2e:
Combining hardware virtualization and softwareemula-tion for transparent and extensible malware analysis. In
Proceedings of ACM SIGPLAN/SIGOPS International Con-ference on Virtual Execution Environments (VEE), pages 227–238, 2012.
[47] Zeng, J., Fu, Y., and Lin, Z. Automatic uncovering
of tap points from kernel executions. InProceedings of International Symposium on Research in Attacks, Intrusions and Defenses (RAID), pages 49–70, 2016.
[48] Zhang, L., Shetty, S., Liu, P., and J. Jing. Rootkitdet: