http://www.sciencepublishinggroup.com/j/ijmea doi: 10.11648/j.ijmea.20180602.13
ISSN: 2330-023X (Print); ISSN: 2330-0248 (Online)
A New Detection Method for Oxygen, Nitrogen and
Hydrogen on Superalloy Milling Surfaces
Tao Sun
1, 2, *, Jin Liang
1, Dengwan Li
2, Ling Zhong
2, Chunyuan Gong
1 1State Key Laboratory for Manufacturing Systems Engineering, School of Mechanical Engineering, Xi’an Jiaotong University, Xi’an, China 2
Sichuan Province Engineering Laboratory for Superalloy Cutting Technology, Sichuan Engineering Technical College, Deyang, China
Email address:
*Corresponding author
To cite this article:
Tao Sun, Jin Liang, Dengwan Li, Ling Zhong, Chunyuan Gong. A New Detection Method for Oxygen, Nitrogen and Hydrogen on Superalloy Milling Surfaces. International Journal of Mechanical Engineering and Applications. Vol. 6, No. 2, 2018, pp. 29-34.
doi: 10.11648/j.ijmea.20180602.13
Received: March 25, 2018; Accepted: April 18, 2018; Published: May 15, 2018
Abstract:
Oxygen, nitrogen and hydrogen from air greatly affect the surface quality of milled superalloys—a difficult-to-cut material. Here, we described a novel infrared-thermal conductivity method to measure oxygen, nitrogen and hydrogen on superalloy surfaces during milling. A milling experimental program was projected via the uniform design method—this contained a qualitative factor. The quadratic regression model of the superalloy was established using the best regression subset method. Here, the cutting speed, feed per tooth, axial cutting depth, radial cutting depth, and tool nose radius were the independent variables. The results were feasible with an acceptable regression effect.Keywords:
Superalloy, Oxygen, Nitrogen, Hydrogen, Detection Method1. Introduction
The aero-engine is a core part of an aircraft. It is often called the pearl on the crown of aviation. Superalloys are generally used in the manufacture of aero-engine components, such as turbine blades, combustors, and high-pressure turbines. They have excellent high-temperature strength, thermal stability, and resistance to corrosion under severe service environments [1].
Superalloys have very strict quality requirements during production. The blank superalloy is obtained by a near-net forming method, such as precision forging [2], integral precision casting [3], single crystal casting [4], isothermal forging [5], hot isostatic pressing [6], or powder metallurgy [7]. These are then finished via precision machining, such as by computerized numerical control (CNC) milling. During the superalloy precision milling process, large quantities of heat are generated due to the drastic plastic deformation and severe friction. The low thermal conductivity characteristics of the superalloys lead to a high cutting temperature (1000°C) and a narrow cutting range [8]. Thus, oxygen, nitrogen and hydrogen in the air intrude on the cutting interface at high
temperatures. They will react with the titanium, chromium, and other elements in the material to form compounds with low melting points or eutectic points (hereafter referred to as inclusions).
These inclusions degrade the mechanical properties at high temperature [9-10] in two ways. First, small, hard, and brittle inclusions with sharp edges will produce stress concentrations after long-term use—this initiates cracks [11]. Second, oxygen, nitrogen and hydrogen may gather on the surface to react with titanium and chromium, leading to the segregation of alloying elements on the freshly machined surface. This weakens the surface strength and initiates cracks on the surface [12]. Therefore, oxygen, nitrogen and hydrogen are considered harmful, and their elemental contents are strictly controlled. For instance, the nitrogen content is held below 0.2% [13-14] to enhance fatigue and creep failure resistance as well as durability during the smelting and forging processes. Nevertheless, only a few studies have focused on methods to decrease oxygen, nitrogen and hydrogen contents to control the surface quality during cutting. No papers have measured oxygen, nitrogen and hydrogen effectively.
uniform design method. The surface oxygen, nitrogen and
hydrogen contents were measured based on the
infrared-thermal conductivity method. Statistical models were used due to difficulties in building a physical model of surface oxygen, nitrogen and hydrogen contents [15]. A quadratic model was proposed to fit the experimental data. The veracity of the measurement and the feasibility of the detection method were verified via regression analysis.
2. Materials and Method
2.1. Experimental Design
There are six cutting parameters in the design of
experiments: cutting speed, vc (30–60 m/min, arithmetically
divided into six levels); feed per tooth, fz (0.1–0.2 mm/z,
arithmetically divided into six levels); radial cutting depth, ae
(2–12 mm, arithmetically divided into six levels); axial cutting
depth, ap(0.5–1.0 mm, arithmetically divided into six levels);
tool nose radius, rε(0.8 mm, 1.2 mm, and 1.6 mm); and the
material of the cutting blade A (pseudo-variable design factor).
The WIDIA and Zhuzhou cutting tools are represented as A1
(A1 = 1, A2= 0) and A2 (A1= 0, A2= 1), respectively. Thus, all parameters must be optimized, but the total number of experiments becomes very large when all six parameters are considered. The uniform design method is a good method to reduce the number of experiments—it is considered a qualitative factor to design milling tests [16]. Following repeated optimization computations using the Uniform Design Software 5.0, an experimental program with minimum central deviation containing a qualitative factor is projected (Table 1).
Terms ωO, ωN and ωH are the surface oxygen, nitrogen and
hydrogen contents, respectively.
Table 1. Uniform design test and results of the superalloy in milling.
NO. vc [m/min] fz [mm/z] ae[mm] ap [mm] rε [mm] A1 A2 ωO [%] ωN[%] ωH [%]
1 48 0.10 8 0.8 1.2 1 0 0.0027 0.0674 0.0027
2 30 0.14 10 1.0 1.6 1 0 0.0072 0.0802 0.0042
3 36 0.18 10 0.5 0.8 1 0 0.0210 0.0665 0.0108
4 60 0.20 12 0.8 1.6 0 1 0.0044 0.0207 0.0015
5 36 0.20 6 0.7 0.8 0 1 0.0116 0.0525 0.0061
6 42 0.16 2 0.9 1.2 0 1 0.0161 0.1020 0.0025
7 42 0.16 4 0.7 1.6 1 0 0.0179 0.0995 0.0064
8 30 0.10 6 0.6 1.2 0 1 0.0231 0.1350 0.0057
9 60 0.12 2 0.6 0.8 1 0 0.0107 0.2430 0.0051
10 54 0.14 8 0.5 1.6 0 1 0.0128 0.0239 0.0062
11 48 0.12 12 0.9 0.8 0 1 0.0140 0.0646 0.0035
12 54 0.18 4 1.0 1.2 1 0 0.0090 0.0441 0.0034
2.2. Experimental Procedure
This study used a NiCr16TiAl (Wuxi Chuantie Metal Material Co. Ltd., China) rod (Ni=71.35%, Cr=16.78%, Ti=1.96%, Al=1.54%, and Mn=1.51%; remaining balance contains Fe and other elements; Figure 1). The milling tests were performed along the top surface of the specimen via the dry down milling process—each specimen was used for two experiments. The samples' top surface was premachined with a larger axial depth of cut. This prevented the machined surface from scratching. The plunging cutter XDPT110408 (12/16) PDSRMM (German WIDIA Company) and APKT11T308 (12/16)-PM (Zhuzhou Cemented Carbide Group Co. Ltd., China) with uncoated carbide inserts were used in these experiments (Figure 2). The diameter of the plunging center is 16 mm with two teeth. Only one insert was used to avoid interference of the inserts. A new insert was used in each cut to avoid tool wear affecting surface integrity. The VDL-850D Vertical Machining Center (Dalian Machine Tool Group, China) was used for milling tests.
Figure 1. Sample for the milling test (color online only).
2.3. Data Measurement Procedure
The infrared-thermal conductivity method detected oxygen, nitrogen and hydrogen. It has good sensitivity and stability. It is traceable and easily automated, which makes it practical for high throughput inspection. Here, a sample is placed in a graphite crucible and then melted in an electrode oven under helium. Oxygen from the sample is reduced to carbon dioxide with carbon and is detected by infrared absorption method. Nitrogen from the sample is decomposed into the gaseous state and is detected via a thermal conductivity method. Hydrogen is also resolved into the gaseous state. It is then reduced to water vapor with hot copper oxide and detected via an infrared absorption method.
However, the infrared-thermal conductivity method has strict demands, and the samples are generally processed to a regular 1-gram cylinder. After milling, the superalloy is finished into a regular detection sample. This requires a working procedure of line cutting, polishing, and cleaning. Thus, the preparatory detection is challenging. Otherwise, the oxygen, nitrogen and hydrogen coming from the air are concentrated on the newly finished superalloy surface. The distribution of these elements in the material is not uniform, and this leads to severe distortion in the results. The new surface is simultaneously formed with a new chip surface under milling. The thickness of the chips is relatively small
because the fz and ap are small; thus, the oxygen, nitrogen and
hydrogen contents of the chip surfaces are theoretically the
same as the newly finished surface. Thus, the oxygen, nitrogen and hydrogen contents of the superalloy's newly machined surface are indirectly detected via the oxygen, nitrogen and hydrogen chip contents.
After each test, the chips were immediately collected and sealed in three bags. We confirmed that the weight of the chips in each bag was more than one gram. The surface oxygen, nitrogen and hydrogen content measurements were performed in triplicate using the ONH836 oxygen/nitrogen/hydrogen Elemental Analyzer (America Leco Company). The average value of the three measurements was used. All data are listed in Table 1. To ensure accuracy, the ONH836 elemental analyzer was calibrated with a NiCr16TiAl sample containing oxygen, nitrogen and hydrogen; the specimen was supplied by AVIC Beijing Institute of Aeronautical Materials.
3. Results and Discussions
3.1. Quadratic Fit Model
Based on the experimental data, the unknown regression coefficients were determined using Uniform Design Software
5.0, and the empirical equations were used to estimate the ωO,
ωN, and ωH considering the following input process
parameters: vc, fz, ae, ap, rε, and A. The quadratic polynomial
equations for the ωO, ωN, and ωH response variables are
expressed as follows:
2 1 1 2 1 2 1 1
0.0072 0.0194( 0.75) 0.0019 0.0001( 45) 0.0001 ( 45)
0.0543 ( 0.15) 0.0002( 7) 0.0056( 7)( 1.19) 0.0013 ( 7)
0.0061 ( 1.19)
0.0729 0.0134 0.0184( 45)( 1.19) 14.815
= − − − + − + −
+ − + − − − − − −
+ −
= − − − − +
O p c c
z e e e
N c
a A v A v
A f a a r A a
A r
A v r
ε ε ε ω ω 2 2 1 1 1 2 0( 0.15)
5.0021( 0.15)( 0.75) 0.2738 ( 0.15) 0.0161( 7)( 0.75)
0.3067 ( 0.75)
0.0039 0.0014 0.0047( 0.75) 0.1099( 0.15)( 1.19)
0.0453 ( 0.15) 0.0166 ( 0.15) 0.0007(
− + − − + − − − − − − = + − − − − − + − − − + − z
z p z e p
p
H p z
z z e
f
f a A f a a
A a
A a f r
A f A f a
ε
ω
2
1 1
7)( 0.75)
0.0001 ( 7) 0.0056 ( 0.75) 0.0038( 1.19)
− + − − − + − p e p a
A a A a rε
(1)
The P values and fit error of the quadratic fit models are
listed in Table 2. The P value is the probability of obtaining a
test statistic that is at least as extreme as the actual calculated value. Smaller P values indicate a better correlation. Items with
P values lower than 0.05 are closely related. The fit model is
updated according to the P value, which represents the
statistical significance. If the P value of the item in the quadratic model is higher than 0.05, then this item is removed from the quadratic model, and the fit process was performed again. Finally, quadratic fit models were obtained as Eq. 1. The fit precision of the quadratic fit model was higher indicating that the quadratic regression model was credible (Table 2).
3.2. Fit Precision and Significance
The F-test determines the critical value if a significance level α is given. The significance of the fit models or the
significance of the regression coefficients can be judged by comparing the F value with the critical value. Here, a significance level of α=0.03 was considered to be the critical
value of F0.03(10,1)=672.55. This F-test was followed by
analysis of variance (ANOVA) to validate the model precision of ωO, ωN, and ωH (Table 3). Table 3 exhibited a larger F value for all the fit models compared to the critical value. This indicates that the regression effect of the models was
significant. The R2determines the fit precision and higher R2
values imply higher fit precision. All models in Table 3 had an
R2 value varying from 0.999 to 1.000. This implied that the input variables were closely related to the response variables.
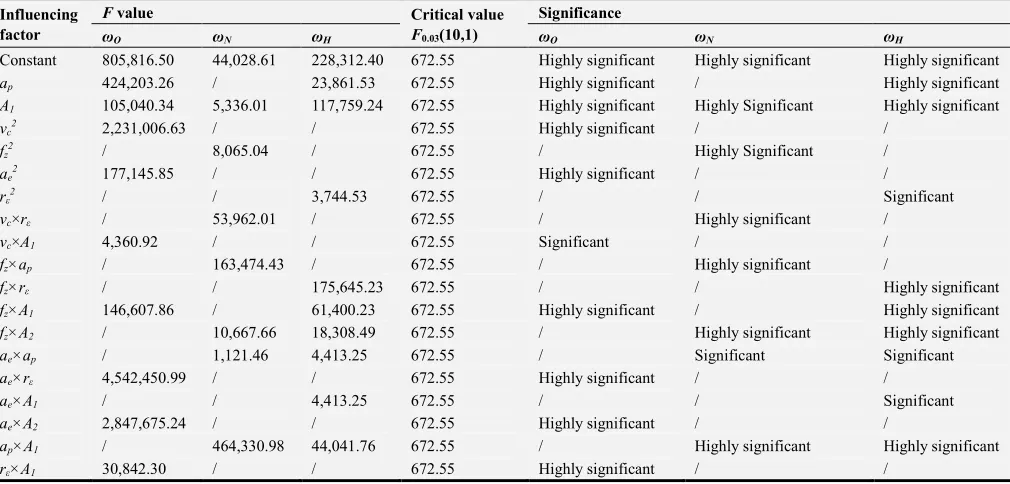
The F values of the mono factor and their interactions are
listed in Table 4; the multiplication sign represents the interactions of the cutting parameters. The significance of the
Table 2 and the F value in Table 4. If the P value is between 0.01 and 0.05, then the significance is considered to be strong. Values below 0.01 are very significant. Table 5 shows the
factors that most strongly influence the surface oxygen,
nitrogen and hydrogen contents as judged by the P and F
values.
Table 2. P value of Eq. 1 in the quadratic fit model.
Item P value
Constant ap A1 vc2 fz2 ae2 rε2 vc×rε vc×A1 fz×ap
ωO 0.000 0.000 0.000 0.000 / 0.000 / / 0.010 /
ωN 0.003 / 0.009 / 0.007 / / 0.003 / 0.000
ωH 0.000 0.004 0.000 / / / 0.010 / / /
Item fz×rε fz×A1 fz×A2 ae×ap ae×rε ae×A1 ae×A2 ap×A1 rε×A1 Fit model
ωO / 0.000 / / 0.000 / 0.000 / 0.004 0.000
ωN / / 0.006 0.019 / / / 0.000 / 0.000
ωH 0.000 0.003 0.005 0.010 / 0.011 / 0.003 / 0.000
Table 3. ANOVA results.
Item Source Regression Residual Total
ωO
Sum of squares 0.0004 0 0.0004
Mean square 0 0 /
F value 100,000,000.00 / /
Multiple regression correlation coefficients R2 0.9999
ωN
Sum of squares 0.0396 0 0.0396
Mean square 0.0040 0 /
F value 162,440.50 / /
Multiple regression correlation coefficients R2 0.9998
ωH
Sum of squares 0.0001 0 0.0001
Mean square 0 0 /
F value 100,000,000.00 / /
Multiple regression correlation coefficients R2 0.9997
Table 4. Factors affecting the surface oxygen, nitrogen and hydrogen contents of the superalloy.
Influencing factor
F value Critical value
F0.03(10,1)
Significance
ωO ωN ωH ωO ωN ωH
Constant 805,816.50 44,028.61 228,312.40 672.55 Highly significant Highly significant Highly significant
ap 424,203.26 / 23,861.53 672.55 Highly significant / Highly significant
A1 105,040.34 5,336.01 117,759.24 672.55 Highly significant Highly Significant Highly significant
vc2 2,231,006.63 / / 672.55 Highly significant / /
fz2 / 8,065.04 / 672.55 / Highly Significant /
ae2 177,145.85 / / 672.55 Highly significant / /
rε2 / / 3,744.53 672.55 / / Significant
vc×rε / 53,962.01 / 672.55 / Highly significant /
vc×A1 4,360.92 / / 672.55 Significant / /
fz×ap / 163,474.43 / 672.55 / Highly significant /
fz×rε / / 175,645.23 672.55 / / Highly significant
fz×A1 146,607.86 / 61,400.23 672.55 Highly significant / Highly significant
fz×A2 / 10,667.66 18,308.49 672.55 / Highly significant Highly significant
ae×ap / 1,121.46 4,413.25 672.55 / Significant Significant
ae×rε 4,542,450.99 / / 672.55 Highly significant / /
ae×A1 / / 4,413.25 672.55 / / Significant
ae×A2 2,847,675.24 / / 672.55 Highly significant / /
ap×A1 / 464,330.98 44,041.76 672.55 / Highly significant Highly significant
rε×A1 30,842.30 / / 672.55 Highly significant / /
Table 5. The impact of different factors on the surface oxygen, nitrogen and hydrogen contents in the superalloy.
Item Ranking
ωO ae×rε > ae×A2 > vc2 > ap > ae2 > fz×A1 > A1 > rε×A1 > vc×A1 ωN ap×A1 > fz×ap > vc×rε> fz×A2 > fz2 > A1> ae×ap
3.3. Analysis of Model Error
The oxygen, nitrogen and hydrogen contents in the chip and machined surface were most strongly related to cutting temperature. The highest temperature was located at the root of the cutting edge contacting with the chip, and the other area of the chip had a higher temperature due to its slow cooling rate, which made the temperature of the chip much higher than the machined surface. Thus, the detection method for the oxygen, nitrogen and hydrogen had some errors. In addition, a cutting tool with a large tool nose radius would increase the temperature, leading to a increase of the solubility of the oxygen, nitrogen and hydrogen theoretically, but the large tool nose was poorly coordinated with other cutting parameters, and thus lowered the impact on the results to some extent. Although there were some errors in experimental results, the fit precision and significance of the models were high. Therefore, the measurement method was feasible and could be used to guide the practical production of superalloys.
4. Conclusions
This subject of this study consisted in the new detection method for oxygen, nitrogen and hydrogen on superalloys milling surface, and in a careful analysis of results by statistical methods. The following items may be emphasized.
(1)The oxygen, nitrogen and hydrogen contents of the
machined surface were indirectly detected as oxygen, nitrogen and hydrogen in the chip. Although this detection method had theoretical error, it was suitable for rapid and practical testing.
(2)In this study, a uniform test containing a qualitative
factor was designed and conducted. A mathematical model for surface oxygen, nitrogen and hydrogen content was developed via an optimal subset regression method. This made the regression effect significant and implied that the experimental results were precise and credible.
(3)ANOVA data showed that the interaction between radial
cutting depth and tool nose radius had the most significant impact on the surface oxygen content. Similarly, the axial cutting depth using the WIDIA milling tooth had the most significant effect on surface nitrogen, and the interaction between the feed per tooth and the tool nose radius had the strongest influence on the surface hydrogen content.
Acknowledgements
This work was supported by the National Natural Science Foundation of China (Grant number 51675404, 51421004) and the Key Technology R&D Program of Sichuan Province, China (Grant number 2014RZ0048). We also thank LetPub (www.letpub.com) for its linguistic assistance during the preparation of this manuscript. Comments from the anonymous reviewers are also greatly appreciated.
References
[1] Ezugwu, E. O. (2004). High Speed Machining of Aero-Engine Alloys. Journal of the Brazilian Society of Mechanical Sciences & Engineering 26(1), 1-11.
[2] Wu, R. H. and K. C. Pang (2007). Computer Simulation on Formation of Precision Forgings of Titanium Alloy and Superalloy. Materials Science Forum 539-543, 3130-3135.
[3] Sun C., W. Shang, J. Zhou and B. Li (2014). Numerical Simulation and Process Optimization of Superalloy Integral Precision Investment Casting Diffuser. Materials Science Technology 22(1), 100-104.
[4] Seo, S. M., I. S. Kim, J. H. Lee, C. Y. Jo, H. Miyahara and K. Ogi (2009). Grain Structure and Texture Evolutions during Single Crystal Casting of the Ni-Base Superalloy CMSX-4. Metals & Materials International 15(3), 391-398.
[5] Mignanelli, P. M., N. G. Jones, K. M. Perkins, M. C. Hardy and H. J. Stone (2015). Microstructural Evolution of a Delta Containing Nickel-Base Superalloy during Heat Treatment and Isothermal Forging. Materials Science & Engineering A 621, 265-271.
[6] Qiu, C. L., M. M. Attallah, X. H. Wu and P. Andrews (2013). Influence of Hot Isostatic Pressing Temperature on Microstructure and Tensile Properties of a Nickel-Based Superalloy Powder. Materials Science & Engineering A 564(3), 176-185.
[7] Yang, H., R. Bao, J. Zhang, L. Peng and B. Fei (2011). Crack Growth Behaviour of a Nickel-Based Powder Metallurgy Superalloy under Elevated Temperature. International Journal of Fatigue 33(4), 632-641.
[8] Thakur, A. and S. Gangopadhyay (2016). State-of-the-art in Surface Integrity in Machining of Nickel-Based Super Alloys. International Journal of Machine Tools & Manufacture 100, 25-54.
[9] Jang, C., D. Kim, D. Kim, I. Sah, W. S. Ryu and Y. S. Yoo (2011). Oxidation Behaviors of Wrought Nickel-Based Superalloys in Various High Temperature Environments. Transactions of Nonferrous Metals Society of China 21(7), 1524-1531.
[10] Baldan, R., R. Guimarães, C. A. Nunes, S. B. Gabriel and G. C. Coelho (2015). Oxidation Behavior of the Niobium-Modified Mar-M247 Superalloy at 1000°C in Air. Oxidation of Metals 83(1-2), 151-166.
[11] Zhang, J. W., L. T. Lu, P. B. Wu, J. J. Ma, G. G. Wang and W. H. Zhang (2013). Inclusion Size Evaluation and Fatigue Strength Analysis of 35CrMo Alloy Railway Axle Steel. Materials Science & Engineering A 562(2), 211-217.
[12] Sun, C., Z. Lei, J. Xie and Y. Hong (2013). Effects of Inclusion Size and Stress Ratio on Fatigue Strength for High-Strength Steels with Fish-Eye Mode Failure. International Journal of Fatigue 48(48), 19-27.
[14] Durber, G. L. R. and M. Boneham (2013). Trace Element Control in Vacuum Induction and Consumable a Electrode Melted Ni Superalloys. Metal Science Journal 11(1), 428-437.
[15] Jiang, F., J. Li, L. Yan, J. Sun and S. Zhang (2010). Optimizing End-Milling Parameters for Surface Roughness under Different Cooling/Lubrication Conditions. International Journal of Advanced Manufacturing Technology 51(9-12), 841-851.