Research Article 191
Determination of the Physicochemical Changes
in the Different Vegetable Oils after Fat-Product Interaction
During Frying Process
Uslu, Nurhan; Özcan, Mehmet Musa*
+Department of Food Engineering, Faculty of Agriculture, Selçuk University, 42049 Konya, TURKEY
ABSTRACT:Determination of changes in physicochemical properties of different vegetable oils (sunflower, corn, hazelnut, palm, and olive oils) was aimed after the frying process with different frying material used (potato and pepper). The increase in free fatty acid content, peroxide value, viscosity and polar compound formation of oils was observed, while the reduction of the polyunsaturated fatty acid content of oils was detected with the increase of frying time. The minimum increase of free fatty acid content was determined in sunflower oil (for fried pepper %0.23; for fried potato %0.22), while the best result of peroxide values for both of frying samples was found in olive oil (for fried pepper 2.49 meq O2/kg; for fried potato 4.11 meq O2/kg oil).
The highest increase of total polar compound was also ascertained in sunflower oil (for fried pepper
%4.50; for fried potato %5.00). The increase of frying time caused a decrease of L* and a* values of oils except for olive oil and increase of b* values. The effect of frying oil or material and frying process time on physicochemical properties of oils was found statistically significant (p<0.01).
KEYWORDS: Physicochemical properties; Frying; Fatty acid composition; Olive oil.
INTRODUCTION
Deep-frying is one of the fast, easy and ancient methods for food preparations more than 4000 years [1]. After the frying process, fried foods have gained crispy texture, fried aroma and pleasant golden brown color, which have provided high popularity for consumer [2-3]. Additionally, heat and mass transfer take place simultaneously during the frying process [4]. Influencing factors of heat and mass transfer are termal and physicochemical properties of the fried product, the shape of food, using oil, the temperature of oil and pressure [5]. Oils have a critical role during the frying process not only being heat transfer medium but also absorbed by the foods.
Overuse of frying oils at high temperatures are exposed to many lipid reactions such as oxidation, polymerization and thermal degradation leading to changes in their physical, chemical, nutritional and sensory properties and resulting in loss of quality of both frying oil and fried food absorbed part of the frying oil [6]. Oxidation of oils present in foods causes reduction of the nutritious quality and deterioration of color and taste [7]. Thermoxidative degredation of the fatty acids has been related to the unsaturation level of fatty acids, particularly α-linolenic acid [8]. The degradation both volatile and non-volatile compounds, including free fatty acids, lactones,
* To whom correspondence should be addressed. +E-mail: [email protected]
hydrocarbons, diacylglycerols, monoacylglycerols, glycerols, cyclic and epoxy compounds, trans isomers, monomers and polymers of triacylglycerols can form during the frying process [9]. Although the majority of the volatiles are lost at high temperatures, the non-volatile products accumulate in the frying oils, which cause further degradation and absorbed by the fried foods. Accordingly, the quality of the frying oils has great importance with regard to the quality of fried products and also affect human health [10]. Generally, most of the studies have investigated the changes in rapeseed oil, soybean oil, and olive oil or blended oils during the frying process. It is seen in previous studies where frying was done in various edible oils. Different kinds of fats were used for frying in this study because of the chemical structure of the oil affected by growing conditions, seed genetic structure, climatic factors, and etc. The innovation feature of this study was how the interaction between frying oil and product during frying effects the chemical properties of frying oil. The objective of this study was to evaluate the physical and chemical changes of various vegetable oils, such as sunflower, corn, hazelnut, riviera olive, and palm oils during the frying process and investigate the suitability of these several oils. Moreover, the affect of different frying materials (pepper and potato) on physicochemical properties of vegetable oils was determined.
EXPERIMENTAL SECTION
Frying oils (sunflower, corn, hazelnut, palm, and riviera olive oils) were obtained from the local market in Konya, Turkey. Potatoes, belonging Agria variety, and peppers, belonging Çarliston variety, were purchased from the local grocery store in Konya, Turkey.
Preparation of samples
Potatoes were peeled, washed and sliced (1.0 x 1.0 x 6.0 cm) with slicing machine. Peppers were also washed, cleaned the seeds and cut into slices (1.0 x 6.0 cm) manually.
Frying Process
Frying experiments were carried out using an electric fryer (Moulinex, France) equipped with a thermostat. The oils were placed (2L) and preheated at the set temperature (180ᵒC) which controlled with infrared termometer
(Testo 845) before a given frying trial. In every frying process, 200g of frying materials was placed in a fryer and frying was performed at 180ᵒC for 5 min. The frying process was repeated 12 times at intervals of 10 min using new potatoes in the same oil. Successive frying was carried out for 3 h, giving a total of 12 batches for potatoes. Same procedures were applied for pepper. After each frying sessions, oils (50 ml) were filtered through a Whatman no 1 filter (Maidstone, UK) and placed in glass bottles and kept at +4ᵒC until analyses.
Color analyses
Color values were measured with Minolta Chroma meter CR 400 (Konica Minolta, Inc. Osaka, Japan) according to the International Commission on Ilumination L*, a*, b* scale [11]. Oil samples were decanted to clear, glass petri plate (25ml) and analyzed 3 different points of oil on the white floor.
Viscosity analyses
Viscosity values of samples were measured using viscometer (AND SV-10) and denominated mPa.s. Viscosity values of palm oil were determined at 40ᵒC because of being solid form in room temperature, while viscosity values of other oils were determined at room temperature (25ᵒC).
Free fatty acids and peroxide values
Free fatty acids, expressed as a free oleic acid percentage, were determined using AOCS method [12]. Peroxide values, expressed in milliequivalents of active oxygen per kilogram, (meq O2/kg) were found according to the AOCS method [13].
Total polar compounds
Total polar compounds of oils were measured using Deep Frying Oil Tester (Testo 270) based on dielectric constant changes and determined on hot oil (180ᵒC). Before total polar compound measurement, oil tester was calibrated using the reference oil according to Khaled et al. [14].
Moisture content
Research Article 193 Fatty acid composition
Frying oils were esterificated according to ISO-5509 method with some modifications [15]. Fatty acid methyl esters of oil samples were analyzed gas chromatography (Shimadzu GC-2010) equipped with Flame-Ionization Detector (FID) and capillary column (Tecnocroma TR-CN100, 60m x 0.25mm, film thickness: 0.20µm). The carrier gas was nitrogen with 1.51mL/min flow rate. The temperature of dedector and injection block was 260ºC. The total flow rate was 80ml/min and the split rate was also 1/40. The column temperature was programmed 120ºC for 5 minutes and increased 240ºC at 4 ºC/min and held 25 minutes at 240ºC. A standard fatty acid methyl ester mixture (Sigma Chemical Co.) was used to determine sample peaks. Commercial mixtures of fatty acid methyl esters were used as reference data for the relative retention times [16].
Statistical analyses
Analyses of variance (three way ANOVA) and Student’s t multiple comparison test were performed to analyse the data according to the JMP package program [17]. All results are expressed as means ± standard deviation from triplicate experiments and each measurement was duplicated. Levels of significance, unless otherwise stated, were given as p≤0.01.
RESULTS AND DISCUSSION
The results of viscosity and free fatty acid of vegetable oils are given in Table 1. The viscosity values of frying oils did not show a regular increase or decrease when the frying replication number increased. However, the viscosities were higher than initial values after the frying process was applied 12 times. Viscosity values were affected by the use of different oils, but the frying materials -such as potato and pepper- did not change significantly. The minimum increase in viscosity was observed in riviera olive oil (0.6 -1.0 mPa.s) while the maximum increase was found in palm oil (10.2 -10.8 mPa.s). Additionally, viscosity values of sunflower and corn oils which have a high content of polyunsaturated fatty acids were found to be close to this. The same situation was observed in monounsaturated oils, such as riviera olive oil and hazelnut oil.
According to the study of Kim et al. [18] after the frying process (170ᵒC, 1 minute), viscosity values of
sunflower, corn, hazelnut and olive oils measured at 25ᵒC were determined at 44 mPa.s, 49 mPa.s, 63 mPa.s and 59 mPa.s, respectively. In the experiments reported by Tarmizi et al. [19], the viscosity of palm olein was found to be 45.48 mPa.s before the frying process, whereas it was detected at 55.97 mPa.s after the frying process was applied at 180ᵒC. Oxidation products, such as aldehydes, ketones, hydrocarbons, and many polymeric compounds, cause changes in viscosity [20]. The changes in temperature lead to different viscosity values [21]. Moreover, viscosity values of oils were affected by the existence of potato and the rate of potato/oil [22]. This investigation was in line with the results of Kim et al. [18]. Though viscosity values of palm oil were lower than shown by the results of Tarmizi et al. [19], the emerging increases in viscosity values were the same as they were measured at 40°C.
The results obtained using different vegetable oils showed an alteration, as frying materials, using potato or pepper, changed free fatty acid values of frying oils. It was determined that the free fatty acid values of oils increased with the rise in the frying replication number. Generally, free fatty acid values were found to be lower in oils fried potato. It was stated that this situation originates from the absorption of free fatty acids by potato starch [23]. Moreover, it can be due to the higher moisture content of pepper (95%) with respect to potato (79%). The minimum free fatty acid values were found in palm oil, while the highest values were determined in riviera olive oil for both frying materials.
Table 1: Viscosity and free fatty acid values of frying oils.
Materials Oils
Viscosity (mPa.s)
Control 6. Frying 12. Frying
Pepper
Sunflower 45.75 ± 0.26kl* 45.30 ± 0.14l 47.05 ± 0.14ıj
Hazelnut 51.15 ± 0.07f** 52.20 ± 0.07e 55.75 ± 0.11a
Corn 44.20 ± 0.21m 44.30 ± 0.28m 46.50 ± 0.12jk
Palm 37.10 ± 0.14o 38.95 ± 1.63n 47.30 ± 0.57hı
Olive 54.55 ± 0.07bc 55.20 ± 0.14ab 55.15 ± 0.21ab
Potato
Sunflower 45.75 ± 0.71kl 46.15 ± 0.07k 48.60 ± 0.07g
Hazelnut 51.15 ± 0.13f 53.60 ± 0.21d 55.20 ± 0.07ab
Corn 44.20 ± 0.21m 46.95 ± 0.07ıj 46.95 ± 0.07ıj
Palm 37.10 ± 0.14o 39.05 ± 0.42n 47.90 ± 0.71gh
Olive 54.55 ± 0.07bc 53.85 ± 0.35cd 55.55 ± 0.07a
Materials Oils
Free Fatty Acids (%)
Control 6. Frying 12. Frying
Pepper
Sunflower 0.22 ± 0.03gh 0.34 ± 0.17efgh 0.45 ± 0.31defg
Hazelnut 0.23 ± 0.04gh 0.53 ± 0.08def 0.61 ± 0.14cde
Corn 0.34 ± 0.16efgh 0.45 ± 0.06defg 0.67 ± 0.02bcd
Palm 0.11 ± 0.06h 0.45 ± 0.06defg 0.45 ± 0.08defg
Olive 0.56 ± 0.21def 0.88 ± 0.01abc 1.10 ± 0.05a
Potato
Sunflower 0.22 ± 0.03gh 0.33 ± 0.02fgh 0.44 ± 0.04defg
Hazelnut 0.23 ± 0.04gh 0.41 ± 0.08defg 0.56 ± 0.36def
Corn 0.34 ± 0.16efgh 0.45 ± 0.02defg 0.61 ± 0.13cde
Palm 0.11 ± 0.06h 0.34 ± 0.01efgh 0.34 ± 0.15efgh
Olive 0.56 ± 0.21def 0.91 ± 0.18ab 0.90 ± 0.18ab
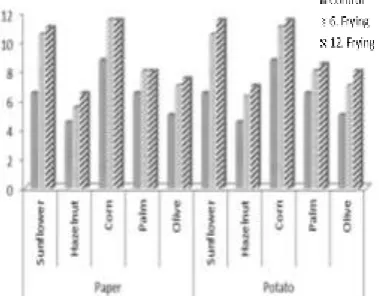
when subject to the frying process for a long time [27]. Total polar compounds of control and post-frying (after three hours) oils with respect to the results of the multiple comparison tests were 6.50 -11.00% in sunflower oil, 4.50 -6.50% in hazelnut oil, 8.75 -11.50% in corn oil, 6.50 -8.00% in palm oil and 5.00 -7.50% in riviera olive oil, in which potato was fried; 6.50 -11.50%, 4.50 -7.00%, 8.75 -11.50%, 6.50 -8.50% and 5.00 -8.00% respectively, when pepper was used (Fig. 1).
The frying materials used did not dramatically affect the total polar compounds of oils but different vegetable oils used changed the results of total polar compounds. After the frying process, the lowest total polar contents were observed in hazelnut oil and olive oil, while
Research Article 195
Fig. 1: Total polar compounds of pre-frying and post-frying oils.
Fig. 2: Peroxide values of pre-frying and post-frying oils.
2.43-5.97 meq O2/kg in corn oil, 1.00-4.13 meq O2/kg in palm oil and 3.45-5.94 meq O2/kg in riviera olive oil, when pepper was fried; 3.47-9.41 meq O2/kg, 2.74-9.54 meq O2/kg, 2.43-8.30 meq O2/kg, 1.00-5.42 meq O2/kg and 3.45-7.56 meq O2/kg respectively, when pepper was used. The use of potato or pepper as frying materials affected the peroxide values of frying oils (Fig. 2).
The results of peroxide values of potato fried in oils were determined to be higher than fried pepper. Furthermore, the minimum peroxide number was found in palm oil, which had a high content of saturated fatty acids, while sunflower oil had the maximum oxidized oil. The increase in unsaturated fatty acid content caused more oxidation of oil during the frying process, conducted in an aerobic environment and at high temperature. Peroxide values of oils showed increases when the frying replication number was raised. An increment in peroxide values also occurs, particularly during the cooling period. It has been shown that hydroperoxides recur in oils exposed to air at a high temperature in the cooling stage [29].
According to the study of Casal et al. [25], peroxide values of riviera olive oil and refined sunflower oil were 11.00 meq O2/kg and 28.00 meq O2/kg respectively. The value of hazelnut oil fried 15 times (190°C, 8 min.) was 10.84 meq O2/kg, while it was found to be 5.58 meq O2/kg and 5.85 meq O2/kg in corn oil and riviera olive oil, respectively [30]. As far as Ramli et al. [24] were concerned, peroxide values of palm olein, sunflower and corn oils after the fifth frying process at 180°C in 2.5 minutes, using potatoes were determined at 11.66 meq
O2/kg,24.32 meq O2/kg and 16.01 meq O2/kg, respectively. The results of peroxide values that were obtained were lower than the values mentioned in the literature because of probably beginning peroxide values of oils.
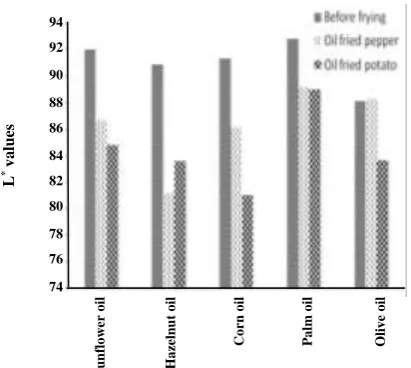
L* values showed a change together with the increase of the frying number, though these were higher than pre-frying. The brightness of oils decreased when fried 12 times (total of three hours) (Fig. 3). The minimum variation in L* values was determined in riviera olive oil for both frying materials.
The a* values of sunflower, hazelnut, corn, and palm oils decreased after the frying process, while a* values of riviera olive oil varied according to the frying materials (Fig. 4).
Using pepper as the frying material increased the a* values of olive oil, whereas the use of potato caused a reduction in the a* values of olive oil. However, a* values of palm oil were not significantly affected from frying product. The results of b* values showed a minor decrease in olive oil, but it was observed an increase in other oils (Fig. 5). Frying materials (potato and pepper) changed b* values in all of the oils. Nevertheless, variance in b* values were at a minimum level in palm oil based on frying materials.
Fig. 3: Interaction of frying oils and materials on L* values.
Fig. 4: Interaction of frying oils and materials on a* values.
of pigments into the oil lead to changes in the color of vegetable oils [31]. Unsaturated carbonyl compounds, or non-polar compounds of foodstuffs dissolved in oils, cause the color to darken [32]. Formation and accumulation of non-volatile degradation products change the color of frying oils [20]. According to Blumenthal [21], the reason for the formation of red color is combined oxidized fatty acids and pyrolytic condensation product, while combined peroxides and aldehydes -in addition to carotenoids and other compounds- lead to the yellow color.
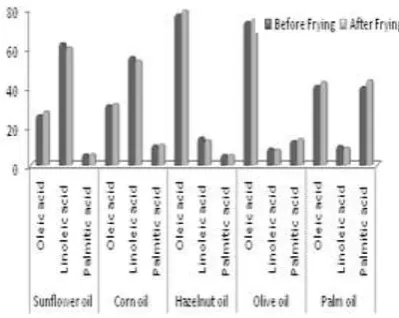
The fatty acid compositions of vegetable oils fried potato and pepper are demonstrated in Fig. 6 and Fig. 7, respectively.
Generally, the increase in the frying replication number of oils caused a decrease in the polyunsaturated fatty acids (linoleic acid and linolenic acid), while the increase in that of monounsaturated fatty acids, such as oleic acid, and saturated fatty acids, such as palmitic acid. Dominant fatty acids of sunflower oil were determined to be oleic acid (25.61%), linoleic acid (62.45%), palmitic acid (5.62%) and stearic acid (4.26%). Moreover, the contents of behenic, arachidic, linolenic and myristic acids were found to be below 1%. After applying the frying process (for a total of three hours), the amounts of linoleic acid and linolenic acid of sunflower oil fried pepper were reduced to 60.33% and 0.06% respectively,
while the contents of oleic acid and palmitic acid were increased to 27.61% and 5.81%. Oleic, linoleic, linolenic and palmitic acids of sunflower oil fried potato were found to be 25.44%, 60.43%, 0.05% and 5.73%, respectively. When the fatty acid composition of the corn oil was analysed, amounts of oleic, linoleic, linolenic and palmitic acids were observed as 30.73%, 55.46%, 0.63%, and 10.18% respectively in pre-frying, while it was ascertained that the contents of oleic, linoleic and palmitic acids of oil fried pepper (total three hours) were 31.41%, 53.55% and 10.66%; in oil fried potato were 30.47%, 54.24% and 10.85% respectively. The oleic acid content of the hazelnut oil, which had high monounsaturated fatty acids, was found to be 77.17% before the frying process. It was determined as 79.28% (for fried pe pper) and at 79.36% (for fried potato) after frying. Amounts of linoleic acid (14.27%) and linolenic acid (0.14%) decreased to 12.77% for fried pepper and
to 12.86% for fried potato; the figures were 0.07% for
94 92 90 88 86 84 82 80 78 76 74 L
* v
a lu es S u n flowe r oil Haze ln u t oil Cor n oil P al m oil Ol ive oil -6 -5 -4 -3 -2 -1 0 a
* v
a lu es S u n flowe r oil Haze ln u t oil Cor n oil P al m oil Ol ive oil 18 16 14 12 10 8 6 4 2 0 b
* v
Research Article 197
Fig. 6: Dominant fatty acids of oils fried potato. Fig. 7: Dominant fatty acids of oils fried pepper.
pepper and 0.08% for potato. Palmitic acid content increased from 5.26% to 5.37% in fried pepper and to 5.92% in fried potato. The oleic acid content of riviera olive oil for fried pepper increased from 73.36% to 74.61%, but reduced to 72.73% when the potato was fried. After the frying process, amounts of polyunsaturated fatty acids, such as linoleic (8.61%), linolenic (0.60%), arachidonic (0.22%) and Ɣ-linolenic (0.30%) acids were determined as 8.15%, 0.59%, 0.20% and 0.25% (for fried pepper), and 8.08%, 0.58%, 0.17% and 0.29% (for fried potato), respectively. According to the fatty acid composition of palm oil prior to the frying process, the fatty acids were determined as oleic (40.66%), palmitic (40.10%), linoleic (9.98%), stearic (3.63%), myristic (1.16%), linolenic (0.20%), lauric (0.66%) and arachidic (0.31%) acids. The increases in oleic acid (42.73%) and palmitic acid (43.52%); the decrease in linoleic acid (9.17%) were observed when 12 times the frying process was applied with the pepper. The proportions of oleic, palmitic and linoleic acids of palm oil fried potato were reported at 41.95%, 43.37%, and 9.37%, respectively.
Amounts of linoleic and linolenic acids, which are nutritionally essential, were reduced after the frying process was applied to different vegetable oils. Besides, the increases in oleic and palmitic acids contents of oils were determined. This situation was associated with a degradation in the double bonds of unsaturated fatty acids and the formation of saturated and monounsaturated fatty acids in consequence of oxidation occuring during the frying process. It was found that monounsaturated
(oleic acid) and polyunsaturated (linoleic and linolenic acids) fatty acids especially caused oxidation of oils [33]. Oils used cooking or frying should have a low polyunsaturated fatty acid composition [34]. In this study, loss of the linoleic acid content was at a maximum level in sunflower oil (2.02-2.12%), followed by corn oil with a range of 1.91-1.22%. The minimum reduction was determined in palm oil and olive oil, including the lowest amount of linoleic acid. It was observed in oils exposed to further oxidation during the frying process when linoleic acid content increased. Additionally, change in the frying material used did not dramatically affect the decrease in the linoleic acid content of oils. The linolenic acid content of oils used in the frying process was below 1% and the minimum reduction was observed in the amounts of linolenic acid after frying. The decrease in this essential fatty acid was close in all the frying oils.
CONCLUSIONS
fatty acids, when the oils are used over a long time and in a repeated manner. Oils have great importance due to penetrating fried products. Therefore, the exposure time of frying oils consumed with fried samples should be
monitored in order to ensure that these do not have deleterious effects on human health.
Acknowledgements
This study was supported by the Selçuk University Coordination of Scientific Research Projects (S.Ü. BAP, No: 13101013, Konya-Turkey).
Received : Jun. 13, 2017 ; Accepted : Apr. 9, 2018
REFERENCES
[1] Rossell J.B., “Frying Improving Quality”, CRC Press, Boca Raton, USA (2001).
[2] Bruhl L., Fatty Acid Alterations in Oils and Fats During Heating and Frying, Eur. J. Lipid. Sci., Technol, 116: 707-715 (2014).
[3] Gertz C., Fundamentals of the Frying Process, Eur. J. Lipid. Sci. Technol., 116: 669-674 (2014).
[4] Gupta M., “Frying Oils, Bailey’s Industrial Oil and Fat Products”, (F. Shahidi, ed.) John Wiley & Sons Inc., New Jersey (2005).
[5] Pedreschi F., Frying Potatoes: Physical, Chemical and Microstructural Changes, Drying Technol., 30: 707-725 (2012).
[6] Gloria H., Aguilera J.M., Assessment of the Quality of Heated oils by Differential Scanning Calorimetry, J. Agric. Food. Chem., 46: 1363-1368 (1998). [7] Mammadov R., Makasçı-Afacan A., Uysal-Demir D.,
Görk Ç., Determination of Antioxidant Activities of Different Urginea maritima (L.) Baker Plant Extracts, Iran. J. Chem. Chem. Eng. (IJCCE), 29(3): 47-53 (2010).
[8] Aladedunye F., Przybylski R., Performance of Palm Olein and Modified Rapeseed, Sunflower, and Soybean Oils in Intermittent Deep-Frying, Eur. J. Lipid. Sci. Technol., 116: 144-152 (2014).
[9] Jung S.S., Kim M., Lee J., Estimating the Time of Frying Oils have been Used for French Fries Based on Profile Changes of Fatty Acids Derived From Heated Oil Model Systems, Food Sci. Biotechnol., 23(5): 1405-1410 (2014).
[10] Hassanien M.F.R., Sharoba A.M., Rheological Characteristics of Vegetable Oils as Affected by
Deep Frying of French Fries, Food Measure, 8: 171-179 (2014).
[11] Pagliarini E., Rastelli C., Sensory and Instrumental Assessment of Olive Oil Appearence, Grasas Y Aceites, 45: 1-2 (1994).
[12] AOCS, “Official Methods and Recommended Practices of the American Oil Chemists’Society”. 4th ed. American Oil Chemists’ Society. Champaign, method Ac 5-41 (1989).
[13] AOCS, Official Methods and Recommended Practices of the American Oil Chemists’ Society, 4th ed., American Oil Chemists’ Society, Champaign, method Cd 8-53 (1992).
[14] Khaled A.Y., Aziz S.A., Rokhani F.Z., Capacivite
Sensor Probe to Assess Frying Oil Degradation, Information Processing in Agriculture, 2(2): 142-148 (2015).
[15] “ISO-International Organization for Standardization. Animal and Vegetable Fats and Oils Preperation of
Methyl Esters of Fatty Acids”. ISO, Geneve, Method ISO 5509, 1-6 (1978).
[16] AOAC, “Official Methods of Analysis”, 15 th ed.
Association of Official Analytical Chemists, Washington, DC (1990).
[17] Koltai H., Lekkala S.P., Bhattacharya C., Mayzlish-Gati E., Resnick N., Wininger S., Dor E., Yoneyama K.,
Yoneyama K., Hershenharn J., Joel D.M., Kapulnik Y., A Tomato Strigolactone-Impaired Mutant Displays Aberrant Shoot Morphology and
Plant Interaction, J. Exp. Bot., 61(6): 1739-1749 (2010).
[18] Kim J., Kim D.N., Lee S.H., Yoo S., Lee S., Correlation of Fatty Acid Composition of Vegetable
Oils with Rheological Behaviour and Oil Uptake, Food Chem., 118: 398-402 (2010).
[19] Tarmizi A.H.A., Niranjan K., Gordon M.,
Physico-Chemical Changes Occurring in Oil When Atmospheric Frying is Combined with Post-Frying
Vacuum Application, Food Chem., 136: 902-908 (2013).
Research Article 199 [21] Blumenthal M.M., “Frying Technology”, In:
Hui Y.H. (Editors of Bailey's Industrial Oil and Fat
Products.) Vol 3: Edible Oil and Fat Products; Products and Application Technology, 5th ed.
John Wiley & Sons, Inc. 605 Third Avenue, New York, N.Y. USA (1996).
[22] Kalogianni E.P., Karapantsios T.D., Miller R., Effect
of Repeated Frying on the Viscosity, Density and Dynamic Interfacial Tension of Palm and Olive Oil,
J. Food Eng., 105: 169-179 (2011).
[23] Krygier K., Rutkowski A., Szewczyk M., Simple
Test for Determination of Acid Value in Oils, La Rivista Italiana Delle Sostanze Grasse, LVIII, 401-403 (1981).
[24] Ramli N., Nafar M., Jaswir I., Oxidative Stability of Blend Oil during Deep-Fat Frying of Potato Chips,
Pakistan Journal of Nutrition, 11(9): 730-734 (2012).
[25] Casal S., Malheiro R., Sendas A., Oliveira B.P.P.,
Pereira J.A., Olive Oil Stability Under Deep-Frying Conditions, Food Chem Toxicol, 48: 2972-2979 (2010).
[26] Chatzilazarou A., Gortzi O., Lalas S., Zoidis E., Tsaknis J., Physicochemical Changes of Olive Oil
and Selected Vegetable Oils During Frying, Journal of Food Lipids, 13: 27- 35 (2006).
[27] Stevenson S.G., Vaisey-Genser M., Eskin N.A.M., Quality Control in the Use of Deep Frying Oils,
J. Am. Oil. Chem. Soc., 61: 1102-1108 (1984). [28] Lumley I.D., “Polar Compounds in Heated Oils”,
In: Frying of Food, Principles, Changes, New
Approaches. (G. Varela, A. Bender and I.D. Morton, eds.) VCH, London (1988).
[29] Augustin M.A., Berry S.K., Efficacy of the Antioxidants BHA and BHT in Palm Olein During
Heating and Frying, J. Am. Oil Chem. Soc., 64: 1520–1522 (1983).
[30] Karakaya S., Şimşek Ş., Changes in Total Polar
Compounds, Peroxide Value, Total Phenols and Antioxidant Activity of Various Oils Used in Deep
Fat Frying, J. Am. Oil Chem. Soc., 88: 1361-1366 (2011).
[31] Lalas S., Gortzi O., Tsaknis J., Frying Stability of
Moringa stenopetala Seed Oil, Plant Foods for
Human Nutrition, 61: 99-108 (2006).
[32] Gutierrez R., Gonzalez O., Dobarganes M.C., “Analytical Procedures for the Evaluation of Used Frying Fats”, (G. Varela, A. Bender and I. D. Morton, eds.) In Frying of Food: Principles,
Changes, New Approaches. VCH, London (1988). [33] Hamilton R.J., “The Chemistry of Rancidity in
Foods”, (R.J. Hamilton and J.C. Allen, eds.) An
Aspen Publication, USA (1999).
[34] Özcan M.M., Some Nutritional Characteristics of