Theerasarn PIANPANIT
1), Seiji ISHIGURO
1,2)and Hiroki HASEGAWA
1,2)1)Department of Fusion Science, SOKENDAI, 322-6 Oroshi-cho, Toki 509-5292, Japan 2)National Institute for Fusion Science, 322-6 Oroshi-cho, Toki 509-5292, Japan
(Received 30 November 2015/Accepted 9 February 2016)
In this work, the 1D-3 V particle simulation with Monte Carlo collision and cumulative scattering angle Coulomb collision was developed to study the kinetic behavior of the detached plasma. The constant pressure and temperature of the neutral gas box in front of the divertor target were used in the simulation. The simulation was performed with a fixed upstream plasma densitynu∼3×10¹⁸m−3and a modified large Coulomb collision
frequency. When the neutral gas pressure is increased, there is a strong decrease in the electron temperature inside the neutral gas box. The electron temperature in front of the divertor target also decreases to below 1 eV, which is one of the conditions for detached plasma.
c
2016 The Japan Society of Plasma Science and Nuclear Fusion Research
Keywords: detached plasma, particle simulation, scrape-offlayer, parallel transport, divertor DOI: 10.1585/pfr.11.2403040
1. Introduction
Detached plasma [1] is a method of reducing the heat load to the divertor target during the long operation of fu-ture fusion devices. During the detached state, the plasma temperature and particle heat flux decrease significantly. The detached state is achieved when there is a high neutral gas pressure in front of the divertor and spreads the local heat load to a larger area owing to the free moving neu-tral gas atoms. In experiments, the detached plasma occurs when there is high recycling rate near the divertor plate. This high recycling increases the ion-neutral collision rate and decreases the plasma temperature. Neutral gas puffing can also increase the neutral density near the divertor and cause the plasma temperature to decrease. Impurities are sometimes injected for radiative loss.
Linear devices have been used to study the heat load of plasma to the divertor target by inserting the neutral gas chamber between the plasma source and the target. Many experimental results show a strong decrease in the heat flux to the target when the gas pressure inside the chamber in-creases [2, 3]. The linear devices can help in studying the basic physics of the detached plasma and improve the sim-ulation models of the detached plasma.
Most of the detached plasma simulations are per-formed by fluid models that are based on Maxwellian dis-tribution. Thus, they might be inadequate near the divertor plate [4]. Fluid models also assume a short collision mean free path compared to the system size. However, for some fusion devices, the collision mean free path can be com-pared to the connection length and thus the kinetic effect author’s e-mail: [email protected]
∗)This article is based on the presentation at the 25th International Toki Conference (ITC25).
becomes important.
In this work, particle simulations were performed to investigate the kinetic effect of the plasma. The system has been set up to resemble the linear device. A neutral gas box with constant neutral gas pressure and temperature has been set in front of the divertor target without any influ-ence from the neutral recycling from the wall. The prelim-inary results suggest that the plasma temperature strongly decreases after increasing the neutral gas pressure and that detached plasma was created. The numerical method that was used in this work is described in Sec. 2. The simula-tion parameters and results are given in Sec. 3. In Sec. 4, the discussion and future work direction are presented.
2. Numerical Method
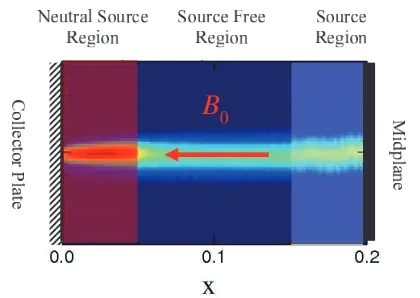
This simulation consists of the particle-in-cell (PIC) and collision parts. The PIC simulation solves the equa-tion of moequa-tion for individual particle inside the plasma and finds the self-consistent electric field. The collision part in-cludes the Monte Carlo collision (MCC) with neutral par-ticles and the Coulomb collision. MCC is necessary for the atomic processes such as charge exchange, ionization, and excitation. Physical processes from gas puffing can also be included in the MCC. In low temperature and high density plasma, Coulomb collisions become important and the PIC simulation alone cannot accurately simulate the Coulomb collisions, which contribute to the detached plasma. The system configuration is divided into the plasma source re-gion, the source free rere-gion, and the neutral source region (Fig. 1). Inside the system, the magnetic field is uniform and pointing toward the collector plate.
c
2016 The Japan Society of Plasma
Fig. 1 System configuration with the plasma source on the right-hand side and the collector target on the left-right-hand side; plasma flow is from the right- to the left-hand side.
2.1
Boundary conditions
The boundary conditions of the system are defined for the left- and right-hand side of the system box. Ifxis the position along the field line andLis the system length,x= Lat the right-hand side of the system is set as the symmetry midplane, and the particles are reflected back to the system. The left-hand side is the collector plate (x =0), which is assumed to fully absorb the particles and accumulate the charge densityσ.
The electrostatic potential at the midplane is set to zero, or
φ(x=L)=0.
The electric field at the collector plate depends on the charge density at the plate and can be written using Gauss’s law as
E(x=0)=σ/ε0,
where ε0 is the permittivity of free space. This
equa-tion can be also written in the finite difference form, as in Ref. 5.
2.2
Particle source
The uniform particle source is placed in the right-hand side of the system. Let us define and⊥ as the parallel and perpendicular particle velocity, respectively. mis the particle mass andTs is the source temperature. The dis-tribution function of the velocity in the parallel direction to the magnetic field line for the particle source is f()∼
exp(m2/2Ts) [6, 7]. In the perpendicular direction, the
distribution function becomes f(⊥) ∼ exp(m2
⊥/2Ts) or
the Maxwellian distribution function.
2.3
Monte Carlo collision with neutral
par-ticle
In the MCC simulation, the null collision method has been used [10]. In null collision method, the maximum collision probability is calculated instead of calculating ev-ery particle collision probability. Therefore the maximum
Fig. 2 Collision probability forKtypes of atomic processes in the null collision method.
Fig. 3 Cross sections of different types of atomic processes [8, 9].
probability of the particle collision is
Pnull=1−exp
−max
x, (nnσT)Δt
, (1)
wherennis the density of the neutral particle,σTis the
to-tal cross section of the atomic processes of each species,
is the speed of each particle, and Δt is the time inter-val of each time step. This probability defines the num-ber of particles that collide in each time step and the col-lision type is selected for each particle, as in Fig. 2, where
ν = nnσ is the collision frequency with the probability
that the selected particle will not collide with the neutral particle. This is the null collision region in Fig. 2.
The collision processes that are included in the sim-ulation are divided into two groups, which are the elec-trons and hydrogen ions group in our case. In the elecelec-trons group, the atomic processes are elastic collision, ioniza-tion, and excitation. By using the null collision method, the number of collision types isK = 3. In the hydrogen ions group, the atomic processes are elastic collision and charge exchange. Thus, the number of collision types is
K=2. The cross section data are shown in Fig. 3.
2.4
Coulomb collision
In this simulation, the cumulative scattering angle bi-nary collision was applied to the Coulomb collision pro-cess [11]. Rather than calculate the small scattering an-gles of the binary collision of each particle in small time steps [12], we group the scattering angles into a large cu-mulative scattering angle.
The cumulative scattering angleχN is defined as the angle betweeng0andgNor
cosχN =g0·gN/g2. (2)
Because the Coulomb collision is elastic, the speed relative to the fixed field particle must be conserved, thusg=g1=
g2=. . .=gN.
To find the cumulative scattering angle for a test par-ticle, Nanbu introduced the isotropy parameters
s=ntgπb20(lnΛ)Δt, (3)
wherentis the target particle density,gis the relative speed of two colliding particles, andb0 is the classical distance of the closest approach. sis used to determine constantA
in the following equation:
cothA−A−1=e−s. (4)
The above equation needs to be calculated in advance and saved to an array to reduce the computational time. By using this constantA,χNis calculated from the following equation:
cosχN = 1
Aln
e−A+2RsinhA, (5) whereRis a random number from 0 to 1.
3. Simulation Results
The simulation is carried out with the system parame-ters in Table 1. The neutral gas box is in the left-hand side of the system and the plasma source region is in the right-hand side of the system as in Fig. 1. The lengths of the neu-tral source and plasma source regions are listed in Table 1. In this work, the neutral gas dynamics was not included. The neutral gas temperature and density are assumed con-stant throughout the simulation and both are concon-stant along thex-axis inside the neutral source region. We also assume that the neutral gas density becomes zero outside the neu-tral source region.
At the initial time step, the injection rate of the ion and electron pair is constant but the simulation is carried out with fixed upstream density. Thus, whennu>3×10¹⁸m−3,
no particles are injected to the system and the particles in-side the source region are heated. The number of particles to be heated is equal to the number of particles that are injected. The velocity of the particles that are heated in-side the source region is randomly changed to the particle source velocity without changing the direction. This pro-cess heat the particles at the upstream region in order to fix the upstream temperature.
Owing to the low plasma density in the simulation, the detached state cannot be observed without modifying the
Ion source temperature Ti0=10 eV
Particle injection rate Rinj=0.5 super particle
(Initial time) pairs perΔt
Super particle size NS=1×10¹¹
Plasma source length Ls=0.05 m Neutral source length Ln=0.05 m
Neutral gas temperature Tn0=0.026 eV
Magnetic field B0=1 T
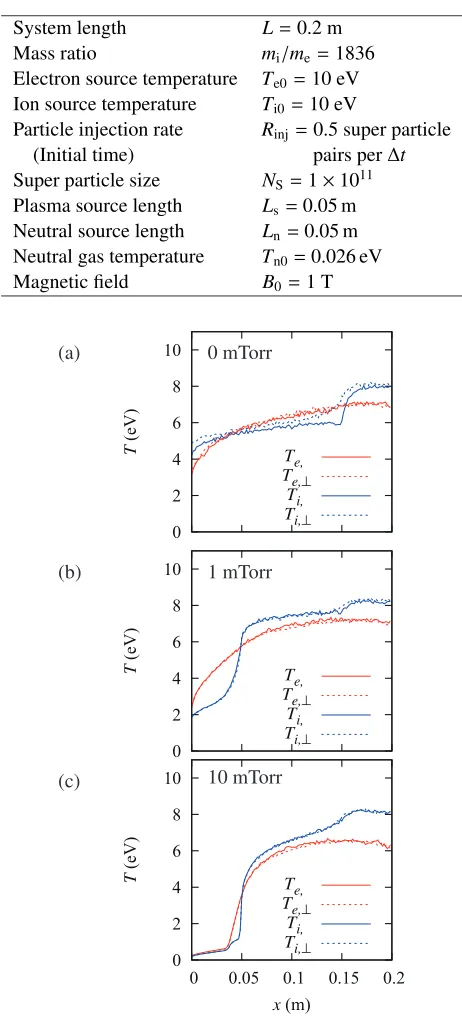
Fig. 4 Parallel and perpendicular temperature profiles of elec-trons and ions att=24μs for different neutral gas pres-sures: (a)PN=0 mTorr (b)PN=1 mTorr, and (c)PN=
10 mTorr.
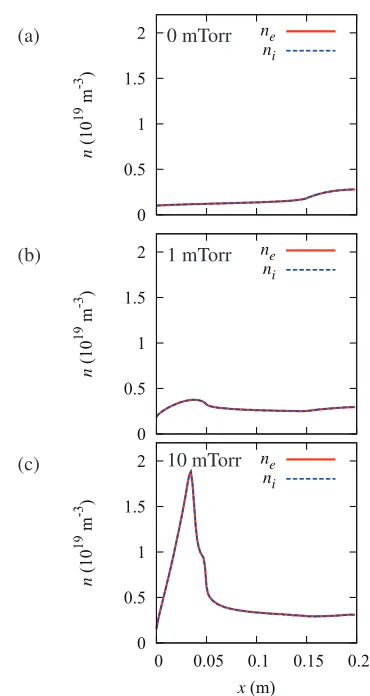
Fig. 5 Density profile of electrons and ions att=24μs for dif-ferent neutral gas pressures: (a)PN=0 mTorr (b)PN =
1 mTorr, and (c)PN=10 mTorr.
frequency can be modified by Eq. 3, where the isotropy pa-rameter depends on the collision frequencys∼νc0Δtand is
modified tos∼νcΔt.
The results are shown in Figs. 4 and 5. The figures show the decrease in plasma temperature and the increase in plasma density inside the neutral gas box. Energy is transferred from the electron to ion and most of the en-ergy loss is caused by the ion elastic collision and charge exchange.
The total plasma pressure profiles are shown in Fig. 6. From the momentum conservation of the 1D fluid equation [14], if there is no collision between the plasma and neutral gas, the total plasma pressurePtotalong the flux tube must
be constant or the following equation:
Ptot=P+minV2=constant, (6)
whereP=nikTi+nekTeandVis the average velocity of
the plasma. AtPN = 0 mTorr, the total plasma pressure
is constant along the x-direction. When the neutral gas pressure increases, the total plasma pressure drops in front of the divertor target. The total plasma pressure atx= 0 approaches zero atPN =10 mTorr.
Fig. 6 The total plasma pressure profile att=24μs for different neutral gas pressure.
4. Summary and Discussion
The results suggest a strong temperature gradient in-side the neutral gas region. The plasma temperature de-creases below 1 eV and the temperature approaches the neutral gas temperature when the neutral gas pressure in-creases to approximately 10 mTorr. The total pressure also decreases sharply inside the neutral gas box. The detached plasma can be observed by using the PIC–MCC simulation with the modified Coulomb collision frequency.
In this simulation, the plasma density increases strongly inside the high pressure neutral gas region, and re-combination can become important in decreasing the par-ticle flux to the divertor target during the detached state. There are many theoretical models and experimental re-sults that suggest that recombination plays an important role in describing the strong decrease in the particle flux of the detached plasma [15, 16]. Thus in the future, we plan to implement the recombination process in the sim-ulation [17]. Furthermore, this type of simsim-ulation can be used to understand the sheath formation in front of plasma facing materials and can be used to calculate the ion and electron heat flux directly.
Acknowledgements
This work was performed with the support and under the auspices of the NIFS Collaboration Research programs NIFS14KNXN279 and NIFS14KNSS059. The simulation was carried out by the Plasma Simulator at NIFS and the HELIOS supercomputer system at the Computational Sim-ulation Centre of the International Fusion Energy Research Centre (IFERC–CSC), under the Broader Approach col-laboration between Euratom and Japan, implemented by the Fusion for Energy and JAEA.
[1] G.F. Matthews, J. Nucl. Mater.220-222, 104 (1995). [2] W.L. Hsu, M. Yamada and P.J. Barrett, Phys. Rev. Lett.49,
1001 (1982).
Low-Temperature Hydrogen Plasmas(JUEL-4105, 2003). [10] V. Vahedi and M. Surendra, Comput. Phys. Commun.87,
179 (1995).
[11] K. Nanbu, Phys. Rev. E55, 4642 (1997).
[16] N. Ohnoet al., Phys. Rev. Lett.81, 818 (1998).