Patient Preference and Adherence 2016:10 1823–1845
Patient Preference and Adherence
Dove
press
submit your manuscript | www.dovepress.com
1823
R e v i e w
open access to scientific and medical research
Open Access Full Text Article
Patient-centered care interventions for the
management of alcohol use disorders: a
systematic review of randomized controlled trials
Pablo Barrio
Antoni Gual
Neurosciences institute, Hospital Clinic, institut d’investigacions Biomèdiques Agustí Pi i Sunyer, Barcelona, Spain
Issues: Patient-centered care (PCC) is increasingly accepted as an integral component of good health care, including addiction medicine. However, its implementation has been controversial in people with alcohol use disorders.
Approach: A systematic search strategy was devised to find completed randomized con-trolled trials enrolling adults (.18 years) with alcohol use disorders. Studies had to use a PCC approach such that they should have been individualized, respectful to the patients’ own goals, and empowering. Studies until September 2015 were searched using PubMed, Scopus, the Cochrane Library, PsychINFO, and Web of Knowledge.
Key findings: In total, 40 studies enrolling 16,020 patients met the inclusion criteria. Assessment revealed two main categories of study: psychosocial (n=35 based on motivational interviewing) and pharmacological (n=5 based on an as needed dosing regimen). Psychosocial interventions were further classified according to the presence or absence of an active comparator. When no active comparator was present, studies were classified according to the number of sessions ($1). Results from single sessions of motivational interviewing showed no clear benefit on alcohol consumption outcomes, with few studies indicating benefit of PCC versus control. Although the results for stud-ies of multiple sessions of counseling were also mixed, many did show a significant benefit of the PCC intervention. By contrast, studies consistently demonstrated a benefit of pharmacologically supported PCC interventions, with most of the differences reaching statistical significance.
Implications: PCC-based interventions may be beneficial for reducing alcohol consumption in people with alcohol use disorders.
Keywords: psychosocial intervention, pharmacological intervention, motivational interviewing, as-needed
Introduction
The Institute of Medicine has included patient-centered care (PCC) as one of the major
aims in care quality and defines it as “providing care that is respectful of and responsive
to individual patient preferences, needs, and values, and ensuring that patient values
guide all clinical decisions”.
1Although not a new phenomenon, it has recently attracted
renewed attention.
2,3PCC advocates for a shift from disease-oriented to patient-oriented
medicine. Doctors should no longer be authoritative figures who make all the relevant
decisions. Instead, they must engage in a shared decision-making model where patients
are acknowledged to be experts with regard to their own symptoms and values and
where they are recognized as unique and diverse. In such a model, the responsibility is
shared between a patient and a physician, and the physician’s key role is to strengthen
the patient’s capabilities to handle his or her part of responsibility.
4Correspondence: Pablo Barrio Neurosciences institute, Hospital Clinic, iDiBAPS, Carrer de villlarroel 170, 08036 Barcelona, Spain
Tel +34 932 275 400 ext 3167 email [email protected]
Journal name: Patient Preference and Adherence Article Designation: Review
Year: 2016 Volume: 10
Running head verso: Barrio and Gual
Running head recto: Systematic review of patient-centered care DOI: http://dx.doi.org/10.2147/PPA.S109641
Patient Preference and Adherence downloaded from https://www.dovepress.com/ by 118.70.13.36 on 26-Aug-2020
For personal use only.
Number of times this article has been viewed
This article was published in the following Dove Press journal: Patient Preference and Adherence
Dovepress
Barrio and Gual
Application of PCC in the field of mental disorders
remains a controversial issue. It has long been argued that
patients with psychiatric disorders are vulnerable to
impedi-ments in decision making,
5–8and a paternalistic approach has
been the preferred norm in the field.
9,10Conversely, a number
of studies indicate that patients engaged in the
decision-making process show greater satisfaction and collaboration,
with greater efficacy of treatment.
11,12While considering the field of alcohol use disorders, it is
also likely that ideological bias and stigma have exacerbated
the paternalistic approach. The harmful use of alcohol is one
of the world’s leading health risks and is the leading risk
fac-tor for death of people aged 15–49 years.
13However, patients
with alcohol use disorders often receive a lower quality of
health care than those with other chronic conditions; many
dependent patients go without treatment, and even when they
are treated, pharmacotherapy is underutilized.
14–16Abstinence
has been the prevailing goal, usually irrespective of patients’
own aims or desire.
17Crucially, patients do not always view
abstinence as an acceptable, desirable, or realistic treatment
goal, and there is an increasing debate about the
possibil-ity and the convenience of broadening treatment goals in
accordance with a PCC model.
18For example, this could
mean establishing reduction in heavy drinking as a possible
objective for some patients.
18–20Reduction of alcohol
con-sumption has been shown to reduce the annual and lifetime
risk of alcohol-related death, and it could attract patients who
are currently not inclined to seek treatment or do not accept
abstinence as a treatment goal.
20–22Indeed studies show that
patients with alcohol use disorders are more likely to achieve
self-set goals (eg, reduction or abstinence), rather than goals
that are imposed on them.
23,24Several treatment options (psychosocial and
pharmaco-logical) are available for people with alcohol use disorders,
but no single therapy has been proven to be more effective
than another. PCC and shared decision making are considered
especially appropriate when outcomes of the different
treat-ments are similar and when an active role of the patient is
needed.
25Thus, some experts consider alcohol use disorders
as potentially a suitable situation to use a PCC approach.
2Although some of the components of PCC might have been
previously tested for the treatment of alcohol use disorders,
for example, in the form of individually tailored feedback
and treatment, these have not been systematically assessed
in a cohesive manner. The aim of this review was to
system-atically assess the efficacy of interventions based on a PCC
health care approach, both pharmacological and
psychoso-cial, for the management of alcohol use disorders.
Methods
This systematic review was conducted in accordance with
the principles recommended by the Cochrane Handbook
for Systematic Reviews of Interventions.
26The Preferred
Reporting Items for Systematic Reviews and Meta-Analysis
guidance was followed for the reporting of procedures; its
checklist can be seen in
Supplementary materials
.
Definition of PCC
Although patient centeredness is not an easy concept to
define in a concise manner, a previous systematic review
operationalized it under four defining attributes: holistic,
individualized, respectful, and empowering.
27Many studies
might be considered as PCC, but they might not use this
exact expression, or any of the attributes of PCC previously
reported. Thus, in order to conduct an appropriately
sensi-tive electronic search, we predefined several adjecsensi-tives and
expressions to cover the four attributes. For example,
alterna-tive terms for “empowering” included “patient involvement”,
“patient perspective”, “shared decision-making”, and “patient
decision”, and alternative terms for “individualized” included
“tailored”, “personalized”, and “customized”.
Data sources and searches
The following databases were searched: PubMed,
Scopus (which contains EMBASE), the Cochrane
Library, PsychINFO, and the Web of Knowledge. The search
strategies for PubMed, Scopus, and the Cochrane Library
are listed in
Supplementary materials
. The searches were
run until September 2015. Additional hand searches of the
reference lists of included randomized controlled trial and
relevant systematic reviews were conducted. Finally, the
fol-lowing clinical trial registries were also searched for relevant
studies:
ClinicalTrials.gov
, ISRCTN Register, UK Clinical
Trials Gateway, and metaRegister of Controlled Trials.
Study selection
Individual (not cluster) randomized controlled trials enrolling
adults (
$
18 years) with alcohol use disorders (including
haz-ardous or harmful drinking, alcohol dependence, or any other
alcohol use disorder) were included. All the studies had to use a
PCC approach such that they should have been individualized,
respectful to the patients’ own goals, and empowering.
Com-puterized interventions were not included in this review.
As described earlier, although interventions might not
have been described with these same adjectives, they were
fully reviewed to check whether they met the criteria (ie,
the description of the intervention was individually assessed
Patient Preference and Adherence downloaded from https://www.dovepress.com/ by 118.70.13.36 on 26-Aug-2020
Dovepress Systematic review of patient-centered care
to determine whether it could be considered PCC). Studies
could use any standardized outcome regarding alcohol
consumption (eg, heavy drinking days, grams of alcohol,
days of abstinence, percentage of patients drinking below
recommended limits on validated screening tools). Only
publications in English were considered.
To homogenize the review, studies of patient populations
with psychiatric comorbidities were excluded from this review
as were studies including populations with relevant and
dif-ferential psychological variables (eg, mandated or
incarcer-ated patients and pregnant women). Studies conducted in the
inpatient setting and short-term studies with
,
3 months of
follow-up were also excluded. Studies using cover stories
where patients did not know the real intention of the
inter-vention were also excluded, as this is clearly contrary to the
concept of PCC. Finally, any comparator was eligible as long
as it was not PCC based.
Data extraction
PB and AG independently screened all the studies for
inclu-sion. Disagreements were resolved by discussion when
possible. If not, a third person was consulted. Data were
extracted by PB and independently checked by AG. The
extracted data consisted of participant characteristics, setting,
study methods, intervention characteristics, comparators,
outcomes, and results.
Quality assessment
PB and AG independently evaluated the quality of the studies.
Following the Cochrane guidelines and the methods used
in a recent systematic review undertaken by Mdege et al,
28a domain-based approach was used. The following criteria
were applied: power calculation, adequacy of
randomiza-tion, allocation concealment, adjustment for covariates in
the analysis, blinding of participants when possible, blinding
of outcome assessors, explanation of dropouts, and use of
intention-to-treat analysis.
Data synthesis
Considerable heterogeneity existed between the studies,
mainly in terms of reported outcomes, how the outcomes
were defined and reported, and the duration of the studies.
Given the different methodologies that were employed, the
studies were grouped according to whether they primarily
assessed a pharmacological or a psychosocial intervention.
In the psychosocial group, a further grouping was made
according to the number of sessions received, categorizing
studies between 1 or
.
1 sessions.
A meta-analysis was conducted on the basis of our
findings, by trying to build an outcome construct based on
construct validity. However, given the significant
method-ological issues involved, the analysis was deemed
inappropri-ate and a narrative synthesis was instead conducted.
Results
Literature search
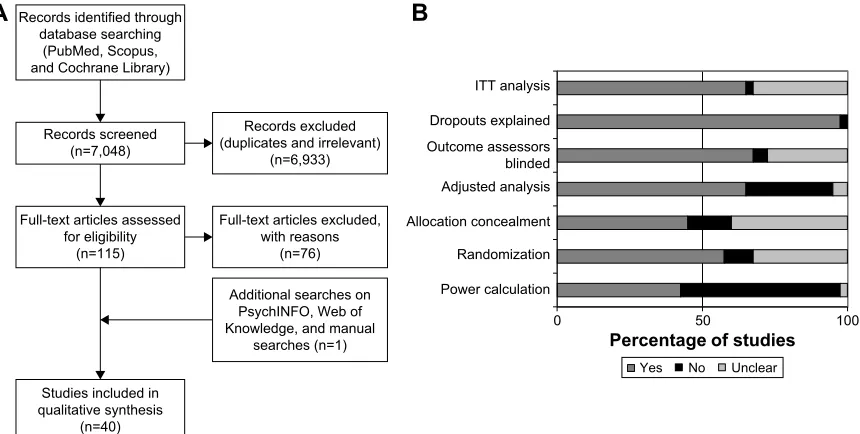
A total of 7,048 records were screened through the search
strategy, and 115 full-text articles were assessed for
eligibil-ity. An additional reference was identified by hand
search-ing, and eventually, after exclusion criteria were applied
(reasons for exclusion of full-text papers are available in
the
Supplementary materials
), a total of 40 studies were
included in the systematic review.
29–68Figure 1A depicts the
flow diagram of the study.
Study characteristics
The 40 studies included in this review involved a total of
16,020 enrolled patients. Sample size in each study ranged
from 54 to 987 patients. An initial assessment of the studies
revealed two groups according to the main treatment
evalu-ated: psychosocial or pharmacological, with 35 evaluating
psychosocial interventions and five evaluating primarily
pharmacological interventions.
All psychosocial interventions that met the inclusion
cri-teria in this review were based on motivational interviewing
(MI) principles, which might be considered as the cornerstone
of patient-centered psychosocial interventions nowadays.
MI is defined as “a directive, client-centered counseling style
for eliciting behavior change by helping clients to explore and
resolve ambivalence”.
69Compared to nondirective
counsel-ing, it is more focused and goal directed. The examination
and resolution of ambivalence is its central purpose, and the
counselor is intentionally directive in pursuing this goal.
Regarding pharmacological interventions, all those
ful-filling the inclusion criteria were based on the “as needed”
concept. The “as needed” [or pro re nata] treatment paradigm
is a well-understood medical concept, where the patient takes
the medication in response to individual circumstances and
not on a scheduled basis. Although it has been a standard
practice for many years in asthma, diabetic, and allergy care,
it represents a paradigm shift in the way that pharmacotherapy
is used in the management of alcohol use disorders.
70For further grouping studies, psychosocial interventions
based on MI and with no active comparator (defined as
receiving no further intervention or receiving only
infor-mation, either orally or written materials) were divided
Patient Preference and Adherence downloaded from https://www.dovepress.com/ by 118.70.13.36 on 26-Aug-2020
Dovepress
Barrio and Gual
according to the number of sessions they contained (1 or
.
1),
while the studies containing an active comparator (like
cogni-tive behavioral therapy [CBT], for example) were included
in a separate category. Thus, four categories were created
to report the results of the systematic review: single-session
PCC with no active comparator, more than one session PCC
with no active comparator, PCC with active comparator, and
patient-centered pharmacological interventions.
Quality assessment
The results of quality assessment of the included studies are
shown in
Supplementary materials
. Overall, less than half
(42.5%) of the studies were deemed as adequately powered,
57.5% had an adequate randomization, and 45% adequate
allocation concealment. Around two-thirds (65%) used
adjusted analysis and 67.5% reported blinding of the outcome
assessors, and all but one study reported adequate information
on the patients who dropped-out. Most (65%) of the
stud-ies stated clearly an intention-to-treat analysis (Figure 1B).
In psychosocial intervention studies, it was not considered
possible to blind participants to the delivered intervention;
therefore, participant blinding was only assessed in
phar-macological intervention studies, which were all deemed as
adequate on this item.
Efficacy of PCC
Single-session PCC with no active comparator
Seventeen studies were included in this subgroup (Table 1).
29–45Globally, they failed to show a clear benefit of the PCC
inter-vention over the control groups.
Amount and frequency of alcohol consumption
Seven studies reported on the number of drinks per week at
study end,
35–37,40,42–44with only Daeppen et al
36reporting a
statistically significant difference from baseline to follow-up
(
-
1.5 vs 0.8;
P
=
0.004) favoring the PCC group.
Bischof et al reported a nonsignificant difference in grams
of alcohol per day between groups,
30Emmen et al reported a
nonsignificant difference in drinks per day,
38and Soderstrom
et al reported on the number of drinks in the last 90 days,
with no differences between groups.
45Five studies reported the number of drinks per drinking
day. Four could not find significant differences,
33–35,44while
Carey et al only reported a small effect size, with no
signifi-cance value.
32Four studies reported on drinking days per week,
34,35,42,44none of them reaching statistical significance between
groups. Similarly, Lee et al reported on drinking days/month,
with no differences between groups.
41Chang et al reported
no differences in the percentage of drinking days between
groups,
33and Senft et al
44reported no differences in the
percentages of abstinent patients.
Hazardous and heavy drinking
Seven studies reported on the number of binge episodes
per month.
33,35–37,39,41,43Only Daeppen et al (2011) reported
a statistically significant difference favoring the PCC group
(baseline to follow-up difference
-
1.5 vs
-
0.8,
P
=
0.04).
36Murphy et al reported the number of binges per week
and Soderstrom et al reported the number of binges in the
last 90 days, both of them showing no significant differences
5HFRUGVVFUHHQHGQ 5HFRUGVLGHQWLILHGWKURXJK
GDWDEDVHVHDUFKLQJ 3XE0HG6FRSXV DQG&RFKUDQH/LEUDU\
6WXGLHVLQFOXGHGLQ TXDOLWDWLYHV\QWKHVLV
Q )XOOWH[WDUWLFOHVDVVHVVHG
IRUHOLJLELOLW\ Q
)XOOWH[WDUWLFOHVH[FOXGHG ZLWKUHDVRQV
Q 5HFRUGVH[FOXGHG GXSOLFDWHVDQGLUUHOHYDQW
Q
$GGLWLRQDOVHDUFKHVRQ 3V\FK,1)2:HERI .QRZOHGJHDQGPDQXDO
VHDUFKHVQ
3RZHUFDOFXODWLRQ 5DQGRPL]DWLRQ $OORFDWLRQFRQFHDOPHQW $GMXVWHGDQDO\VLV 2XWFRPHDVVHVVRUV EOLQGHG 'URSRXWVH[SODLQHG ,77DQDO\VLV
<HV 1R 8QFOHDU
3HUFHQWDJHRIVWXGLHV
$
%
Figure 1 (A) Study flow chart and (B) quality assessment.
Abbreviation: iTT, intention-to-treat.
Patient Preference and Adherence downloaded from https://www.dovepress.com/ by 118.70.13.36 on 26-Aug-2020
Dovepress Systematic review of patient-centered care
Table 1
Single-session patient-centered counseling – no active comparator
Study
Intervention
Patients
Follow-up duration
Outcomes reported
Key findings
Bazargan- Hejazi et al
29
2005, USA
1.
B
i
2.
Usual treatment in the
eD
•
N
=
295
•
eD attendants with CAG
e score
$
1
3 months
•
Changes in AUD
iT category
from baseline to follow-up Low risk: 0–6 At-risk/moderate risk: 7–18 High risk: 19–40
•
48% reduced their AUD
iT risk category in the intervention group
vs 38% in the control group. Differences were not statistically significant
•
in the subgroup of moderate risk, 34% of the intervention group had a risk reduction vs 13% in the control group (
P
=
0.0099)
Bischof
et
al
30
2008, Germany
1.
Full care: personalized feedback at baseline
+
M
i
+
BCC on the phone at
baseline, 1, 3, and 6 months in 30-minute sessions
2.
Stepped care: if no improvement reported, then patients
received
personalized
feedback at baseline
+
M
i
+
BCC (as above)
3.
Control: booklet on health behavior
•
N
=
408
•
Subjects attending 81 general practices in North Germany
•
AUD
iT score
$
5,
o
r
LA
ST
score
$
2
•
individuals who screened positive were then assessed to identify AD, AA, AR, and H
eD with the
lifetime version of the M-C
iD
i
12 months
•
Average daily alcohol consumption
•
H
eD
Grams of alcohol per day: • intervention groups reduced from 46.9 (49.3) and 49.0 (51.3) to 35.7 (48.1); control group reduced from 41.0 (50.3) to 34.9 (48.9). Differences not significant (
P
=
0.883)
Percent binge drinkers at follow-up: • For alcohol-dependent patients: intervention group 54.5%; control group 50.0% (
P
=
0.694)
•
For patients with alcohol abuse or at risk drinking: intervention group 25.0%; control group 41.3% (
P
=
0.039)
•
For H
eD only patients: intervention group 32.9%;
control group 27.5% (
P
=
0.672)
Brown et al
31
2010, Canada
1.
One 30-minute brief M
i
session, adapted for D
wi
offenders
2.
Control
•
N
=
92
•
Adult drivers convicted of at least 2 D
wi
offences within the
last 15 years
•
AUD
iT score
.
8
•
Residence within a 100 km radius of Montreal
•
No current D
wi
intervention
involvement
12 months
•
Percent of risky drinking days in the last 180 days (defined as $
42 g of alcohol for males)
and
$
2 standard drinks
(
$
28 g of alcohol) for females
•
Group
×
time interaction not statistically significant
•
No differences between groups at either time
•
Significant reduction from 6 to 12 months in risky drinking days for intervention group (mean reduction (SD)
=
6.1 (20.2) to 12.2 (25.0)
for intervention group; 8.5 (22.4) to 7.5 (22.7);
P
,
0.02)
•
Greater reduction of MC
v
for intervention group at 3 months in
MC
v
(mean (SD)
=
9.6 (34.3) vs 1.75 (23.9);
P
,
0.005)
Carey et al
32
2006, USA
1.
TLFB
+
BM
i enhanced with
decisional balance
2.
BM
i enhanced with decisional
balance
3.
TLFB
+
basic BM
i
4.
Basic BM
i
5.
TLFB
6.
Control: initial assessment only
7.
Control: brochure
•
N
=
615
•
Adult university students reporting
.
1 episode of heavy
drinking in a week, or four heavy drinking episodes in the last month
12 months
•
Drinks/week
•
Drinks/drinking day
•
Heavy drinking frequency
•
Reduction in all drinking outcomes in all groups (significance not reported)
•
Between groups effect sizes at 1 month were medium for intervention vs control group in drinks per drinking day, peak BAC and RAP
i (0.41; 0.44 and 0.52)
•
At 12 months also medium for intervention vs control group in peak BAC and RAP
i (0.57 and 0.50)
•
All other outcomes resulted in small effect sizes
(
Continued
)
Patient Preference and Adherence downloaded from https://www.dovepress.com/ by 118.70.13.36 on 26-Aug-2020
Dovepress
Barrio and Gual
Table 1 ( Continued ) Study Intervention Patients
Follow-up times
Outcomes reported
Key findings
Chang et al
33 2011, USA 1. B i 2. Control •
Outpatient women with hypertension, diabetes, osteoporosis, or infertility
•
T-AC
e alcohol
screen-positive; and/or typically consuming
$
7 drinks a week
or
$
2 drinks at a time
12 months
•
Drinks per drinking day
•
Percent drinking days
•
Number of binge episodes, with binges defined as
$
4
drinks per occasion
Drinks per drinking day: • intervention group reduced from 2.1 (1.4) to 2.0 (2.0); control group reduced from 2.2 (1.5) to 1.9 (1.6). Differences not significant (
P
=
0.60)
Percent drinking days: • intervention group reduced from 26% to 22%; control group reduced from 21% to 20%. Differences not significant (
P
=
0.52)
Binge episodes: • in
te rv en tio n gr ou p re du ce d fr om 7 .4 (2 4) to 6 .0 (2 1) ; c on tr ol g ro up
reduced from 5.7 (17) to 3.8 (13). Differences not significant (
P
=
0.17)
Cherpitel et al
34
2010, Poland
1.
20 minutes of BN
i 2. Assessment only 3. Screening only • N = 446 •
Patients attending the
eD
•
Positive on any one of the four RAPS4 items during the last year, or reported
$
11 standard
drinks per week for men (
$
6 for
women), or reported
$
4 drinks
on a typical drinking day for men ($3 for women) in the last year
12 months
•
Percent at risk drinking
•
Drinking days per week
•
Drinks per drinking day
•
Maximum drinks per occasion last month
At risk drinking: • intervention group reduced from 87.5% to 63.8%; control groups reduced from 87.4% and 88.7% to 54.0% and 64.9%, respectively. No significant differences between groups. Within group differences significant for all groups (
P
,
0.01)
Drinking days per week: • in
te rv en tio n gr ou p re du ce d fr om 2 .5 (0 .2 ) t o 1. 8 (0 .2 ); co nt ro l gr ou ps r ed uc ed fr om 2 .3 (0 .2 ) a nd 2 .3 (0 .2 ) t o 2. 0 (0 .2 ) a nd 2 .1 (0 .2 ), re sp ec tiv el y. D iff er en ce s be tw ee n gr ou ps n ot s ig ni fic an t. W ith in g ro up
differences only statistically significant for intervention grou
p (
P
,
0.01)
Drinks per drinking day: • intervention group reduced from 5.6 (0.4) to 4.1 (0.4); control groups reduced from 5.0 (0.4) and 5.3 (0.4) to 3.5 (0.3) and 4.2 (0.4), respectively. Within group differences significant for all groups (
P
,
0.01). No differences between groups
Maximum drinks per occasion last month: • intervention group reduced from 9.3 (0.8) to 7.4 (0.6); control groups reduced from 6.7 (0.5) and 7.8 (0.5) to 6.1 (0.6) and 7.7 (0.6), respectively. No differences between groups.
w
ithin group
differences only significant for intervention group (
P
,
0.05)
Daeppen et al
35
2007, Switzerland
1.
BA
i (15-minute session)
2.
Control with assessment
3.
Control with no assessment
•
N
=
987
•
Patients admitted to the
eD
for an injury
•
Hazardous drinking, de
fined
as men aged
,
65 years who
drank
.
14 drinks per week or
five drinks on a single occasion in the past 30 days, or men aged
.
65 years and women who
drank
.
7 drinks per week or four
drinks on a single occasion
12 months
•
Percentage of patients changing from high- to low-risk drinking
Drinks per week among binge drinkers: • intervention group baseline to follow-up difference
-1.5 (13.2),
control group 0.8 (10.8). Differences statistically significant (
P
=
0.004)
Binge drinking occasions per month among binge drinkers: • intervention group baseline to follow-up difference
-1.5 (3.4),
control group
-0.8 (3.2). Differences statistically significant (
P
=
0.04)
Patient Preference and Adherence downloaded from https://www.dovepress.com/ by 118.70.13.36 on 26-Aug-2020
Dovepress Systematic review of patient-centered care
Daeppen et al
36
2011, Switzerland
1.
BM
i (15–45 minutes)
2. Control • N = 271 •
20-year old men entering military service who were binge drinkers (typical drinking episodes of 60
g pure alcohol at least
once a month)
6 months
•
Typical number of drinks
pe
r
week (standard drink containing ~10
g of pure alcohol)
• Ty pi ca l n um be r of b in ge d rin ki ng ep iso de s pe r m on th • AUD iT score •
Number of drinks per occasion
•
Number of drinking da
ys
per w
eek
Hazardous drinkers: • inter
vention gr
oup r
educed fr
om 100% to 64.4%,
contr
ol gr
oups
reduced fr
om 100% to 66.0% and 63.0%,
r espectiv el y. Diff er ences
not significant (
P
=
0.71)
Binge drinking episodes last month: • intervention group reduced from 4.2 (6.1) to 3.7 (5.8); control groups reduced from 4.0 (6.2) and 3.7 (6.1) to 3.6 (6.1) and 3.6
(6.4), respectively. Differences not significant (
P
=
0.46)
Number of drinks in last 7 days: • intervention group reduced from 13.4 (12.8) to 10.3 (11.3); control groups reduced from 13.3 (14.7) to 11.1 (11.9) and 10.9 (14.2). Differences not significant (
P
=
0.65)
AUDIT score: • inter
vention gr
oup r
educed fr
om 9.7 (5.2) to 7.8 (5.0),
contr
ol
gr
oups r
educed fr
om 8.7 (4.1) to 7.2 (4.3) and 7.3 (4.7).
Diff
er
ences
not significant (
P
=
0.27)
Number of drinks per occasion: • inter
vention gr
oup r
educed fr
om 4.0 (2.6) to 3.7 (2.9),
contr
ol
gr
oups r
educed fr
om 3.8 (2.4) and 3.7 (2.8) to 3.5 (2.6) and
3.4
(2.6).
Diff
er
ences not significant (
P
=
0.28)
Number of days drinking per week: • intervention group reduced from 3.5 (2.3) to 3.0 (2.2), control groups reduced from 3.5 (2.4) and 3.6 (2.3) to 3.2 (2.4) and 3.1 (2.4). Differences not significant (
P
=
0.52)
D’Onofrio et al
37 2008, USA 1. BN i 2. BN i + booster 3. Standard care • N = 494 •
Patients presenting to an
eD 12 months • N um be r of s ta nd ar d dr in ks per week •
Number of binge episodes (
. 4 drinks for women and . 5 dr in ks
for men) in the past 30 days
•
Percent of participants in each trea
tm en t c on di tio n w ho ex ce ed ed N iA A A lo w -r isk
drinking limits in the past month
Drinks per week: • in
te rv en tio n gr ou p re du ce d fr om 1 3. 6 (1 1. 6) to 9 .8 (1 4. 3) ; c on tr ol
group reduced from 12.4 (8.7) to 9.8 (10.9). Differences not si
gnificant
Binge episodes last month: • intervention group reduced from 6.0 (6.8) to 4.0 (6.7); control group reduced from 5.4 (5.4) to 3.9 (6.2). Differences not significant Proportion of patients over NIAAA guidelines (with previous outcomes combined): • intervention group reduced from 99.2% to 62.0%; control group reduced from 98.0% to 65.4%. Differences not significant
emmen et al
38
2005, the Netherlands
1.
Dutch Motivational Drinker’s Check-Up
2. Control • N = 123 •
Patients from a general internal medicine outpatient department
•
Positiv
e ans
w
er to one of thr
ee questions: 1) Ha ve y ou e ver f elt
the need to cut do
wn on y
our
drinking? 2) Do y
ou e
ver drink to
forget y
our w
or
ries? 3) Do close
relativ
es e
ver w
or
ry or complain
about y
our drinking?
6 months
•
Change in self-reported alcohol consumption in units/day
•
Change in CDT
•
Overall, patients reduced their alcohol consumption over time from 3.9 (2.42) units/day to 3.11 (2.29) units/day;
P
,
0.001
•
intervention group reduced from 4.16 (2.15) to 0.81 (2.0), control group from 3.70 (2.67) to 0.84 (2.61). Differences not significant
•
No significant differences in the reduction of % CDT values
(
Continued
)
Patient Preference and Adherence downloaded from https://www.dovepress.com/ by 118.70.13.36 on 26-Aug-2020
Dovepress
Barrio and Gual
Table 1 ( Continued ) Study Intervention Patients
Follow-up times
Outcomes reported Key findings Gaume et al 39
2011, Switzerland
1. BM i 2. Control • N = 446 •
Swiss army conscripts, who were heavy episodic users, defined as having
$
1 episode per month
of
$
6 drinks on a single occasion
6 months
•
Number of standard drinks (~10 g of pure alcohol) per week and number of heavy drinking episodes (
$
6
drinks
on a single occasion) per month
Among heavy episodic users: Drinks per week: • Baseline to 6-month difference
-0.4 (13.1) for the intervention
group; 0.7 (19.1) for the control group. Differences not statistically significant (
P
=
0.90)
Heavy drinking episodes per month: • Baseline to 6-month difference
-0.7 (3.2) for the intervention
group;
-0.8 (3.8) for the control group. Differences not statistically
significant (
P
=
0.61)
Hansen et al
40
2012, Denmark
1.
BM
i (10 minutes) and a brief
telephone booster session 4 weeks later
2. Control • N = 772 •
Patients attending a health examination, after completing an online survey
•
w
eekly alcohol consumption
ab ov e th e D an ish N at io na l Bo ar d of H ea lth li m its (14 drinks = 16 8 g of a lc oh ol fo r
women, 21 drinks
= 25 2 g fo r m en ) •
Dependent drinkers included
12 months
•
Number of drinks per week
•
The difference in the number of drinks per week between intervention and control group in change over time was 1.0 favoring intervention
•
Difference not significant (95% CI:
-2.15 to 0.23;
P
=
0.114)
Lee et al
41 2011, USA 1. CAM i 2. M
i (1.5 hours)
•
N
=
54
•
Hazardous drinking (
$
5/4 drinks/
occasion for men/women or
$
14/7 drinks/week for
men/women)
•
Hispanic nationality
6 months
•
Heavy drinking days/month
• Drinking days/month • Dr inC •
Significant within groups decline for both groups on drinking da
ys/ m on th ; h ea vy d ri nk in g da ys /m on th , a nd D ri nC ( nu m be rs n ot
reported), with no between groups differences at 6 months
• A t 2 m on th s, C A M i h ad a g re at er r ed uc tio n th an M i i n dr in ki ng days/month • T re nd fa vo ri ng C A M i ( PC C ) in r ed uc tio n of h ea vy d ri nk in g da ys ( P = 0.08) • Si gn ifi ca nt t im e by t re at m en t in te ra ct io n on t he D rI nC Im pu ls e
scale at 6 months favoring CAM
i
Murphy et al
42
2001, USA
1.
Basics: M
i (50 minutes)
2.
e
ducation: 30-minutes of video watching and individual discussion
3.
Control: assessment only
• N = 54 • U ni ve rs ity u nd er gr ad ua te s tu de nt s on th e up pe r th ird o f t he s cr ee ni ng
sample in terms of drinks per week, as measured by the DDQ
•
endorsed
$
2 alcohol-related
problems on the RAP
i
9 months
•
Drinks per week
•
Binge drinking days per week, drinking days per week, RAP
i
score, ADS score
Drinks per week: • The inter
vention gr
oup r
educed fr
om 22.38 (12.04) to 16.63
(9.29);
the contr
ol gr
oups r
educed fr
om 21.29 (10.06) and
20.76
(10.75) to
15.72 (7.75) and 18.46 (14.17),
respectiv
el
y
Drinking days per week: • The intervention group reduced from 3.90 (1.35) to 3.17 (1.21); the control groups reduced from 3.75 (1.45) and 3.92 (1.46) to 3.37 (1.14) and 3.89 (1.93), respectively
Patient Preference and Adherence downloaded from https://www.dovepress.com/ by 118.70.13.36 on 26-Aug-2020
Dovepress Systematic review of patient-centered care
Binge drinking days per week: • The intervention group reduced from 2.57 (1.38) to 1.87 (1.11); the control groups reduced from 2.67 (1.05) and 2.44 (1.23) to 1.90 (1.33) and 1.93 (1.54), respectively • Not significant multivariate effect of group (
P
=
0.22)
Murphy et al
43
2004, USA
1.
+
plus 30–50 minute
M i session 2. PDF alone • N = 54 •
College students who consumed at least 13 drinks per w
eek and
endorsed one or mor
e
alcohol-related pr
oblems in the past
month on the RAP
i
6 months
•
Drinks per week
•
Frequency of heavy drinking in the past month
•
in general,
both the gr
oups sho
w
ed moderate drinking r
eductions
•
w
ithin-gr
oup eff
ect size acr
oss the thr
ee drinking measur
es was 0.48 f or inter vention gr oup (PDF + M
i) and 0.42 f
or contr
ol gr
oup
(PDF alone)
•
No significant differences between groups
Senft et al
44
1997, USA
1.
intervention: delivered in two parts: a 30-second message from the primary care clinician and a 15-minute Mi session
2.
Control: usual care
• N = 524 12 months •
Drinking amount in units
•
Usual drinking amount per occasion
•
Health care utilization
At 12 months: • intervention patients reported fewer drinking days per week (2.7 vs 3.1;
P
=
0.04) than controls, but similar numbers of standard drinks
(157 vs 179;
P
=
0.13) and drinks per drinking day (3.6 vs 3.3;
P
=
0.20)
•
intervention patients were more likely than controls to report drinking within daily recommended limits (
#
3 for men,
#
2 for
women) (80% vs 73%;
P = 0.07) • N o si gn ifi ca nt d iff er en ce s in o th er d ri nk in g ou tc om es ( pe rc en t abstinent, fr
equency of drinking
$
6 drinks per drinking occasion,
es tim at ed p ea k bl oo d al co ho l c on ce nt ra tio n) , o r us e of m ed ic al car
e in the y
ear f
ollo
wing inter
vention
Soderstrom et al
45 2007, USA 1. Personalized M i 2. B iA • N = 497 •
Patients attending a trauma center
•
Any positive response to an item of the CAG
e, or
•
Drinking
.
2 times per week with
total weekly drinking of
$
8 drinks
for women and
$
15 for men, or
•
Drinking 2–4 times a month with typical daily consumption of $
4 drinks for women
and
$
5 drinks for men, or
•
Drinking
$
6 drinks on one
occasion, weekly, daily, or almost
daily
12 months
•
Number of drinks within the past 90 days
•
Number of binges within the last 90 days
• Within group significant declines in number of binge episodes during
the last 90 days and number of drinks during the last 90 days
•
No statistical significance between groups (final numbers not reported)
Abbreviations: AA, alcohol abuse; AD, alcohol dependence; ADS, Alcohol Dependence Scale; AR, at-risk drinking; AUDIT, alcohol use disorders identification test; BAC, blood alcohol content; BAI, brief alcohol intervention; BCC, behavioral change counseling; Bi , brief intervention; Bi A, brief intervention and advice; BM i, brief motivational interviewing; BN i, brief negotiated interview; CAG e, Cut down, Annoyed , Guilty, eye-opener; CAM i, culturally adapted motivational intervention; CDT, carbohydrate deficient transferrin; DrInC, Drinker Inventory of Conse quences; DWI, driving while intoxicated; ED, emergency department; HED, heavy episodic drinking; LAST, Luebeck alcohol dependence and abuse screening test; M-C iD i, Munich composite international diagnostic interview; MC v , mean cell volume; M i, motivational interviewing; N iAAA, National institute on Alcohol Abuse and Alcoholism; PCC, patient-centered care; PDF, personalized
drinking feedback; RAP
i, Rutgers alcohol problem index; SD, standard deviation; TLFB, time line follow back.
Patient Preference and Adherence downloaded from https://www.dovepress.com/ by 118.70.13.36 on 26-Aug-2020
Dovepress
Barrio and Gual
reported decreases from 13.27 to 4.72 and from 10.55 to
11.24 for the intervention and control group, respectively
(
P
=
0.04).
58Maisto et al reported significant decreases for
brief interventions but not for MI in the number of drinks in
the past month.
55Two studies reported on the amount of grams of alcohol
per week,
46,47with no significant differences between groups
at study end. These two studies also reported on the number of
drinks per drinking day, again failing to reach any significant
difference between groups. Noknoy et al also reported on
this outcome, finding a statistically significant difference at
6 months follow-up favoring the PCC group (2.26 vs 4.02;
P
=
0.018).
58Finally, five studies reported on the number of days
drinking. Three of them failed to find any significant
difference,
46,47,55whereas Monti et al reported a significant
difference in the time
×
treatment interaction favoring the
PCC group (4.52 vs 6.54 in the last month;
P
,
0.001).
57Sellman et al reported no difference regarding the percentage
of abstinent patients.
59Hazardous and heavy drinking
Ten studies reported outcomes related to heavy or
hazard-ous drinking. Curry et al reported a 19% difference between
groups in the proportion of patients reporting any at risk
drinking pattern, favoring the PCC group (42% vs 61%;
P
=
0.003).
51Allen et al failed to show any significant
dif-ference on the same outcome.
48Sellman et al reported a
significant decrease in the percentage of heavy drinking days
in the past 6 months favoring PCC (42.9% vs 65%).
59Sommers et al and Beich et al reported on the relative
risk of heavy drinking between groups. Although differences
favored the PCC group, they were not statistically significant
at study end.
49,60Three studies reported on the number of risky drinking
days in the last month. Brown et al did not find any
signifi-cant difference,
50whereas the other two reported statistically
significant differences favoring the PCC groups. D’Onofrio
et al reported a decrease from 7.5 and 7.2 to 4.7 and 5.1 versus
a decrease from 7.2 to 5.8 (
P
=
0.03).
52Monti et al reported
a statistically significant difference in the treatment
×
time
interaction (4.52 versus 6.54;
P
,
0.001).
57Longabaugh
et al found no significant difference in the number of heavy
drinking days between groups.
54Noknoy et al reported on the number of binge episodes
in the last week, with no significant differences between
groups,
58and Sommers et al reported on the maximum units
of alcohol in a 6-hour period, with no significant differences
between groups at study end.
60between groups.
43,45Brown et al (2007) reported a significant
difference only for men in the reduction in number of risky
drinking days (30% vs 12.9%, significance not reported),
31and Senft et al found no differences in the frequency of
risky drinking.
44Three studies reported the percentage of heavy drinkers at
study end. Two could not find any significant difference,
35,37while the remaining study by Bischof et al reported a
statistically significant difference only in the subgroup of
patients with alcohol abuse (25% vs 41.3%;
P
=
0.039), with
no difference in the alcohol-dependent or heavy episodic
drinking-only subgroups.
30Cherpitel et al reported a
non-significant difference in the percentage of at risk drinkers
between groups or in the maximum number of drinks per
occasion.
34Carey et al reported a medium effect size in peak
blood alcohol favoring the PCC group (significance not
reported),
32while Senft et al reported no significant
differ-ence in this outcome.
44Scores
Bazargan-Hejazi et al reported a nonsignificant difference in
the percentage of patients changing their drinking risk status
according to the Alcohol Use Disorders Identification Test
(AUDIT) score.
29In the subgroup of moderate risk (scores
7–18), the PCC group had a larger reduction (34% vs 13%;
P
=
0.0099). Daeppen et al reported a nonsignificant
differ-ence between groups regarding the change in the AUDIT
score.
35More than one session PCC with no active
comparator
Fifteen studies were included in this subgroup (Table 2).
46–60Taken together, data show mixed results, with some studies
reporting significant differences between groups, whereas
others do not.
Amount and frequency of alcohol consumption
Nine studies reported data regarding the amount of alcohol
consumption. Five studies reported it in the form of units of
alcohol per week.
49,51,52,57,58Two failed to show statistically
significant differences between groups,
49,51while the other
three reported significant differences for the intervention
groups.
52,57,58The amount of alcohol consumption in the
two intervention groups in D’Onofrio et al decreased from
20.4 and 19.8 to 13.0 and 14.3, respectively, while that in
the control group ranged from 20.9 to 17.6 (
P
=
0.045).
52The reductions in Monti et al for the intervention and the
control group were 13.07–6.10 and 10.77–8.83, respectively
(
P
,
0.01 in the treatment
×
time interaction).
57Noknoy et al
Patient Preference and Adherence downloaded from https://www.dovepress.com/ by 118.70.13.36 on 26-Aug-2020
Dovepress Systematic review of patient-centered care
Table 2
More than one session patient-centered counseling – no active comparator
Study
Intervention
Patients
Follow-up times
Outcomes reported
Key findings
Aalto et al
46
2000, Finland
1.
B
i sessions at 0, 2, 6, 12, 18, 24, and 30 months (10–20 minutes based on FRAM
eS)
2.
B
i sessions at 0, 12, and 24 months
3.
Control: patients were advised to reduce drinking and contact GP in the event of health problems
•
N
=
118
•
Female patients consecutively attending four primary care health clinics and one occupational health care clinic
•
Heavy drinker with self-reported alcohol consumption
$
190 g of absolute ethanol
per week
•
And/or
$
2 affirmative answers on
CAG
e
36 months
•
Drinking amount per week
•
Drinking frequency per week
•
Drinking amount per occasion
•
CDT
•
GGT
•
No differences between or within groups at 3 years in alcohol consumption variables
•
Significant reductions within all groups in MCV
•
GGT decreased in intervention groups, while not in the control group (difference not statistically significant)
Aalto et al
47
2001, Finland
1.
B
i sessions at 0, 2, 6, 12, 18, 24, and 30 months (10–20 minutes based on FRAM
eS)
2.
B
i sessions at 0, 12, and 24 months
3.
Control: patients were advised to reduce drinking and contact GP in the event of health problems
•
N
=
296
•
Male patients
•
Heavy drinker with self-reported alcohol consumption
$
280 g of absolute ethanol
per week
•
And/or
$
3
affirmative
answers
on
CAGE
36 months
•
Drinking amount per week
•
Drinking frequency per week
•
Drinking amount per occasion
•
CDT
•
GGT
Grams of alcohol per week: • intervention groups decreased from 270 (251) and 284 (262) to 272 (302) and 290 (273), respectively; control group decreased from 308 (337) to 338 (371). Differences not significant Drinking frequency per week: • intervention groups increased from 2.0 (1.6) and 2.4 (1.6) to 2.0 (1.8) and 2.6 (1.8), respectively; control group increased from 2.3 (1.8) to 2.4 (1.9). Differences not significant Usual drinking amount per occasion in grams: • intervention groups decreased from 154 (86) and 131 (80) to 151 (89) and 125 (76), respectively. Control group increased from 130 (83) to 137 (82). Differences not significant Significant decreases within groups for all groups in MCV: • intervention groups from 94.5 (4.2) and 94.2 (4.2) to 93.7 (4.1) and
93.2 (4.2); control
group
from
94.5 (4.0)
to 93.2 (3.9)
Allen et al
48
2011, Russia
1.
M
i up to four sessions
2.
Control
•
N
=
441
•
Male
patients
aged
25–54
years
recruited
from a longitudinal observational study (the
izhevsk Family Study
ii)
•
Criteria for hazardous and harmful drinking were: Zapoi
in the last year (behavior
resulting in
$
2 days of continuous
drunkenness)
3 months
•
Self-report of hazardous and harmful drinking
Hazardous drinking over previous month: • intervention group decreased from 70.5% to 47.5%, control group reduced from 73.8% to 54.0%. Differences not significant (AOR 0.64, 95% CI 0.39–1.06)
(
Continued
)
Patient Preference and Adherence downloaded from https://www.dovepress.com/ by 118.70.13.36 on 26-Aug-2020
Dovepress
Barrio and Gual
Table 2
(
Continued
)
Study
Intervention
Patients
Follow-up times
Outcomes reported
Key findings
Drinking surrogates (nonbeverage alcohols) in the last year Hangover and/or excessive drunkenness and/or going to sleep clothed due to being drunk twice or more per week on average over the past year weekly consumption of 250 mL or more of ethanol (from beverages) over the past year
Beich et al
49
2007, Denmark
1.
B
i (
10
-m
in
ut
e
se
ss
io
n
an
d
follow-up session with GP)
2.
Control – no intervention
•
N
=
906
•
Listed patients aged 18–64 years, scheduled to see their GP
•
AUD
iT score
$
8
12–14 months
•
Drinking frequency
•
Drinking diary
•
Binge drinking
•
AUD
iT score
•
Compliance
Units of alcohol per week: • intervention group increased from 12.8 (8.7) to 13.5 (11.1); control group increased from 12.9 (9.0) to 13.6 (11.7) • Differences not significant
Brown et al
50
2007, USA
1.
Male intervention M
i
(six sessions)
2.
Male control
3.
Female intervention Mi (six sessions)
4.
Female control
•
N
=
897
•
Patients (21–59 years) who exceeded recommendations on low-risk drinking
•
DSM-IV
criteria for alcohol abuse or
dependence
•
No alcohol treatment in the past 3 months
•
Men who exceeded 56 standard drinks in 28 days and men who had
.
4
standard drinks in any 1 day
•
w
omen who exceeded 44 drinks in
28 days and women who had
.
3 drinks
in any 1 day
3 months
•
Number of drinks per month
•
Risky drinking days per month
Men in the intervention group: • 17.3% decrease in 28-day alcohol consumption in standard drinks (from 69.4 to 57.4;
P
,
0.001)
•
30% decrease in number of risky drinking days (from 6.2 to 4.3;
P
,
0.001)
Men in the control group: • 12.9% decrease in 28-day alcohol consumption in standard drinks (from 82.1 to 71.5;
P
=
0.002)
•
8.3% decrease in number of risky drinking days (from 7.2 to 6.6;
P
=
0.009)
•
Decreases in the intervention group significantly larger
Women in the intervention group: • 15.7% decrease in 28-day alcohol consumption in standard drinks (from 50.4 to 42.5;
P
,
0.001)
•
20.7% decrease in number of risky drinking days (from 5.8 to 4.6;
P
,
0.001)
Women in the control group: • 13.5% decrease in 28-day alcohol consumption in standard drinks (
P
,
0.001)
•
15.4% decrease in number of risky drinking days (P,
0.001)
•
No differences between groups
Patient Preference and Adherence downloaded from https://www.dovepress.com/ by 118.70.13.36 on 26-Aug-2020
Dovepress Systematic review of patient-centered care
Curry et al
51
2003, USA
1.
B
i
2.
Control
•
N
=
307
•
Outpatients visiting their primary care provider
•
Consuming an average of
$
2 alcoholic
drinks per day in the past month (chronic drinking)
•
$
2 episodes of binge drinking (defined
as consuming
$
5 drinks on a single
occasion) in the past month
•
$
1 episode of driving after consuming
$
3 drinks
12 months
•
Prevalence of at-risk drinking practices and weekly alcohol consumption
Any at risk drinking pattern reported at 12 months: • intervention group 57%, control group 43% (
P
=
0.003)
Drinks per week: • intervention group reduced from 14.93 (0.82) to 9.3; control group reduced from 13.56 (0.83) to 9.5. Differences not statistically significant (
P
=
0.40)
D’Onofrio et al
52
2012, USA
1.
BN
i
2.
BN
i
+
booster phone call
at 1 month
3.
Standard care (screening with health questionnaire)
•
N
=
889
12 months
•
Past 7-day alcohol consumption
•
Number of binge-drinking episodes in the past 28 days (.4 drinks per occasion for men and
.
3 drinks per
occasion for women)
Mean number of drinks in the past 7 days: • intervention groups reduced from 20.4 (18.8–22.0) and 19.8 (18.3–21.4) to 13.0 (10.5–15.5) and 14.3 (11.9–16.8); control group reduced from 20.9 (18.7–23.2) to 17.6 (14.1–21.2). Differences statistically significant (
P
=
0.045)
Mean number of binge days in past 28 days: • intervention groups reduced from 7.5 (6.8–8.2) and 7.2 (6.5–7.9) to 4.7 (3.9–5.6) and 5.1 (4.2–5.9); control group reduced from 7.2 (6.2–8.2) to 5.8 (4.6–7.0) • Differences statistically significant (
P
=
0.03)
Hermansson et al
53
2010, Sweden
1.
Comprehensive intervention: patients were offered
#
3 sessions
(B
i
+
TLFB
+
drinking
diary over 4 weeks)
2.
B
i (one 15-minute session)
3.
Control: no feedback on screening or verbal counseling
•
N
=
194
•
Adults presenting to an
eD
12 months
•
Change in percentage of patients with AUD
iT positive
Change in AUDIT status: • Overall, 51.3% of patients tested positive at baseline, and 22.8% at follow-up (
-56% reduction,
P
,
0.0001)
•
No
significant differences
between groups
intervention
groups reduced 1.55 (2.47) and 1.11 (1.95) points, respectively; controls reduced 1.11 (2.12) points (P=
0.57)
Longabaugh et al
54
2001, USA
1.
B
i (40 minutes in
eD)
+
booster M
i session
2.
B
i (single 40-minute session)
3.
Standard care
•
N
=
539
•
Adults attending an
eD
•
Assessed as a hazardous or harmful drinker; defined by one of three criteria Breath alcohol positive (BAC
.
0.003 mg/dL)
Reported having ingested alcohol in the 6 hours prior to their injury AUD
iT score
$
8
12 months
•
Number of heavy drinking days
•
Negative consequences from drinking (Dr
inC)
•
Alcohol-related injuries (iBC-R)
Number of heavy drinking days: • Bi
with booster session had a mean of 1.68 (1.15),
Bi
of 1.72 (1.23) and standard care 1.70 (1.09)
•
Differences between groups not significant
DrInC inventory: • Bi
with booster had the lowest score, with 2.24
(0.082). B
i was 2.40 (0.078) and standard care was
2.52 (0.076)
•
Differences between groups statistically significant (P=
0.005)
(
Continued
)
Patient Preference and Adherence downloaded from https://www.dovepress.com/ by 118.70.13.36 on 26-Aug-2020
Dovepress
Barrio and Gual
Table 2
(
Continued
)
Study
Intervention
Patients
Follow-up times
Outcomes reported
Key findings
Maisto et al
55
2001, USA
1.
M
eT (30–45 minutes
session
+
two booster
sessions)
2.
B
i (1
×
10–15 minutes
session)
3.
Standard care
•
N
=
301
•
Adults attending a primary care clinic
•
AUD
iT score
$
8
•
Or
$
16 standard (0.6 oz ethanol) drinks
per week for men and
$
12 drinks for
women
12 months
•
Number of drinks in past 30 days
•
Drinks per drinking days, past 30 days
•
Number of days in the past month in which patients had between 1–6 drinks
Days abstinent: • Motivational enhancement therapy group showed the greatest reduction in the difference between baseline to 12-month follow-up:
-3.58 (
-5.57,
-1.58).
Bi
reduced
-2.54 (
-4.56,
-0.53), and standard
care
-1.16 (
-2.67,
-0.34)
•
Regression models showed no significant differences between either M
eT or B
i vs SC
Number of drinks: • Motivational enhancement therapy group showed a reduction in the difference between baseline to 12-month follow-up of 22 drinks (11.65, 32.32). Bi
reduced 33.20 (18.21, 48.19), and standard care
reduced 14.24 (4.21, 24.26)
•
Regression models showed no significant differences between M
eT vs SC. B
i showed a regression
coefficient of
-1.27 (
P
,
0.05)
Drinks per drinking day: • Motivational enhancement therapy group showed a reduction in the difference between baseline to 12-month follow-up of 1.30 (0.64, 1.96). B
i reduced
1.55 (0.79, 2.32), and standard care 1.48 (0.85, 2.11)
•
Regression models showed no significant differences between either M
eT or B
i vs SC
Mello et al
56
2013, USA
1.
BM
i
2.
Standard care
•
N
=
285
•
Patients attending the
eD
•
$
14 drinks/week for male subjects,
$
7 drinks/week for female subjects
•
Or
$
5 drinks/occasion for males,
$
4 drinks/occasion for females
12 months
•
Changes in AUD
iT-C
•
Alcohol-related injuries
•
Dr
inC score
AUDIT-C score AUD
iT-1:
•
The intervention group decreased from 2.76 (0.89) to 2.33 (0.94); the control group decreased from 2.74 (0.83) to 2.31 (1.07). Differences at 12 months not statistically significant (
P
=
0.87)
AUD
iT-2:
•
The intervention group decreased from 1.53 (1.14) to 1.15 (1.03); the control group decreased from 1.59 (1.12) to 1.16 (1.14). Differences at 12 months not statistically significant (
P
=
0.0.97)
AUD
iT-3:
•
The intervention group decreased from 1.84 (1.16) to 1.41 (1.13); the control group decreased from 1.88 (1.01) to 1.51 (1.16). Differences at 12 months not statistically significant (
P
=
0.52)
Patient Preference and Adherence downloaded from https://www.dovepress.com/ by 118.70.13.36 on 26-Aug-2020