R E S E A R C H A R T I C L E
Open Access
Depth segregation and diet disparity revealed by
stable isotope analyses in sympatric herbivorous
cichlids in Lake Tanganyika
Hiroki Hata
1*, Jyunya Shibata
2,3, Koji Omori
2, Masanori Kohda
4and Michio Hori
5Abstract
Background:Lake Tanganyika in the African Great Rift Valley is known as a site of adaptive radiation in cichlid fishes. Diverse herbivorous fishes coexist on a rocky littoral of the lake. Herbivorous cichlids have acquired multiple feeding ecomorphs, including grazer, browser, scraper, and scooper, and are segregated by dietary niche. Within each ecomorph, however, multiple species apparently coexist sympatrically on a rocky slope. Previous observations of their behavior show that these cichlid species inhabit discrete depths separated by only a few meters. In this paper, using carbon (C) and nitrogen (N) stable isotope ratios as markers, we followed the nutritional uptake of cichlid fishes from periphyton in their feeding territories at various depths.
Results:δ15N of fish muscles varied among cichlid ecomorphs; this was significantly lower in grazers than in browsers and scoopers, althoughδ15N levels in periphyton within territories did not differ among territorial species. This suggests that grazers depend more directly on primary production of periphyton, while others ingest animal matter from higher trophic levels. With respect toδ13C, only plankton eaters exhibited lower values, suggesting that these fishes depend on production of phytoplankton, while the others depend on production of periphyton. Irrespective of cichlid ecomorph,δ13C of periphyton correlated significantly with habitat depth, and decreased as habitat depth became deeper.δ13C in territorial fish muscles was significantly related to that of periphyton within their territories, regardless of cichlid ecomorph, which suggests that these herbivorous cichlids depend on primary production of periphyton within their territories.
Conclusions:Carbon and nitrogen stable isotope ratios varied among ecomorphs and among cichlid species in the same ecomorphs sympatrically inhabiting a littoral area of Lake Tanganyika, suggesting that these cichlids are segregated by nutrient source due to varying dependency on periphyton in different ecomorphs (especially between grazers and browsers), and due to segregation of species of the same ecomorph by feeding depth, grazers and browsers in particular.
Keywords:Tanganyikan cichlid, Stable isotope, Herbivore, Ecomorph, Adaptive radiation
Background
Cichlid fish communities in Lake Tanganyika are a mag-nificent example of adaptive radiation, in which mulitple species rapidly evolve from a common ancestor as a con-sequence of their adaptation to various ecological niches. After the formation of the lake 9–12 Ma, more than 200 species have diverged from eight colonizing lineages [1-4].
In a rocky littoral of Lake Tanganyika, 17 species of herbivorous cichlids coexist [5,6]. These include 11 Tropheini, three Lamprologini, one Ectodini, one Eretmo-dini, and one Tilapini species (Table 1). Therefore, this herbivorous fish community has become established through repetitive adaptations to herbivory in these cichlid tribes [4].
Tanganyikan cichlids are unique in the richness of convergent forms that evolved in the lake and coexist in similar habitats [4]. Five tribes of the family have ac-quired multiple herbivorous feeding ecomorphs; spe-cifically, grazer, browser, scooper, and scraper [7-10]. * Correspondence:hata@sci.ehime-u.ac.jp
1
Graduate School of Science and Engineering, Ehime University, 2-5 Bunkyo, Matsuyama, Ehime, Japan
Full list of author information is available at the end of the article
Grazers comb unicellular algae from epilithic assemblages using multiple rows of similar-sized slender teeth with fork-like tricuspid tips [11,12]. Browsers nip and nibble filamentous algae using their bicuspid teeth, which line the outermost edges of both jaws [9]. Scoopers protrude and thrust their jaws into sand, intake a small amount of sand, and then eject it from the mouth or gill-openings to filter prey [13,14]. Scrapers rub epiphyton from rock sur-faces using several rows of chisel-like teeth [15]. Fishes in each feeding ecomorph exhibit distinct specialized morph-ologies, such as jaw structure [8,16] and intestine length [17,18], physiological abilities, such as specific digestive enzymes [17], and specialized behaviours such as cropping frequency, substratum choice for feeding [7,16] and terri-toriality [19,20]. How do sympatric herbivorous cichlid species specialize by feeding depth and consequent food-source segregation to enable coexistence of closely relative species with similar feeding ecomorphs?
Carbon and nitrogen stable isotope ratios were used as indicators of material flow from primary producers to herbivorous cichlids. Stable carbon isotopes are known to vary by water depth due to light intensity, photosyn-thetic activity and consequent dissolved CO2availability
differ along water depth [21-23]. This value can thus in-dicate the relative depth at which the carbon source of cichlid fish is produced. The dependence of cichlids on primary production can be estimated by nitrogen stable isotope ratio. The composition of algal farms and stomach contents were analyzed by an amplicon metagenomics ap-proach in a previous study [6], and it shows that algal farm composition is varied in the axis of depth, but stomach contents are highly variable among cichlid species, even those inhabiting similar depth ranges. Stomach content analyses show directly what is ingested, but there are limi-tations; not all ingested material is assimilated, some food items are dissolved in the stomach more quickly than
Table 1 Study species of herbivorous fishes in Lake Tanganyika and their ecomorphs based on feeding habits, territoriality, and the number of samples we collected
Tribe Species Abbreviation Feeding
ecomorph
Feeding territory
Number of algal farms
Sampling depth (m)
Number of fish individuals
Reference
Tilapiini Oreochromis tanganicae Otan biter no - - 5 [13,52]
Ectodini Xenotilapia papilio Xpap scooper breeding
pairs only
- - 5 [13,14]
Eretmodini Eretmodus cyanostictus Ecya scraper breeding
pairs only
5 2.2(1.9-2.4) 5 [53,54]
Lamprologini Telmatochromis temporalis Ttem browser yes 4 8.1(2.4-19.6) 5 [7,55]
Lamprologini Telmatochromis vittatus Tvit browser no - 5 [56]
Lamprologini Variabilichromis moorii Vmoo browser yes 5 4.6(2.5-6.7) 5 [57]
Tropheini Interochromis loocki Iloo grazer dominant
males only
3 6.8(3.1-13.0) 5 [39]
Tropheini Pseudosimochromis curvifrons Pcur browser dominant
males only
5 1.3(1.0-2.1) 5 [7,20]
Tropheini Petrochromis famula Pfam grazer dominant
males only
- - 5 [19]
Tropheini Petrochromis fasciolatus Pfas grazer dominant
males only
- - 5 [58,59]
Tropheini Petrochromis macrognathus Pmac grazer yes 5 0.3(0.3-0.4) 5 [60]
Tropheini Petrochromis polyodon Ppol grazer yes 4 3.0(2.5-3.3) 5 [7]
Tropheini Petrochromis horii Phor grazer yes 3
15.2(15.0-15.7)
4 [61]
Tropheini Petrochromis trewavasae Ptre grazer yes 6
10.1(6.4-13.7)
5 [7]
Tropheini Simochromis diagramma Sdia browser no - - 5 [7]
Tropheini Tropheus moorii Tmoo browser yes 3 8.7(6.0-10.5) 5 [7,16,62]
Tropheini Limnotilapia dardennii Ldar browser no - - 5 [10]
non-cichlid Lamprichthys tanganicanus Ltan plankton
eater
no - - 5 [63]
non-cichlid mixed ofStolothrissa tanganicae andLimnothrissa miodon
Kape plankton
eater
no - - 5 [63]
others, and stomach content reflects feeding during only the short periods immediately before capture [24-26]. Therefore, in addition to stomach content analysis, stable isotope markers that provide time-integrated information can be useful tools for determining dietary sources for each cichlid species and clarifying the basis of their dietary segregation.
On a rocky littoral in Lake Tanganyika, we observed algal farms of 10 herbivorous cichlid species, measured the water depth, and collected periphyton inside the farms. At the same time, specimens of 17 herbivorous cichlid species sympatrically inhabiting a rocky shore and three plankton-eating fishes were collected. Algal farms and fish muscles were analyzed using carbon and stable isotope analyses.
Methods
Sampling for stable isotope analysis
This study was performed in accordance with the Regu-lations on Animal Experimentation at Ehime University. Approval is not needed for experimentation on fishes under Japanese law, Act on Welfare and Management of Animals. We sampled 17 species of herbivorous cichlids from Kasenga Point (8°43′S, 31°08′E) near Mpulungu, Zambia at the southern tip of Lake Tanganyika in November 2010 using gill net (Table 1). The dorsal white muscles of fishes were excised and dried for stable isotope analyses. Periphyton samples were
simultaneously collected from 10 territorial cichlid spe-cies. Each periphyton sample was collected from each territory of cichlid. We defined the territory as the place where the territory holder fed on periphyton and defended against conspecific and heterospecific herbi-vores [27]. Whether a site was located within or outside of a cichlid fish territory was determined by 20 min of observation immediately prior to sampling. Periphyton samples were dried for stable isotope analysis.
Stable isotope analysis
The stable isotope ratio of nitrogen (N) is useful in trophic level analysis as the nitrogen pools of animals have δ15N signatures regularly enriched by a certain value (typically, 3.4‰) relative to their food sources [28]. Stable isotope ratios of carbon (C) differ strongly among terrestrial plants, phytoplankton, and benthic algae [29], and can be used as tracers of C pathways within food webs. Samples of fish muscles, benthic animals, detritus, and periphyton collected from cichlid territories were dried in an oven at 60°C for 24 h, and ground into fine powder. The fish and benthic animal samples were treated with 2:1 chloroform:methanol solution for 24 h to remove lipid [30]. The periphyton and detritus sam-ples were treated with 1.0 N HCl for 24 h and then washed with distilled water twice to remove mineral car-bon. These treated samples were dried in an oven at 60°C for 24 h, again. C and N stable isotope ratios (per
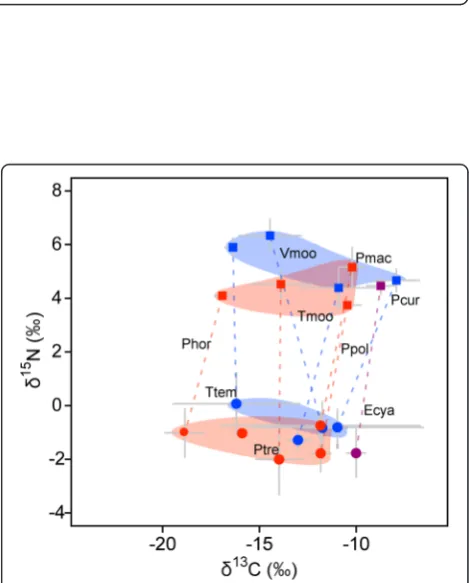
Figure 1δ13C-δ15N map for herbivorous cichlids, periphytons inside their algal farms, and other potential dietary items such as benthic animals,
mil) were measured using a continuous flow isotope ratio mass spectrometer (SerCon, LTD., ANCA-SL). Stable isotopes were measured as a delta (δ) value in units of per thousand deviations from the standards (‰) and are calculated as δX = [(Rsample/Rstandard) − 1] × 103, where X is15N or 13C, andRis the ratio of the heavy (15N or13C) to the light (14N or12C) isotope.
Statistical analysis for stable isotope data
We analyzedδ15N and δ13C values of fish muscles and periphyton within their feeding territories using a gen-eralized linear mixed model (GLMM). The category of ecomorph was included as a fixed factor, and cichlid species as a nested factor. GLMM was conducted by an
Table 2 Results of generalized linear mixed-model analyses to test the effect of cichlid ecomorphs on carbon and nitrogen stable isotope ratios of their muscles δ13
C
Ecomorph Estimate SE DF tvalue p
Intercept (biter) −15.75 2.69 13.0 −5.86 <0.001
browser 2.51 2.87 13.0 0.88 NS
grazer 2.76 2.87 13.0 0.96 NS
plankton eater −5.29 3.29 13.0 −1.61 NS
scooper 0.42 3.80 13.0 0.11 NS
scraper 7.02 3.80 13.0 1.85 NS
Post-hoc test Estimate SE zvalue p
browser-biter 2.51 2.87 0.88 NS
grazer-biter 2.76 2.87 0.96 NS
plankton eater-biter −5.29 3.29 −1.61 NS
scooper-biter 0.42 3.80 0.11 NS
scraper-biter 7.02 3.80 1.85 NS
grazer-browser 0.25 1.44 0.17 NS
plankton eater-browser −7.80 2.15 −3.62 <0.01
scooper-browser −2.10 2.87 −0.73 NS
scraper-browser 4.50 2.87 1.57 NS
plankton eater-grazer −8.05 2.15 −3.74 <0.01
scooper-grazer −2.34 2.87 −0.82 NS
scraper-grazer 4.26 2.87 1.48 NS
scooper-plankton eater 5.70 3.29 1.73 NS
scraper-plankton eater 12.30 3.29 3.74 <0.01
scraper-scooper 6.60 3.80 1.74 NS
δ15
N
Ecomorph Estimate SE DF tvalue p
Intercept (biter) 3.87 0.81 13.0 4.77 <0.001
browser 1.64 0.87 13.0 1.89 NS
grazer 0.30 0.87 13.0 0.34 NS
plankton eater 2.13 0.99 13.0 2.14 NS
scooper 2.29 1.15 13.0 2.00 NS
scraper 0.60 1.15 13.0 0.52 NS
Post-hoc test Estimate SE zvalue p
browser-biter 1.64 0.87 1.89 NS
grazer-biter 0.30 0.87 0.34 NS
plankton eater-biter 2.13 0.99 2.14 NS
scooper-biter 2.29 1.15 2.00 NS
scraper-biter 0.60 1.15 0.52 NS
grazer-browser −1.34 0.43 −3.10 <0.05
plankton eater-browser 0.49 0.65 0.75 NS
scooper-browser 0.65 0.87 0.75 NS
scraper-browser −1.04 0.87 −1.20 NS
plankton eater-grazer 1.83 0.65 2.82 <0.05
Table 2 Results of generalized linear mixed-model analyses to test the effect of cichlid ecomorphs on carbon and nitrogen stable isotope ratios of their muscles
(Continued)
scooper-grazer 1.99 0.87 2.30 NS
scraper-grazer 0.30 0.87 0.35 NS
scooper-plankton eater 0.16 0.99 0.16 NS
scraper-plankton eater −1.53 0.99 −1.54 NS
scraper-scooper −1.69 1.15 −1.47 NS
Species are included as a nested factor of ecomorph. SE, standard error; DF, degree of freedom; NS, not significant.
Table 3 Results of the generalized linear mixed-model analysis for testing the effect of cichlid ecomorph on carbon and nitrogen stable isotope ratios of periphyton within their territories
δ13C
Ecomorph Estimate SE DF tvalue p
Intercept (browser) −13.17 1.20 6.4 −10.98 <0.001
grazer −1.24 1.61 6.4 −0.77 NS
scraper 3.12 2.63 5.9 1.19 NS
Post-hoc test Estimate SE zvalue p
grazer-browser −1.24 1.61 −0.77 NS
scraper-browser 3.12 2.63 1.19 NS
scraper-grazer 4.36 2.57 1.69 NS
δ15N
Ecomorph Estimate SE DF tvalue p
Intercept (browser) −0.81 0.30 7.0 −2.70 <0.05
grazer −0.57 0.41 7.2 −1.41 NS
scraper −1.17 0.65 6.1 −1.80 NS
Post-hoc test Estimate SE zvalue p
grazer-browser −0.57 0.41 −1.41 NS
scraper-browser −1.17 0.65 −1.80 NS
scraper-grazer −0.59 0.64 −0.93 NS
R package, lmerTest 2.0-3. Tukey’s post-hoc test was applied to compare mean differences between ecomorphs using the glht function in the multcomp package in R. The differences of δ15N and δ13C values of fish muscles and periphyton within their territories were analyzed using
a generalized linear model (GLM) for each ecomorph using cichlid species as a fixed factor. GLM is conducted by glm function in R 3.0.2 [31]. Tukey’s post-hoc test was applied to compare mean differences between species using the glht function in the multcomp package in R. To test the effect of depth on δ13C andδ15N of algal farms, GLMM was conducted with depth as a fixed factor and cichlid species as a random factor. A GLMM was also conducted to test the effect of C and N stable isotope ra-tios in periphyton and cichlid ecomorphs on the isotope ratios in the muscles of territorial cichlids. Species were included as a random factor.
Stable isotope mixing model
Probability distributions for the proportional contribu-tions of the potential dietary sources to the diet of each
Table 4 Results of generalized linear models for testing the effect of cichlid species of each ecomorph on carbon and nitrogen stable isotope ratios of their muscles
δ13
C
browser
Estimate SE tvalue p
Intercept (Ldar) −16.9 0.7 −25.3 <0.001
Pcur 9.0 0.9 9.5 <0.001
Sdia 3.4 0.9 3.6 <0.01
Tmoo 6.0 0.9 6.3 <0.001
Ttem 0.5 0.9 0.6 NS
Tvit 4.3 0.9 4.6 <0.001
Vmoo 2.5 0.9 2.6 <0.05
grazer
Estimate SE tvalue p
Intercept (Iloo) −14.4 0.6 −25.2 <0.001
Pfam 1.9 0.8 2.3 <0.05
Pfas 1.8 0.8 2.3 <0.05
Pmac 4.2 0.8 5.2 <0.001
Ppol 3.9 0.8 4.9 <0.001
Phor −2.5 0.9 −2.9 <0.01
Ptre 0.5 0.8 0.6 NS
δ15
N
browser
Estimate SE tvalue p
Intercept (Ldar) 6.2 0.3 24.3 <0.001
Pcur −1.6 0.4 −4.3 <0.001
Sdia −0.1 0.4 −0.3 NS
Tmoo −1.8 0.4 −5.1 <0.001
Ttem −0.3 0.4 −0.9 NS
Tvit −1.3 0.4 −3.7 <0.001
Vmoo 0.1 0.4 0.3 NS
grazer
Estimate SE tvalue p
Intercept (Iloo) 3.6 0.2 16.5 <0.001
Pfam 0.3 0.3 0.9 NS
Pfas 0.6 0.3 2.0 NS
Pmac 1.6 0.3 5.3 <0.001
Ppol 0.2 0.3 0.6 NS
Phor 0.5 0.3 1.7 NS
Ptre 1.0 0.3 3.2 <0.01
SE, standard error; NS, not significant.
Table 5 Results of generalized linear models for testing the effect of herbivorous cichlid species of each ecomorph on carbon and nitrogen stable isotope ratios of periphyton within their territories
δ13C
browser
Species Estimate SE tvalue p
Intercept (Pcur) −11.6 1.3 −9.1 <0.001
Tmoo −1.4 2.1 −0.7 NS
Ttem −4.5 1.9 −2.3 <0.05
Vmoo −0.5 1.8 −0.3 NS
grazer
Species Estimate SE tvalue p
Intercept (Iloo) −15.9 1.6 −10.2 <0.001
Pmac 3.2 2.0 1.6 NS
Ppol 4.1 2.1 2.0 NS
Phor −2.9 2.2 −1.3 NS
Ptre 2.3 1.9 1.2 NS
δ15N
browser
Estimate SE tvalue p
Intercept (Pcur) −1.0 0.4 −2.3 <0.05
Tmoo −0.3 0.7 −0.5 NS
Ttem 1.0 0.6 1.7 NS
Vmoo −0.1 0.6 −0.2 NS
grazer
Estimate SE tvalue p
Intercept (Iloo) −1.0 0.5 −2.0 NS
Pmac 0.2 0.7 0.3 NS
Ppol −0.7 0.7 −1.1 NS
Phor 0.0 0.7 0.0 NS
Ptre −1.1 0.7 −1.7 NS
cichlid species were determined using the Bayesian stable isotope mixing model (MixSIAR), using MixSIAR GUI 1.0 [32,33]. δ15N and δ13C of each cichlid species were used as mixture data, and the same values from periphyton within territories defended by each cichlid species and those of other benthic animals and detritus were used as source data, together with their C and N concentration values. Markov Chain Monte Carlo pa-rameters were set as follows, chain length = 50,000, burn in = 25,000, thin = 25, number of chains = 3. Trace plots and the result of Gelman-Rubin, Heidelberger-Welch, and Geweke diagnostic tests were used to confirm that the model had converged [33]. Discrimination values for
δ15
N andδ13C were provided as 3.4 ± 1.5‰ and 0.9 ±
Figure 2Habitat depth of each cichlid species(A)and relation between habitat depth andδ13C of periphyton(B). Dotted line in B indicates the fitted line. Red, blue, and purple colors indicate cichlid ecomorph, grazer, browser, and scraper, respectively.
Table 6 Results of the generalized linear mixed-model analysis testing the effect of habitat depth on carbon and nitrogen stable isotope ratios of algal farms
Estimate SE DF tvalue p
δ13C
(Intercept) −11.64 0.88 8.7 −13.19 <0.001
depth 0.35 0.13 12.2 −2.69 <0.05
δ15N
(Intercept) −1.06 0.32 9.3 −3.30 <0.01
depth 0.03 0.05 12.8 −0.65 NS
Cichlid species was analyzed as a random factor. SE, standard error; DF, degree of freedom; NS, not significant.
Figure 3δ13C-δ15N map for herbivorous cichlids (square plots) and
1.1‰ [average ± standard deviation (SD)], respectively following Cabana and Rasmussen [28] and Harvey et al. [34], but SD of δ15N was enlarged because the discrimination value ofδ15N can be larger in herbivor-ous fishes [35,36].
Results and discussion
Difference in C and N stable isotope ratios among ecomorphs
δ13
C andδ15N stable isotope ratios of herbivorous cichlid muscles and periphyton within their algal farms varied widely as shown in Figure 1. As a result of GLMMs, both
δ13
C andδ15N values of cichlid muscles were significantly different among feeding ecomorphs (Table 2). The muscle
δ15
N was significantly lower in grazer than browsers, al-thoughδ15N values of periphyton within territories were not different among territorial species (Tables 2 and 3),
suggesting that grazers depend more directly on primary production of periphyton, while others ingest animals with higher trophic level. This result agrees with the observa-tions in previous studies. Previous studies show that grazers comb unicellular algae and cyanobacteria from the epiphytic assemblages using brush-like jaws [11,12,37], and animals were rarely found in their stomachs [7,10,38]. On the other hand, browsers nip and nibble filamentous algae and cyanobacteria using their nail clipper-like jaws [8,16,37], and Telmatochromis temporalis, Limnotilapia dardennii, andSimochromis diagramma ingest ephemer-opteran and dipteran larvae, and fish fry [7,10,38].
Xenotilapia papilio, a scooper, had a relatively high value of δ15N (Figure 1), partly as this fish intakes and filters sand to capture diptera and copepoda, as well as algae and cyanobacteria within sand [14,38].
With regard to δ13C, plankton eaters (Limnothrissa miodon and Stolothrissa tanganicae) had significantly lower values, suggesting that these fishes depend on phytoplankton as a carbon source as δ13C of phyto-plankton is known to be lower than that of benthic algae [29]. On the other hand, no significant difference was found in δ13C among the other ecomorphs, sug-gesting that all of the herbivorous cichlids depend on periphyton as carbon source.
Difference among species within ecomorphs
In both browsers and grazers, muscleδ15N andδ13C dif-fered significantly among species (Table 4). Muscleδ13C of L. dardennii and T. temporalis were significantly smaller than that of the other browsers,δ13C of Petrochro-mis horii was smallest, and that of Interochromis loocki, and P. trewavasae were intermediate, and the values of other grazers were significantly higher (Table 4). Although
δ13
C of their algal farms were not significantly varied between species in grazers (Table 5), significant positive
Table 7 Results of generalized linear mixed model for testing the effect ofδ13C/δ15N in the periphyton within territories and the effect of fish ecomorph onδ13C/δ15N of cichlid muscles
Estimate SE DF tvalue p
δ13C
(Intercept) 1.7 4.8 5.1 0.4 NS
δ13C in periphyton 1.1 0.4 5.1 3.0 <0.05
grazer in ecomorph 0.6 1.6 5.0 0.4 NS
scraper in ecomorph 0.3 2.8 5.0 0.1 NS
δ15N
(Intercept) 5.8 0.6 5.0 10.0 <0.001
δ15N in periphyton 0.5 0.5 5.0 1.0 NS
grazer in ecomorph −0.6 0.6 5.0 −0.9 NS
scraper in ecomorph −0.2 1.1 5.0 −0.2 NS
Fish species are included as a random factor. SE, standard error; DF, degree of freedom.
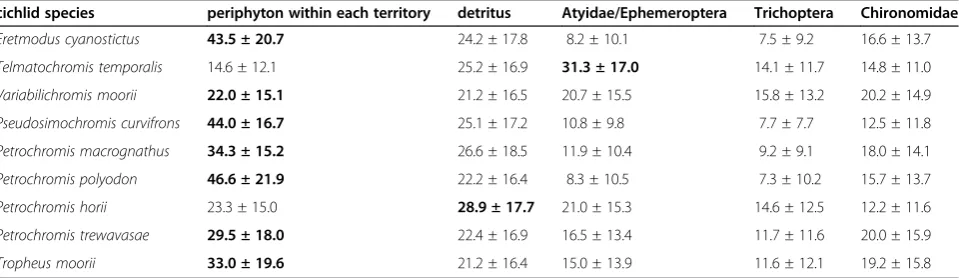
Table 8 Predicted diet proportion of herbivorous cichlids in Lake Tanganyika from a Bayesian mixing model withδ13C andδ15N of each cichlid species as mixture data, those of periphyton within their territories and those of other benthic animals as source data
cichlid species periphyton within each territory detritus Atyidae/Ephemeroptera Trichoptera Chironomidae
Eretmodus cyanostictus 43.5 ± 20.7 24.2 ± 17.8 8.2 ± 10.1 7.5 ± 9.2 16.6 ± 13.7
Telmatochromis temporalis 14.6 ± 12.1 25.2 ± 16.9 31.3 ± 17.0 14.1 ± 11.7 14.8 ± 11.0
Variabilichromis moorii 22.0 ± 15.1 21.2 ± 16.5 20.7 ± 15.5 15.8 ± 13.2 20.2 ± 14.9
Pseudosimochromis curvifrons 44.0 ± 16.7 25.1 ± 17.2 10.8 ± 9.8 7.7 ± 7.7 12.5 ± 11.8
Petrochromis macrognathus 34.3 ± 15.2 26.6 ± 18.5 11.9 ± 10.4 9.2 ± 9.1 18.0 ± 14.1
Petrochromis polyodon 46.6 ± 21.9 22.2 ± 16.4 8.3 ± 10.5 7.3 ± 10.2 15.7 ± 13.7
Petrochromis horii 23.3 ± 15.0 28.9 ± 17.7 21.0 ± 15.3 14.6 ± 12.5 12.2 ± 11.6
Petrochromis trewavasae 29.5 ± 18.0 22.4 ± 16.9 16.5 ± 13.4 11.7 ± 11.6 20.0 ± 15.9
Tropheus moorii 33.0 ± 19.6 21.2 ± 16.4 15.0 ± 13.9 11.6 ± 12.1 19.2 ± 15.8
Analyses were conducted by MixSIAR.δ13 C andδ15
correlation was shown between δ13C of periphyton and the depth those samples were collected (Figure 2, Table 6). This tendency is due partly to the fact that relative content ofδ13C of algae and cyanobacteria increases when growth rate/photosynthesis activity becomes higher, and when available aqueous CO2decreases [39]. These herbivorous
cichlids segregate their habitat depth by species in a-few-meter scale (Figure 2, [5-7,16]), and differences in habi-tat depth cause differences inδ13C of periphyton within cichlid territories.
δ13
C values in muscles of territorial cichlids were also significantly affected by δ13C value of the periphyton
within their territories, irrespective of ecomorph, al-thoughδ15N of muscles was not related to that of per-iphyton (Figure 3, Table 7). This correlation in δ13C suggests that these herbivorous cichlids depend on the primary production of the periphyton within their ter-ritories, especially for their carbon sources.
Difference in δ15N implies the difference in intake of animal matters. δ15N of Pseudosimochromis curvifrons,
Simochromis diagramma,Tropheus moorii, and Telmato-chromis vittatuswere significantly smaller than that ofL. dardennii (Table 4), δ15N of Petrochromis trewavasae
and P. polydon were higher than that of I. loocki. L.
dardenniiingest detritus in addition to algae and cyanobac-teria [10], and detritus appears to enrichδ15N in this cichlid by its higherδ15N value compared to periphyton (Figure 1). It should also be noted that Yamaoka et al. [40] suggests thatI. loockiis a strict herbivore.
Differences in C and N stable isotope ratios between fish muscles and periphyton within their defending algal farms
Fractions inδ15N between cichlid muscles and their algal farms were 5.9 ± 0.7‰(average ± SD,n= 10 species) and were large differentials comparing to 3.4‰, which is the most cited value as a diet-tissue discrimination factor [41-44]. The results of our Bayesian mixed-model show that territorial herbivorous species depend mostly on per-iphyton and detritus within territories, both occupying 51.9–69.1% in total, except forT. temporalisandV. moorii
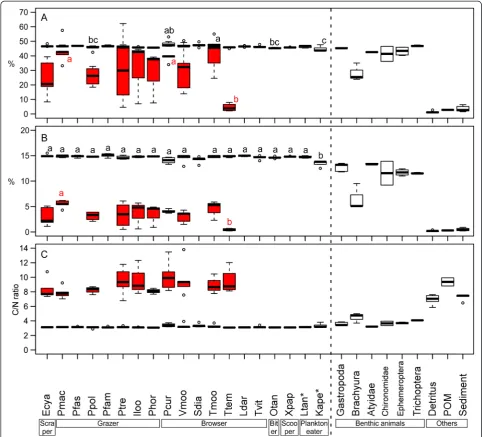
that utilize more benthic animals (Table 8).δ15N of these cichlids were significantly higher, and δ13C were signifi-cantly smaller than those of other territorial and herbivor-ous cichlids (Additional file 1: Table S1). It is known, however, that the trophic-step fractionation in herbivorous fishes varies and some have relatively higher values (e.g., 4.8 ± 1.3‰ in herbivorous fishes on coral reefs) partly because of higher excretion rates in such fishes [35]. Dependency on periphyton by these cichlids may thus be an underestimate. In our system, nitrogen con-tents of periphytons and detritus were low (3.4 ± 1.9%, 0.2 ± 0.1%, respectively, average ± SD) and their C/N ratios were much higher (9.0 ± 1.7, 6.9 ± 0.7, respectively) than those of cichlid fishes (3.2 ± 0.2, Figure 4). Therefore, these herbivorous cichlids appear to require other nitrogen sources with high nitrogen contents and low C/N ratios, such as benthic animals, to meet their nitrogen de-mand. These nitrogen supplies from animal matters may partly cause the enrichment ofδ15N in these herbiv-orous cichlids [45].
In this study, all samples for stable isotope analyses were collected a single time. It has been suggested that most primary producers have temporal variation in
δ15
N and δ13C because of the variation in their photo-synthesis rate and in the availability of nutrients [43,46], and high temporal shifts in δ13C and δ15N in pelagic phytoplankton is also indicated in Lake Tangan-yika [47]. δ13C and δ15N of herbivorous cichlids are time-integrated values reflecting their diet for a few months, and therefore, direct comparison of these values between cichlids and periphyton may have some shortcomings. This may cause the large gap in δ15N between herbivorous cichlids and periphyton within their territories. On the other hand, significant relation in δ13C between territorial cichlids and periphyton within their territories were observed. This indicate that the depth segregation among cichlids is stable as
partly shown in Takeuchi et al. [5], and variation in
δ13
C along depth is relatively high comparing to the temporal variation. Further time-series sampling and analyses of periphyton and cichlid fishes will reveal the detailed habitat segregation throughout years.
Effect of the depth segregation on cichlid diversification Specialization at a specific depth may enhance diversi-fication. In Lake Victoria, light environments are dif-ferent by depth and cichlid species have adapted and differentiated their vision. The adapted visions are as-sociated with the male nuptial colorations, and have led to speciation and diversification of species [48]. Further, repeated lake-level fluctuation is thought to drive diversification of Tanganyikan cichlid through the repetitive shrink and expansion of habitats [49]. One Tanganyikan cichlid, Telmatochromis temporalis, has diversified into two genetically-distinct ecomorphs: a large-bodied rock-living ecomorph, and a small-bodied shell-living ecomorph [50,51]. This diversification oc-curred repeatedly in places where rocky habitat and shell beds are adjacent. Therefore, a variant that mature in small size in original population in the rocky habitat is thought to have shifted to the shell bed when the shell bed became a suitable depth as a result of lake-level changes [51]. In this way, under stenotopic constraints for specific depths and substrata, each population undergoes local se-lection, and gene flow between populations living in differ-ent environmdiffer-ents can be restricted. Further, when habitats are separated, ancestral species may be diversi-fied into different environments and sufficiently spe-cialized not to mix with each other after their habitats are reunified and these populations re-encounter each other.
Conclusions
Additional file
Additional file 1: Table S1.Result of Tukey’s post-hoc test of multiple comparison between cichlid species of each ecomorph on carbon and stable isotope ratios of their muscles.Table S2.Result of Tukey’s post-hoc test of multiple comparison between cichlid species of each ecomorph on carbon and stable isotope ratios of periphytons within their territories.
Abbreviations
C:Carbon; DF: Degree of freedom; GLM: Generalized linear model; GLMM: Generalized linear mixed model; N: Nitrogen; NS: Not significant; POM: Particulate organic matter; SD: Standard deviation; SE: Standard error.
Competing interests
The authors declare that they have no competing interests.
Authors’contributions
HH, MK, MH participated in the design of the study. MH, MK arranged the permission and condition of field research. HH, HM conducted field research. JS, KO, HH carried out the stable isotope analysis. HH, JS analyzed data. HH wrote the manuscript with input from all authors. All authors read and approved the final manuscript.
Acknowledgements
We are grateful to three anonymous referees for improving the manuscript. We are also grateful to members of the Maneno Team (Tanganyika Research Project Team) and staff of LTRU, Mpulungu, Zambia, for their support. This study was supported by Grant-in-Aid for Young Scientists (B, nos 22770024, 25840159) for HH, Grant-in-Aid for Scientific Research (B, no. 22405010) for MK. The research presented here was conducted under permission of fish research in Lake Tanganyika from the Zambian Ministry of Agriculture, Food, and Fisheries and complied with the current law in Zambia.
Author details 1
Graduate School of Science and Engineering, Ehime University, 2-5 Bunkyo, Matsuyama, Ehime, Japan.2Center for Marine Environmental Studies (CMES), Ehime University, 2-5 Bunkyo, Matsuyama, Ehime, Japan.3Environmental Research and Management Center, Hiroshima University, 1-4-4 Kagamiyama, Higashi-Hiroshima, Hiroshima, Japan.4Graduate School of Science, Osaka City University, Sumiyoshi-ku, Osaka, Japan.5Kyoto University, Yoshida-Honmachi, Sakyo, Kyoto, Japan.
Received: 18 November 2014 Accepted: 15 April 2015
References
1. Salzburger W, Meyer A, Baric S, Verheyen E, Sturmbauer C. Phylogeny of the Lake Tanganyika cichlid species flock and its relationship to the Central and East African haplochromine cichlid fish faunas. Syst Biol. 2002;51:113–35. 2. Salzburger W, Mack T, Verheyen E, Meyer A. Out of Tanganyika: Genesis,
explosive speciation, key-innovations and phylogeography of the haplochromine cichlid fishes. BMC Evol Biol. 2005;5:17.
3. Danley PD, Husemann M, Ding B, Dipietro LM, Beverly EJ, Peppe DJ. The impact of the geologic history and paleoclimate on the diversification of East African cichlids. Int J Evol Biol. 2012;2012:574851.
4. Muschick M, Indermaur A, Salzburger W. Convergent evolution within an adaptive radiation of cichlid fishes. Curr Biol. 2012;22:2362–8.
5. Takeuchi Y, Ochi H, Kohda M, Sinyinza D, Hori M. A 20-year census of a rocky littoral fish community in Lake Tanganyika. Ecol Freshw Fish. 2010;19:239–48.
6. Hata H, Tanabe AS, Yamamoto S, Toju H, Kohda M, Hori M. Diet disparity among sympatric herbivorous cichlids in the same ecomorphs in Lake Tanganyika: amplicon pyrosequences on algal farms and stomach contents. BMC Biol. 2014;12:90.
7. Takamura K. Interspecific relationships of aufwuchs-eating fishes in Lake Tanganyika. Environ Biol Fishes. 1984;10:225–41.
8. Mbomba NB. Comparative morphology of the feeding apparatus in cichlidian algal feeders of Lake Tanganyika. Afr Stud Monogr. 1983;3:1–23.
9. Mbomba NB. Comparative feeding ecology of aufwuchs eating cichlid fishes in Lake Tanganyika with reference to their developmental changes. Physiol Ecol Japan. 1986;23:79–108.
10. Hori M, Gashagaza MM, Nshombo M, Kawanabe H. Littoral fish communities in Lake Tanganyika: irreplaceable diversity supported by intricate interactions among species. Conserv Biol. 1993;7:657–66.
11. Yamaoka K. Morphology and feeding behaviour of five species of genus Petrochromis(Teleostei, Cichlidae). Physiol Ecol Japan. 1982;19:57–75. 12. Yamaoka K. Comparative osteology of the jaw of algal-feeding cichlids
(Pisces, Teleostei) from Lake Tanganyika. Rep USA Mar Bio Inst Kochi Univ. 1987;9:87–137.
13. Brichard P. Pierre Brichard’s book of cichlids and all the other fishes of Lake Tanganyika. Neptune City, NJ: TFH Publications; 1989.
14. Yanagisawa Y. Parental care in a monogamous mouthbrooding cichlid Xenotilapia flavipinnisin Lake Tanganyika. Ichthyol Res. 1986;33:249–61. 15. Yamaoka K, Hori M, Kuratani S. Ecomorphology of feeding in“goby-like”
cichlid fishes in Lake Tanganyika. Physiol Ecol Japan. 1986;23:17–29. 16. Yamaoka K. Feeding behaviour and dental morphology of algae scraping
cichlids (Pisces: Teleostei) in Lake Tanganyika. Afr Stud Monogr. 1983;4:77–89. 17. Sturmbauer C, Mark W, Dallinger R. Ecophysiology of aufwuchs-eating cichlids in Lake Tanganyika: niche separation by trophic specialization. Environ Biol Fishes. 1992;35:283–90.
18. Wagner CE, McIntyre PB, Buels KS, Gilbert DM, Michel E. Diet predicts intestine length in Lake Tanganyika’s cichlid fishes. Funct Ecol. 2009;23:1122–31.
19. Kohda M. Coexistence of permanently territorial cichlids of the genus Petrochromisthrough male-mating attack. Environ Biol Fishes. 1998;52:231–42.
20. Kuwamura T. Overlapping territories ofPsedosimochromis curvifrons males and other herbivorous cichlid fishes in Lake Tanganyika. Ecol Res. 1992;7:43–53.
21. Hecky RE, Hesslein RH. Contributions of benthic algae to lake food webs as revealed by stable isotope analysis. J N Am Benthol Soc. 1995;14:631–53. 22. Doi H, Kikuchi E, Hino S, Itoh T, Takagi S, Shikano S. Seasonal dynamics
of carbon stable isotope ratios of particulate organic matter and benthic diatoms in strongly acidic Lake Katanuma. Aquat Microb Ecol. 2003;33:87–94.
23. Ishikawa N, Doi H, Finlay JC. Global meta-analysis for controlling factors on carbon stable isotope ratios of lotic periphyton. Oecologia. 2012;170:541–9. 24. Menzel D. Utilization of algae for growth by the angelfish,Holacanthus
bermudensis. ICES J Mar Sci. 1959;24:308–13.
25. Feller R, Taghon G, Gallagher E, Kenny G, Jumars P. Immunological methods for food web analysis in a soft-bottom benthic community. Mar Biol. 1979;54:61–74.
26. Michener R, Schell D. Stable isotope ratios as tracers in marine aquatic food webs. In: Lajtha K, Michener R, editors. Stable isotopes in ecology and environmental science. Oxford: Blackwell; 1994. p. 138–57.
27. Kohda M. Intra- and interspecific territoriality of a temperate damselfish Eupomacentrus altus, (Teleostei: Pomacentridae). Physiol Ecol Japan. 1984;21:35–52.
28. Cabana G, Rasmussen JB. Modelling food chain structure and contaminant bioaccumulation using stable nitrogen isotopes. Nature. 1994;372:255–7. 29. France RL. Differentiation between littoral and pelagic food webs in lakes
using stable carbon isotopes. Limnol Oceanogr. 1995;40:1310–3. 30. Bligh EG, Dyer WJ. A rapid method of total lipid extraction and purification.
Can J Biochem Physiol. 1959;37:911–7.
31. R Development Core Team: R: a language and environment for statistical computing. In.Vienna, Austria: R Foundation for Statistical Computing; 2013 32. Moore JW, Semmens BX. Incorporating uncertainty and prior information
into stable isotope mixing models. Ecol Lett. 2008;11:470–80. 33. Stock BC, Semmens BX:MixSIAR GUI User Manual, version 1.0.
[http://conserver.iugo-cafe.org/user/brice.semmens/MixSIAR] 34. Harvey CJ, Hanson PC, Essington TE, Brown PB, Kitchell JF. Using
bioenergetics models to predict stable isotope ratios in fishes. Can J Fish Aquat Sci. 2002;59:115–24.
35. Mill AC, Pinnegar JK, Polunin NVC. Explaining isotope trophic-step fractionation: why herbivorous fish are different. Funct Ecol. 2007;21:1137–45.
37. Takamura K. Interspecific relationship between two aufwuchs eaters Petrochromis polyodonandTropheus moorei(Pisces: Cichlidae) of Lake Tanganyika, with a discussion on the evolution and functions of a symbiotic relationship. Physiol Ecol Japan. 1983;20:59–69.
38. Hori M. Structure of littoral fish communities organized by their feeding activities. In: Kawanabe H, Hori M, Nagoshi M, editors. Fish Communities in Lake Tanganyika. Kyoto, Japan: Kyoto University Press; 1997. p. 275–98. 39. Goericke R, Montoya JP, Fry B. Physiology of isotopic fractionation in algae
and cyanobacteria. In: Lajtha K, Michener RH, editors. Stable Isotopes in Ecology and Environmental Science. Oxford: Blackwell Scientific Publications; 1994.
40. Yamaoka K, Hori M, Kuwamura T.Interochromis, a new genus of the Tanganyikan cichlid fish. S Afr J Sci. 1998;94:381–6.
41. Minagawa M, Wada E. Stepwise enrichment of15N along food chains: Further evidence and the relation betweenδ15N and animal age.
Geochim Cosmochim Acta. 1984;48:1135–40.
42. Vander Zanden MJ, Rasmussen JB. Variation inδ15N andδ13C trophic
fractionation: Implications for aquatic food web studies. Limnol Oceanogr. 2001;46:2061–6.
43. Post DM. Using stable isotopes to estimate trophic position: models, methods, and assumptions. Ecology. 2002;83:703–18.
44. McCutchan JH, Lewis WM, Kendall C, McGrath CC. Variation in trophic shift for stable isotope ratios of carbon, nitrogen, and sulfur. Oikos. 2003;102:378–90. 45. Hata H, Umezawa Y. Food habits of the farmer damselfishStegastes
nigricansinferred by stomach content, stable isotope, and fatty acid composition analyses. Ecol Res. 2011;26:809–18.
46. Cabana G, Rasmussen JB. Comparison of aquatic food chains using nitrogen isotopes. Proc Natl Acad Sci USA. 1996;93:10844–7.
47. O’Reilly CM, Hecky RE, Cohen AS, Plisnier P-D. Interpreting stable isotopes in food webs: Recognizing the role of time averaging at different trophic levels. Limnol Oceanogr. 2002;47:306–9.
48. Seehausen O, Terai Y, Magalhaes IS, Carleton KL, Mrosso HDJ, Miyagi R, et al. Speciation through sensory drive in cichlid fish. Nature. 2008;455:620–6. 49. Sturmbauer C, Baric S, Salzburger W, Rüber L, Verheyen E. Lake level
fluctuations synchronize genetic divergences of cichlid fishes in African lakes. Mol Biol Evol. 2001;18:144–54.
50. Takahashi T, Watanabe K, Munehara H, Ruber L, Hori M. Evidence for divergent natural selection of a Lake Tanganyika cichlid inferred from repeated radiations in body size. Mol Ecol. 2009;18:3110–9.
51. Winkelmann K, Genner MJ, Takahashi T, Rüber L. Competition-driven speciation in cichlid fish. Nat Commun. 2014;5:3412.
52. Trewavas E. Tilapiine fishes of the generaSarotherodon,Oreochromisand Danakilia. London: British Museum (Natural History); 1983.
53. Morley J, Balshine S. Faithful fish: territory and mate defence favour monogamy in an African cichlid fish. Behav Ecol Sociobiol. 2002;52:326–31. 54. Morley J, Balshine S. Reproductive biology ofEretmodus cyanostictus, a
cichlid fish from Lake Tanganyika. Environ Biol Fishes. 2003;66:169–79. 55. Poll M. Poissons Cichlidae, vol. III (5B). Brussels, Belgium: Institut Royal des
Sciences Naturelles de Belgique; 1956.
56. Ochi H, Yanagisawa Y. Commensalism between cichlid fishes through differential tolerance of guarding parents toward intruders. J Fish Biol. 1998;52:985–96.
57. Karino K. Depth-related differences in territory size and defense in the herbivorous cichlid,Neolamprologus moorii, in Lake Tanganyika. Ichthyol Res. 1998;45:89–94. 58. Ochi H, Takeyama T, Yanagisawa Y. Increased energy investment in testes following territory acquisition in a maternal mouthbrooding cichlid. Ichthyol Res. 2009;56:227–31.
59. Kohda M, Takemon Y. Group foraging by the herbivorous cichlid fish, Petrochromis fasciolatus, in Lake Tanganyika. Ichthyol Res. 1996;43:55–63. 60. Yamaoka K. A revision of the cichlid fish genusPetrochromisfrom Lake
Tanganyika, with description of a new species. JPN J Ichthyol. 1983;30:129–41. 61. Takahashi T, Koblmüller S. A new species ofPetrochromis(Perciformes:
Cichlidae) from Lake Tanganyika. Ichthyol Res. 2014;61:252–64. 62. Yanagisawa Y, Nishida M. The social and mating system of the maternal
mouthbrooderTropheus moorii(Cichlidae) in Lake Tanganyika. JPN J Ichthyol. 1991;38:271–82.
63. Coulter GW. Pelagic fish. In: Coulter GW, editor. Lake Tanganyika and Its Life. London: Oxford University Press; 1991. p. 111–38.
Submit your next manuscript to BioMed Central and take full advantage of:
• Convenient online submission
• Thorough peer review
• No space constraints or color figure charges
• Immediate publication on acceptance
• Inclusion in PubMed, CAS, Scopus and Google Scholar
• Research which is freely available for redistribution