O R I G I N A L A R T I C L E
Trophic and environmental drivers of the Sechura Bay Ecosystem
(Peru) over an ENSO cycle
Marc H. TaylorÆ Matthias WolffÆFlora VadasÆ Carmen Yamashiro
Received: 20 July 2007 / Revised: 2 October 2007 / Accepted: 5 November 2007 / Published online: 30 November 2007
ÓSpringer-Verlag and AWI 2007
Abstract Interannual environmental variability in Peru is dominated by the El Nin˜o Southern Oscillation (ENSO). The most dramatic changes are associated with the warm El Nin˜o (EN) phase (opposite the cold La Nin˜a phase), which disrupts the normal coastal upwelling and affects the dynamics of many coastal marine and terrestrial resources. This study presents a trophic model for Sechura Bay, located at the northern extension of the Peruvian upwelling system, where ENSO-induced environmental variability is most extreme. Using an initial steady-state model for the year 1996, we explore the dynamics of the ecosystem through the year 2003 (including the strong EN of 1997/98 and the weaker EN of 2002/03). Based on support from literature, we force biomass of several non-trophically-mediated ‘drivers’ (e.g. Scallops, Benthic detritivores, Octopus, and Littoral fish) to observe whether the fit between historical and simulated changes (by the trophic model) is improved. The results indicate that the Sechura Bay Ecosystem is a relatively inefficient system from a community energetics point of view, likely due to the periodic perturbations of ENSO. A combination of high system productivity and low trophic level target species of invertebrates (i.e. scallops) and fish (i.e. anchoveta) results in high catches and an efficient fishery. The importance of
environmental drivers is suggested, given the relatively small improvements in the fit of the simulation with the addition of trophic drivers on remaining functional groups’ dynamics. An additional multivariate regression model is presented for the scallop Argopecten purpuratus, which demonstrates a significant correlation between both spawning stock size and riverine discharge-mediated mortality on catch levels. These results are discussed in the context of the appropriateness of trophodynamic modeling in relatively open systems, and how management strategies may be focused given the highly environmentally influ-enced marine resources of the region.
Keywords El Nin˜oScallop fisheries Trophic relationships Trophodynamic model Humboldt CurrentPeru
Introduction
Sechura Bay (5.6°S, 80.9°W) (Fig.1) is located in northern Peru and is considered within the zone of transition between cold water transported from the south by the Humboldt Current and warm water of the tropical equa-torial region. Under normal upwelling conditions, this transition is found north of the bay; however, during the warm phase of the El Nin˜o Southern Oscillation (ENSO), El Nin˜o (EN), this transition zone is shifted southward by reflected Kelvin waves upon arrival to the coast. The bay is relatively shallow with depths of less than 30 m extending to 10 km from the shore.
Under upwelling conditions, the bay shows high primary productivity due to high nutrient availability and relatively warm water conditions when compared to higher latitudes (average temperature ca. 20°C). This productivity supports Communicated by S. Thatje.
M. H. Taylor (&)M. WolffF. Vadas Center for Tropical Marine Ecology, Fahrenheitstrasse 6,
28359 Bremen, Germany e-mail: marchtaylor@yahoo.com
C. Yamashiro
Instituto del Mar del Peru´, Esq. Gamarra y Gral. Valle s/n, La Punta, Callao, Peru
a large artisanal fishery in the bay of ca. 4,300 registered fishers and 970 boats (DIREPRO 2006). Additionally, migrant fisher communities may also come to the bay during non-EN periods to take advantage of the abundant fish and invertebrate resources. One example is that of the scallop Argopecten purpuratus, which maintains large populations in the bay and is a main target species due to a profitable export market. As a result, the state of Piura accounts for about 30% of total Peruvian landings of A. purpuratus(Ministry of Fisheries 2004).
Due to the bay’s position near the transition zone of the Humboldt Current Large Marine Ecosystem, even EN events of smaller magnitude such as in 1991/92 and 2002/03, which may not be felt at higher latitudes, can be observed in Sechura Bay through higher sea surface temperature (SST). Extreme EN events, such as those occurred in 1997/98, resulted in much higher SST as well as increased rainfall and subsequent river discharge into the bay (Fig.2). This envi-ronmental variability associated with ENSO is likely to play an important role in the dynamics of the ecosystem.
The objective of this study is to explore the importance of trophic and environmental drivers of dynamics to his-torical changes in Sechura Bay (1996–2003) through the use of a trophic flow model and dynamic simulations. Specifically, we force both fishing effort and the production of several functional group ‘drivers’, whose dynamics are
well cited in the literature as being non-trophically medi-ated, in order to measure their relative importance in the dynamics of the remaining functional groups of the model. An additional exploration of the influence of environmental factors on the economically important populations of A. purpuratus is also presented.
Materials and methods
Trophic model description
A mass-balance modeling approach was applied using the software Ecopath with Ecosim 5.0 (EwE) (Christensen and Pauly1992; Walters et al.1997), which allows quantifying and balancing trophic flows among components (functional groups) of an ecosystem and also permits exploration of ecosystem dynamics under different scenarios of use or environmental change (http://www.ecopath.org). The Ecopath model links the production of each group with the consumption of all those groups trophically connected: Pi¼YiþBiM2iþEiþBAiþPi ð1EEiÞ
where Pi is the total production rate of (i), Yi is the total
fishery catch rate of (i),M2i is the total predation rate for
group (i),Bithe biomass of the group,Eithe net migration
rate (emigration–immigration), BAi is the biomass
accumulation rate for (i), while M0i=Pi(1-EEi) is the
‘other mortality’ rate for (i) (Christensen et al. 2000). In order to ensure mass balance between the groups, a second master equation is used:
Consumption = Production + Respiration + Unassimilated food
A steady-state model of Sechura Bay was constructed based on the year 1996 and includes the area south of
Fig. 1 Map of Sechura Bay. Macrobenthic fauna sampling stations from September 1996 are indicated bygray circles(n= 71). The area considered in the trophic model is from the mouth of the River Piura southward and extending offshore to the 30 m depth isocline (indicated by the dashed line). Main cities (diamonds) and ports
(triangles) are shown
the Piura River of \30 m depth (total area of ca. 400 km2) (Fig.1), which incorporates the main area of the artisanal fishery (Gonzales and Ye´pez 2007). The model contained 21 functional groups including Detritus, two producer groups (Phytoplankton and Macroalgae), Zooplankton, six benthic primary consumer groups (Polychaetes, Scallops, Sea urchins, Herbivorous gastropods, Benthic detritivores, and Miscellaneous filter feeders), five benthic carnivore groups (Predatory gastropods,Small carnivores,Predatory crabs,Sea stars, and Octopods), three fish groups (Littoral fish, Small pelagic fish, and Pelagic predatory fish), Cephalopods,
and two top-predator groups (Marine mammals and Sea birds). Functional groups were designated according to similar diets, predators, productivities, and individual body size (Table1).
Data sources
Input parameters are derived from various sources: local and regional estimates, empirical relationships, other models and assumed estimates (Table2). Final values are shown in Tables3and4.
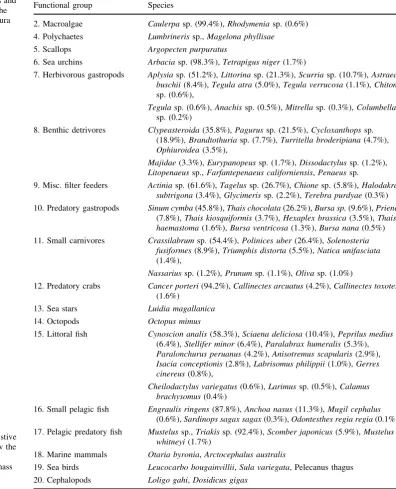
Table 1 Functional groups and representative species for the steady-state model of Sechura Bay in 1996
Species listed are not exhaustive (small benthos groups show the most important species, representing[95% of biomass and/or species averaging [1 g m2)
Functional group Species
2. Macroalgae Caulerpasp. (99.4%),Rhodymeniasp. (0.6%) 4. Polychaetes Lumbrinerissp.,Magelona phyllisae
5. Scallops Argopecten purpuratus
6. Sea urchins Arbaciasp. (98.3%),Tetrapigus niger(1.7%)
7. Herbivorous gastropods Aplysiasp. (51.2%),Littorinasp. (21.3%),Scurriasp. (10.7%),Astraea
buschii(8.4%),Tegula atra(5.0%),Tegula verrucosa(1.1%),Chiton
sp. (0.6%),
Tegulasp. (0.6%),Anachissp. (0.5%),Mitrellasp. (0.3%),Columbella
sp. (0.2%)
8. Benthic detrivores Clypeasteroida(35.8%),Pagurussp. (21.5%),Cycloxanthopssp. (18.9%),Brandtothuriasp. (7.7%),Turritella broderipiana(4.7%),
Ophiuroidea(3.5%),
Majidae(3.3%),Eurypanopeussp. (1.7%),Dissodactylussp. (1.2%),
Litopenaeussp.,Farfantepenaeus californiensis,Penaeussp.
9. Misc. filter feeders Actiniasp. (61.6%),Tagelussp. (26.7%),Chionesp. (5.8%),Halodakra
subtrigona(3.4%),Glycimerissp. (2.2%),Terebra purdyae(0.3%)
10. Predatory gastropods Sinum cymba(45.8%),Thais chocolata(26.2%),Bursa sp.(9.6%),Priene
(7.8%),Thais kiosquiformis(3.7%),Hexaplex brassica(3.5%),Thais
haemastoma(1.6%),Bursa ventricosa(1.3%),Bursa nana(0.5%)
11. Small carnivores Crassilabrumsp. (54.4%),Polinices uber(26.4%),Solenosteria
fusiformes(8.9%),Triumphis distorta(5.5%),Natica unifasciata
(1.4%),
Nassariussp. (1.2%),Prunumsp. (1.1%),Olivasp. (1.0%)
12. Predatory crabs Cancer porteri(94.2%),Callinectes arcuatus(4.2%),Callinectes toxotes
(1.6%)
13. Sea stars Luidia magallanica
14. Octopods Octopus mimus
15. Littoral fish Cynoscion analis(58.3%),Sciaena deliciosa(10.4%),Peprilus medius
(6.4%),Stellifer minor(6.4%),Paralabrax humeralis(5.3%),
Paralonchurus peruanus(4.2%),Anisotremus scapularis(2.9%),
Isacia conceptionis(2.8%),Labrisomus philippii(1.0%),Gerres
cinereus(0.8%),
Cheilodactylus variegatus(0.6%),Larimussp. (0.5%),Calamus
brachysomus(0.4%)
16. Small pelagic fish Engraulis ringens(87.8%),Anchoa nasus(11.3%),Mugil cephalus
(0.6%),Sardinops sagax sagax(0.3%),Odontesthes regia regia(0.1%) 17. Pelagic predatory fish Mustelussp.,Triakissp. (92.4%),Scomber japonicus(5.9%),Mustelus
whitneyi(1.7%)
18. Marine mammals Otaria byronia,Arctocephalus australis
Table 2 Sources of input data for the steady-state model of Sechura Bay in 1996 Functional group/ parameter Bi (t km -2 ) Pi / Bi (year -1 ) Qi / Bi (year -1 )G Ei EE i
Yi (t
Biomass Benthic macrofauna biomass was obtained from a survey conducted by IMARPE in September 1996. Epifauna and infauna of the upper sediment layer (approx. \5 cm depth) were collected from 71 quadrants of 1 m2 each, and abundance and weight were recorded for each species (for further information on sampling, see Samame´ et al. 1985; Yamashiro et al. 1990) (Fig.1). Groups of small epifauna (Herbivorous gastropods, Benthic detriti-vores, Scallops, Small carnivores) and Polychaetes were increased by 25% to correct for undersampling. Miscel-laneous filter feeders (consisting mainly of infaunal bivalves) were increased by 100% to also correct for undersampling, as much of this group’s biomass is found deeper than 5 cm.
Estimates of Phytoplankton biomass were based on SeaWifs (Feldman and McClain 2007) remote sensing estimates of sea surface chlorophyll a (chl a) concentra-tions (mg m-3) for the immediate region (4.9–6.6°S, 80.2– 81.7°W) from December 1997 to April 2007, excluding EN values. Conversion factors used for chl a to wet weight were as follows: chl a:Carbon (40:1) (Brush et al. 2002), and Carbon:wet weight (14.25:1) (Brown et al. 1991). Finally, sea surface biomass was multiplied by a mean depth of 15 m, assuming a well-mixed water column, to arrive at units on a per m2basis.
Information on the Zooplankton in Sechura Bay is limited, and thus we used average values from IMARPE cruise samplings between 1995 and 1999, excluding EN values, for the immediate region (5°–6°S,\82°W;n= 60). Biomass of highly mobile species such as octopus, cephalopods, and fish species were estimated from catch data by assuming that the fishery takes 50% of yearly produced biomass (Table3).
Catches Estimates of catch were derived from IMARPE catch statistics for the artisanal fishery from the two main landing sites for Sechura Bay—Parachique and Puerto Rico (Fig.1). Catches were summed according to species’ functional groups (Fig.3) for use in the steady-state model and for the measuring of performance of the simulations
(seeSimulations of temporal dynamics).
Production/biomass (total mortality) Direct estimates of production to biomass ratios (P/B) or Total mortality (Z) existed for several benthic invertebrate groups in the model—Scallops, Predatory crabs, and Sea stars. Other groups were estimated using empirical relationships from Brey (2001) taking into account taxonomic group, mean body size, temperature of habitat, feeding modes, and habitat type. In most cases this provided realistic estimates; however, values for Polychates and Misc. filter-feeders were increased to 1.0 based on other estimates from the literature (Table3).
Table 2 continued Functional group/ parameter Bi (t km -2) Pi / Bi (year -1) Qi / Bi (year -1)G Ei EE i
Yi (t
TheP/Bof Phytoplankton was estimated using a mod-ified Eppley curve (Eppley 1972) as described by Brush et al. (2002):
G¼Gmaxf LTLIMNUTLIM
whereG= realized daily growth rate (day-1)(base e),f is the fraction of the day during which there is light, and LTLIM and NUTLIM are dimensionless ratios from 0 to 1 which describe light and nutrient limitation of growth, respectively (Kremer and Nixon 1977). Gmax, as demon-strated by Eppley (1972) describes an exponentially shaped envelope for growth rates of phytoplankton under culture conditions without light or nutrient limitation (as recalculated by Brush et al.2002):
Gmax ¼ 0:97 e0:0633T
Where T= water temperature (°C). The ‘normal’ upwell-ing phytoplankton production of 1996 assumed a mean temperature of 20°C with 50% light (from self-shading) and 0% nutrient limitation factors. P/B values for other groups are taken from the literature (Table2)
Consumption (Q)/conversion efficiency (GE) Direct esti-mates of consumption rates (Q/B) were available for a few of the benthic invertebrate groups, (Octopods, Scallops, Predatory gastropods, and Predatory crabs). For most other groups, ratios of Conversion efficiency (GE) or the ratio between Production and Consumption (P/Q) were applied (Tables 2,3).
Diet matrices Direct diet studies for Sechura Bay are limited, and thus general knowledge from literature was
Table 3 Input–output parameters for the steady-state model of Sechura Bay in 1996 after application of the Ecoranger resampling routine
Functional group/parameter
Trophic level
Bi
(t km-2)
Pi/Bi
(year-1)
Qi/Bi
(year-1)
EEi GEi UAi/Qi P/R R/A Catch
(year-1)
Fi M0i M2i
1. Phytoplankton 1.00 21.335 343.886 – 0.685 – – – – – – 108.454 235.432
2. Macroalgae 1.00 284.607 16.092 – 0.042 – – – – – – 15.412 0.680
3. Zooplankton 2.18 27.874 40.059 157.883 0.780 0.254 0.20 0.464 0.683 – – 8.813 31.246
4. Polychates 2.06 45.897 1.091 4.474 0.825 0.244 0.20 0.438 0.695 – – 0.191 0.900 5. Scallops 2.00 23.689 1.364 10.556 0.884 0.129 0.20 0.193 0.838 2.340 0.099 0.158 1.108 6. Sea urchins 2.11 22.798 0.597 2.786 0.666 0.214 0.20 0.366 0.732 – – 0.199 0.398 7. Herbivorous
gastropods
2.00 25.258 1.235 4.116 0.665 0.300 0.20 0.600 0.625 – – 0.414 0.821
8. Benthic detritivores
2.00 36.795 1.302 6.806 0.910 0.191 0.20 0.314 0.761 0.144 0.004 0.117 1.181
9. Misc. filter feeders
2.24 22.064 1.094 5.044 0.736 0.217 0.20 0.372 0.729 0.001 – 0.289 0.805
10. Predatory gastropods
3.07 37.297 1.511 3.881 0.747 0.389 0.20 0.948 0.513 0.379 0.010 0.383 1.118
11. Small carnivores
2.87 14.669 0.537 2.677 0.673 0.201 0.20 0.335 0.749 0.001 – 0.176 0.361
12. Predatory crabs
3.20 7.379 2.002 8.703 0.684 0.230 0.20 0.404 0.712 – – 0.633 1.369
13. Sea stars 3.15 1.033 0.731 3.670 0.741 0.199 0.20 0.332 0.751 – – 0.189 0.542 14. Octopods 3.74 0.015 4.911 12.799 0.899 0.384 0.20 0.922 0.520 0.033 2.247 0.496 2.168
15. Littoral fish 2.81 2.613 1.195 14.300 0.694 0.084 0.20 0.117 0.896 1.795 0.687 0.366 0.142 16. Small pelagic
fish
2.12 82.134 1.727 18.706 0.639 0.092 0.35 0.166 0.858 81.409 0.991 0.623 0.113
17. Pelagic predatory fish
3.15 1.161 0.869 8.123 0.464 0.107 0.30 0.181 0.847 0.425 0.367 0.466 0.037
18. Marine mammals
3.34 0.019 0.103 46.179 0.000 0.002 0.20 0.003 0.997 – – 0.103 0.000
19. Sea birds 3.19 0.020 0.037 60.156 0.000 0.001 0.26 0.001 0.999 – – 0.037 0.000 20. Cephalopods 3.14 0.371 4.249 11.125 0.522 0.382 0.20 0.477 1.001 0.822 2.218 2.031 0.000
21. Detritus 1.00 – – – 0.105 – – – – – – 0.000 0.000
Bbiomass,Pi/Biproduction rate,Qi/Biconsumption rate,EEiecotrophic efficiency,GEiconversion efficiency,UAi/Qiunassimilated portion of
consumption,P/Rproduction/respiration ratio,R/Arespiration/assimilation ratio,Fifishing mortality,M0inon-predatory natural mortality,M2i
used in the construction of diet matrices (Table2). Macroinvertebrate predator groups are described to be rather unselective and opportunistic feeders, limited more by their modes of feeding (Wilson and Parkes 1998). Therefore, diet proportions were adjusted to reflect predatory groups’ consumption rates as well as the available production of prey groups. Specifically, the diets of carnivorous benthic invertebrate groups (Preda-tory gastropods, Small carnivores, Predatory crabs, Sea stars, and Octopods) assumed a base percentage of detritus feeding (10–20%), and then production of their prey was iteratively distributed based on the consumption rates of the aforementioned benthic predators. Diets for fish species were obtained from FishBase (Froese and Pauly 2006) and were adjusted to the fish groups based on relative species contribution from recorded catches (Table4).
Addressing parameter uncertainty
The balanced steady-state model for 1996 was subjected to the resampling routine Ecoranger in order to assess the probability distributions of the input parameters. Using a Monte Carlo approach, the routine drew a set of random input variables from normal distributions for each basic parameter, and all resulting combinations that satisfied mass-balanced constraints were recorded. Originally we allowed the routine to use confidence intervals as derived from a pedigree of the data sources, where highest confi-dence is placed in locally derived data (Table 5). However, the initial results often gave parameter values outside of reasonable biological constraints (e.g. high conversion efficiencies, high cannibalism) and thus we decided to fix all confidence intervals at 20% variation as was simi-larly done by Arias-Gonza´lez et al. (1997). We allowed
Table 4 Diet matrix for the steady-state model of Sechura Bay in 1996 after application of the Ecoranger resampling routine
Prey\predator 3 4 5 6 7 8 9 10 11 12 13 14 15 16 17 18 19 20
1. Phytoplankton 0.764 0.327 0.788 0.701 0.901
2. Macroalgae 0.800 0.808 0.198 0.259
3. Zooplankton 0.149 0.052 0.197 0.000 0.502 0.099 0.483 0.300
4. Polychates 0.102 0.108 0.125 0.097 0.103 0.189
5. Scallops 0.098 0.105 0.085 0.106 0.109
6. Sea urchins 0.206 0.173
7. Herbivorous gastropods
0.083 0.073 0.079 0.090 0.092
8. Benthic detritivores
0.171 0.178 0.157 0.174 0.171 0.003
9. Misc. filter feeders
0.070 0.084 0.061 0.078 0.084
10. Predatory gastropods
0.235 0.140 0.153 0.168 0.001
11. Small carnivores
0.021 0.023 0.018 0.022 0.025 0.000
12. Predatory crabs
0.159 0.176 0.001
13. Sea stars 0.008 0.000
14. Octopods 0.175
15. Littoral fish 0.001 0.252 0.105
16. Small pelagic fish
0.001 0.517 0.699 0.895 0.700
17. Pelagic predatory fish
0.048
18. Marine mammals 19. Sea birds 20. Cephalopods
21. Detritus 0.087 0.622 0.212 0.097 0.192 0.802 0.101 0.215 0.206 0.196 0.099 0.043
resampling until 10,000 runs passed the selection criteria. The ‘best’ run was then chosen as that with the smallest sum of square residuals between the input parameters and the mean value of all successful runs (for more informa-tion, see Christensen et al.2000).
System statistics and indices
The Ecopath with Ecosim package allowed for the calcu-lation of several statistics of the steady-state model
concerning flow structure and community energetics. These allowed for the comparison of Sechura Bay to published models of other coastal systems.
General descriptive statistics include: (1) Total throughput (T)—measure of the total sum of flows within the system and indicates the ‘size’ or activity of the system; and (2) Contributions toTfrom different types of flows— Consumption, Export, Respiration and Flows to detritus.
Several indices of community energetics are presented that allow for the interpretation of system’s development according to Odum (1969). More developed systems are
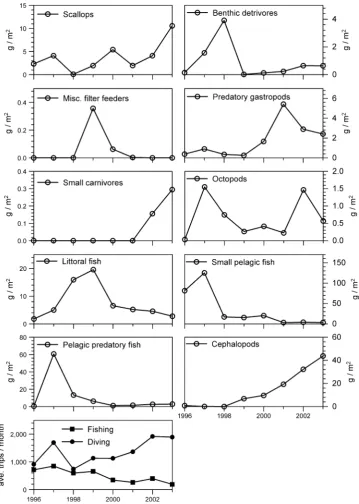
Fig. 3 Yearly captures from Sechura Bay by functional group as used for fitting the simulations from 1996 to 2003. Landings data provided by IMARPE were converted to the same unit values as the model (g m-2y-1) through division by the model area (400 km2).
Bottom graphshows yearly
average fishing effort for the two fleets,FishingandDiving
hypothesized to be highly efficient in terms of energy transfer to higher trophic levels and, thus, able to sustain a higher biomass in proportion to primary production. The following indices of community energetics are calculated: (1) Total primary production (PP) to Total respiration (R) ratio (PP/R); (2) Biomass (B) supported by Total primary production (PP/B); (3) Biomass supported by Total throughput (B/T), and (4) Energy Transfer efficiency (TE) between discrete trophic levels. Calculated ratios of pro-duction to respiration (P/R) and respiration to assimilation (R/A) were compared with independent estimates of similar taxa from the literature in order to gauge biological consistency.
Statistics concerning the fishery and its efficiency were also presented, including: (1) gross efficiency (catch/net PP); (2) mean trophic level of the catch; and (3) primary production needed to sustain the fishery.
Simulations of temporal dynamics
Using the ‘best’ steady-state model for 1996 as a starting point (as defined by the Ecoranger routine described ear-lier), we explored the temporal dynamics of the ecosystem
from 1996 to 2003 using the Ecosim routine of the EwE package. Following the forcing of the yearly fishing effort for the two fishing fleets, FishingandDiving, we applied several functional group ‘drivers’ to the model in order to measure their impact on the fit of the model. Drivers included the relative biomass changes of four trophically important and highly dynamic functional groups (Scallops, Benthic detritivores,Octopods, and Littoral fish) as calcu-lated from catch per unit effort (CPUE). These drivers are well cited in the literature as having significant environ-mental influences on their dynamics. Populations of the scallop A. purpuratus in Independence Bay have been shown to fluctuate more in response to temperature-medi-ated larval development time and subsequent mortality changes rather than from purely trophic changes (Wolff et al.2007; Taylor et al.2007d). Penaeid shrimp dynamics in the region have been correlated to shifts in carrying capacity as a result of variable SST and river discharge (Mendo and Tam 1993). As the catches of the Benthic detritivore group are dominated by shrimp, we have included this group as a non-trophic mediated driver. Octopus was included due to the observed temperature-mediated growth and reproduction for Octopus mimus (Cortez et al. 1999), helping explain the large booms of octopus during EN periods (Arntz et al.1988). Additionally, O. mimus embryonic development time has also been shown to be greatly accelerated under EN-like conditions in the laboratory (Warnke1999), which may also contribute to increased production rates. Finally, the immigration of subtropical fish species southward is linked to the intrusion of subtropical equatorial waters during EN (Arntz and Tarazona1990) contributing to theLittoral fishdynamics.
Drivers’ biomasses were then fixed through time in all possible sequences and combinations (n = 64). The per-formance of each simulation was measured against the time-series of observed relative biomass changes (CPUE) for the remaining unforced groups through the calculation of the sum of squares (SS):
SS¼XLogðBobs:Þ LogðBpred:Þ2
where Bobs. = observed biomass (g m-2), and Bpred.= predicted biomass (g m-2).
The simulation runs conducted for this study with EwE calculates biomass changes through time by solving the set of differential equations:
dBi=dt¼gi
X
k
QkiðtÞ
" #
X
j
QijðtÞ M0iBi
XFifðtÞBi
for species or functional groupsi= 1, . . .,n. The first sum represents the food-consumption rate, Q, summed over prey types k of species i, and gi represents the growth Table 5 Pedigree index values assigned to model parameters for the
steady-state model of Sechura Bay in 1996
Functional group B P/B Q/B Diet C
Phytoplankton 0 0.2
Macroalgae 1 0.6
Zooplankton 0 0.6 0.1 0
Polychates 1 0.5 0 0
Scallops 1 1 1 0.7 1
Sea urchins 1 0.5 0 0
Herbivorous gastropods 1 0.5 0 0
Benthic detrivores 1 0.5 0 0 1
Misc. filter feeders 1 0.5 0 0 1
Predatory gastropods 1 0.5 0 0 1
Small carnivores 1 0.5 0 0
Predatory crabs 1 1 1 1
Sea stars 1 0.5 0 0
Octopods 1 1 1 0.2 1
Littoral fish 0.4 0.1 0 0.2 1
Small pelagic fish 0 0.1 0 0.2 1
Pelagic predatory fish 0.4 0.1 0 0.2 1
Marine mammals 0 0.2 0.2 0.2
Sea birds 0 0.2 0.2 0.2
Cephalopods 0.4 1 0.6 0.5
Lower pedigree index values correspond to guesstimates or other models, whereas higher pedigree index values correspond to high precision estimates locally based. Pedigree = 0.462 (t* = 2.21)
efficiency (proportion of food intake converted into pro-duction). The second sum represents the predation loss rates over predatorsjofi.M0irepresents the instantaneous
natural mortality rate due to factors other than modeled predation. The final sum represents the instantaneous fishing mortality rate,F, as a sum of fishing components caused by fishing fleets f (for further information, see Walters and Martell2004).
Exploration of environmental drivers to scallop production
A multiple regression analysis was conducted to explore the influence of environmental factors on the dynamics of the economically important scallop (A. purpuratus) popu-lation in Sechura Bay. Using the methods employed by Wolff et al. (2007) for the scallop stocks in Independence Bay, Peru (16°S), the model attempts to forecast scallop catch as a function of the environmental conditions during the previous spawning period. Specifically, the dependent variable was defined as the scallop ‘catch’ (kg), versus the independent variables ‘spawning stock’ (kg) and the tem-perature-dependent ‘settlement factor’ (arbitrary units) for scallop recruitment. Settlement factor is based on a day-degree larval development time, whereby higher tempera-tures shorten the development time and consequently the pre-settlement mortality. In addition, we added the inde-pendent factor of ‘river discharge’ (m3s-1) as Sechura Bay experiences highly variable input of freshwater from the Piura River depending on rainfall associated with ENSO, which affects the salinity of the bay.
The variables were defined as follows:Catchis calculated as the average monthly catch from September to August. Spawning stockis calculated as the average catch during the 6-month main spawning season (January–June) preceding the catch. River discharge is the average river discharge recorded during the catch period (September–August). Set-tlement factoris calculated from the average temperature 6-month main spawning season (January–June).
Data-series and their sources: Monthly catches (IMA-RPE); Sea surface temperature (SST) collected in Sechura Bay (IMARPE); and Piura River discharge (Sanchez Cerro Bridge, Piura—Sistema de Alerta Temprana ‘SIAT’).
Assumptions of the model
1. Scallop landings reflect the size of the scallop stock in the bay. If the stock increases or decreases, the fishery grows or shrinks accordingly, so that the relative fishing rate remains relatively constant, and the catch is proportional to stock size.
2. Scallop landings during the post-recruitment period, which starts in late winter (August/September) each year largely depend on the recruits spawned during the preceding summer/autumn period [January–June, note: this period is slightly later than that of Independence Bay as determined by histological analysis of gametogenesis (IMARPE, Huayura´, personal commu-nication)], typical for annual ‘‘pulse fisheries’’. 3. Spawning stock is assumed proportional to scallop
landings during spawning (January–June).
4. Larval survival in the natural environment (from egg release to settlement) is significantly lower than the observed 0.1% in the hatchery (Wolff et al. 1991). 5. Day degrees (dd) for larval development including
successful settlement were considered to be approx. 400 for the temperature range 14–25°C, based on hatchery data by DiSalvo et al. (1984), Uriarte et al. (1996) and Wolff et al. (1991). During cold water conditions (14°C) larvae would need more than 28 days to settle, whereas only about 16 days are needed at the high EN temperatures of 25°C.
6. Piura River discharge is a good proxy for hydrological changes in Sechura Bay (e.g. change in salinity or sedimentation rate), which may impact the adult stock production.
Results
Trophic model
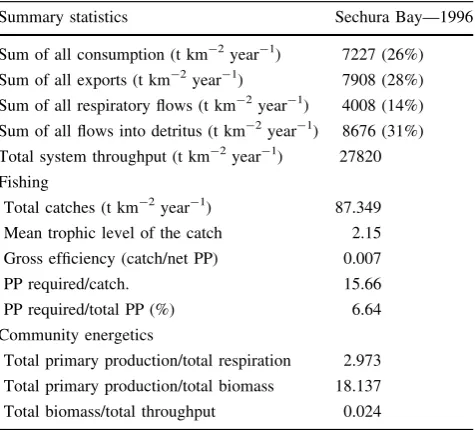
Initial parameters of the balanced model can be found on the Pangea website (Taylor et al. 2007a, b). Ecoranger resampling resulted in balanced models in 2.62% of the runs with the ‘best’ fitting model parameters shown in Table3. The analysis of trophic flows in Sechura Bay for 1996 indicated an intermediate level of consumption of phytoplankton production by higher trophic levels (EE = 0.69) and low recycling of detritus (EE = 0.10). This inefficiency explains the high proportions of Total throughput (T) (27820 t km-2year-1) allocated to Exports (28%) and Flows to detritus (31%). Inefficient transfer of energy to higher trophic levels is reflected by the mean transfer efficiency value of 6.6% (geometric mean of tro-phic levels II–IV). Furthermore, the relatively high PP/R ratio (2.97) indicated that the system may be considered developing and immature (Table 6).
most of their assimilated consumption. Nevertheless, the model estimates of respiration fell within acceptable ranges as described in the literature for taxonomic groups. P/R ratios of fish groups ranged between 0.117 and 0.181, which is slightly higher than the mean value of 0.11 pre-sented by Humphreys (1979). Benthic invertebrate P/R ratios had a wide range (0.193–0.948), but the average value of 0.475 is also very close to mean values of 0.482 and 0.439 for aquatic invertebrates as described by Humphreys (1979) and Schwinghamer et al. (1986), respectively. All but one (Scallops—0.838) of our R/A estimates for benthic invertebrates fell within the expected range of 0.5–0.75 given by Mann (1982). The averageR/A ratio was 0.693, which is similar to the average value of 0.7 given by Davis and Wilson (1985) for macroinvertebrates. The total fishery catches were high (87 t km-2year-1). Due to the targeting of low trophic level primary consumer species (e.g.Engraulis ringens, Anchoa nasus, and Argo-pecten subnodosus) the mean trophic level of the catch was close to 2.0 (2.15). As a result, the fishery had a high gross efficiency (catch/net PP; 0.01) and low PP required per unit of catch (15.66). Overall, the fishery required 6.6% of the total PP to sustain it (Table6).
Simulations
The initial application of fishing effort changes for the two fleets slightly improved the fit between the observed and the simulated catches (ca.-6.4% in SS), indicating some effect to overall dynamics. The application of the functional group drivers had little improvement on the fit of the simulation (-1.7 to 11.1% average change in SS for all drivers, Fig.4).
Scallop CPUE was the only driver that improved fit on average (-1.7% in SS, respectively), although the improvement was minimal. The impact of each individually applied driver on simulated dynamics can be seen in Fig.5.
Multiple regression
None of the independent variables were significant pre-dictors of catch when applied alone [Spawning stock (SS) P= 0.347; Settlement factor (SF) P= 0.215; River dis-charge (RD) P= 0.236]. When SS and SF were applied together, as done by Wolff et al. (2007) for Independence Bay, the regression was not significant (R2= 0.362; P= 0.509). The addition of the independent variable RD increased the fit dramatically (R2= 0.959; P= 0.060); however, a significant regression was achieved only from the combination of the independent variables SS and RD (without SF) (R2= 0.916; P = 0.024*). Predicted versus observed values of scallop catch can be seen in Fig.6
along with the statistics of the multiple regression. The relationship reveals that spawning stock size and river discharge influence catch levels positively and negatively, respectively.
Table 6 System statistics and flow indices for the steady-state model of Sechura Bay in 1996
Summary statistics Sechura Bay—1996
Sum of all consumption (t km-2year-1) 7227 (26%) Sum of all exports (t km-2year-1) 7908 (28%) Sum of all respiratory flows (t km-2year-1) 4008 (14%)
Sum of all flows into detritus (t km-2year-1) 8676 (31%) Total system throughput (t km-2year-1) 27820 Fishing
Total catches (t km-2year-1) 87.349 Mean trophic level of the catch 2.15 Gross efficiency (catch/net PP) 0.007
PP required/catch. 15.66
PP required/total PP (%) 6.64 Community energetics
Total primary production/total respiration 2.973 Total primary production/total biomass 18.137 Total biomass/total throughput 0.024
Discussion
General system configuration
Sechura Bay is located near the northernmost extension of the Peruvian coastal upwelling where, due to its proximity to the equator and resulting large Rossby radius, strong upwelling occurs even under relatively low wind-forcing
conditions. Estimates of chl a, as derived from remote sensing during non-EN years, showed relatively typical values of the coastal Peruvian upwelling system (3.00 mg chlam-3), and production rates under upwelling conditions are assumed to be at the higher end due to a higher mean sea surface temperature. For example, when compared to the southern extension of the main upwelling zone near Independence Bay (16°S), mean temperatures in
Fig. 5 Simulated versus observed (catch per unit effort) relative biomass changes. All simulations consider changes in fishing effort (fishing and diving). Simulation trajectories are shown for each of the four ‘drivers’ (Scallops,Benthic
detritivores,Octopods,Littoral
fish) as applied individually
Fig. 6 Predicted versus observed values of annual catches (kg; ave mo. catch Sep–Aug) for the scallop
Argopecten purpuratusas
calculated by the multiple regression analysis. Independent variables include: Spawning stock (SS) (kg; average monthly catch of previous Jan–June) and River discharge (RD) (m3s-1;
Sechura Bay are approximately 4°C higher (20°vs. 16°C), resulting in a 29% increase in phytoplankton production rates according to the modified Eppley curve presented by Brush et al. (2002). In part due to this high primary pro-duction, the Total throughput in Sechura Bay was estimated at 27820 t km-2year-1, which is of a similar magnitude to other coastal bays along the coast of South America (Tongoy Bay, Chile (20594), Ortiz and Wolff
2002; Independence Bay, Peru (34208), Taylor et al.
2007d).
Despite the advantages of a combined upwelling and higher mean SST for high primary production, the lower subtropical latitudes of the western coast of South America are subject to the highest interannual SST variability associated with ENSO (Lluch-Cota et al.2001; Montecinos et al.2003). This variability is caused by oscillations in the zone of transition between the cold waters of the Humboldt Current and the warm waters of the tropical equatorial region, and may act as a periodic perturbation to ‘‘reset’’ the system and prevent the development of a high trophic efficiency. Under the negative SST anomalies of 1996, the system is functioning as a typical upwelling region with exports and flows to detritus equaling 28 and 31%, respectively, due to inefficient consumption of primary production. While our estimate of Total throughput is not directly comparable to models that use differing units to describe flows (e.g. dry weight or carbon units), we are able to compare the proportions of types of flows. The propor-tion of flows to detritus in Sechura Bay is similar to those estimated for several US bay systems (Narragansett Bay (33%), Delaware Bay (30%), and Chesapeake Bay (27%) by Monaco and Ulanowicz 1997) and other bay systems along the coast of South America (Tongoy Bay (29%) by Ortiz and Wolff2002; Independence Bay (34%) by Taylor et al. 2007d). However, only the models of the South American bays calculated high proportions of exports as well (29–34% vs. 7–10% for US bays). Rybarczyk et al. (2003) found a similarly high proportion of export flows (26%) for Somme Bay, France, which they in part attribute to high exchange rates/low residency time of water in the system. Sechura Bay is in fact a very open bay and losses of primary production may occur; however, the benthic evaluations conducted in 1996 observed standing detrital material at about one-third of the sample locations, which may be evidence of primary production going unutilized and remaining in the sediments under strong upwelling conditions.
Indices of community energetics show a similar degree of development when compared to the bays of Indepen-dence and Tongoy (PP/R, PP/B, and T/B ratios); however, the mean transfer efficiency of trophic levels II–IV is lowest in Sechura Bay (6.6%) as compared to the other South American bay systems (9.6 and 11.4% for
Independence and Tongoy, respectively) probably due to the fact that perturbations frequently impact higher-level species to a greater extent than the lower trophic compo-nents (Baird et al.1991). This is likely due to the fact that higher trophic levels have lower production ratios and thus slower biomass recovery times. As transfer efficiency indicates the development of higher trophic connections, the latitudinal trend of increasing transfer efficiencies at higher latitudes may be related to decreasing ENSO-related variability and impact to the coast of the Humboldt Current ecosystem.
Role of fishing
The fishery is highly productive with catches equaling 87 t km-2year-1 for 1996. The catch is dominated by small pelagic fish; specifically, Peruvian anchoveta, Eng-raulis ringens (84.6% of total catch), and Longnose anchovy,Anchoa nasus(10.9% of total catch). Due to the low trophic level of these groups, the efficiency of the fishery is high, which is sustained by a smaller fraction of the total primary production (6.6%) when compared to average estimates of upwelling systems (25.1%) (Pauly and Christensen1995).
Sechura is one of the largest bays of the western South American coast, measuring 89 km from north to south with oxygenated bottom depths\30 m extending about 10 km offshore. Below 30 m benthic biomass drops off signifi-cantly due to decreased oxygen concentrations. For this reason, the diving fishery operates almost exclusively in shallow depths (\30 m). Despite such an expansive area for exploitation, the diving fishery in Sechura is a relatively recent development, spurred on in the early 1990s by a boom in the scallop fishery and by the introduction of diving techniques to the area of fishers from the south (i.e. hookah and air compressor systems). As a result, between 1994 and 1997 the diving fleet increased to include nearly 500 boats (Tafur et al. 2000). Nevertheless, the fishing mortality rates of the benthic target species are very low, even for the targeted scallops. For example, an exploitation ratio (F/Z) of 7% for scallops in Sechura Bay compares to 23–25% for Independence Bay (Taylor et al. 2007d). It is likely that both the young state of development of the diving fishery, and the higher associated costs of travel to the farther fishing grounds in the larger Sechura Bay, may limit to some extent the overall impact and help to explain the low fishing mortalities of the benthic resources (Table 3).
the low fishing mortality rates associated with the targets of the Diving fleet (i.e. benthic invertebrate groups), this improvement is mainly attributable to slightly better fits in the targets of theFishingfleet. In particular, the increases in relative biomass forLittoral fish,Pelagic predatory fish, and Cephalopods (Fig.5) are slightly improved through the introduction of decreasing fishing effort in theFishing fleet (Fig.3).
Despite this improvement, the impact of the artisanal fishery in Sechura appears small and in stark contrast to what has been observed for the Peruvian upwelling system overall with respect to the industrial fishery. Taylor et al.
(2007c) showed that the changes in industrial fishing rates
in the upwelling region (4°–16°S, 110 km extension from the coast) helped to explain 27.1% of the biomass and catch variability during the same time period of 1996– 2003. In contrast, the artisanal fishery seems to operate more in response to the fluctuating availability of resources and does not have the same problems of overcapacitation as has been shown for the industrial fishery (Fre´on2006).
Applicability of trophic modeling to the Sechura Bay Ecosystem
Through the modeling of trophic flows for Sechura Bay we have gained insight into the general system configuration during periods of normal upwelling (1996) and provide some of the first estimates of fishing mortality of the benthic resources, which appear to be very low. The application of Ecoranger has helped to add some weight to our input parameters due to the fact that locally derived estimates of production, consumption, and diet were scarce. Our assumptions regarding these values allowed for the initial balancing of the model, and confidence intervals of 20% give favorable results from the Ecoranger resam-pling routine whereby resulting energy budgets of functional groups are within acceptable ranges. Generally, highest respiration rates were found for the warm-blooded sea birds and marine mammals, and lower values for poi-kilotherms (fish and invertebrates), with less mobile benthic invertebrates having the lowest respiration ratios (R/A). Furthermore, within the invertebrate groups, lowest respiration rates are calculated for strongly carnivorous groups (predatory gastropods, octopods, and cephalopods). Higher assimilation efficiencies have been proposed for carnivorous organisms possibly due to the high nutrient value of their food (Welch1968); however, this tendency is not supported for aquatic mollusks (Huebner and Edwards
1981), and thus our decision to leave unassimilation ratios for all benthic invertebrates at the Ecopath default of 20% may be reasonable. The lowerR/Aratios calculated in the model are rather a result of higher conversion efficiencies
(‘‘gross efficiency’’, GE) (0.3–0.35) as is supported by Huebner and Edwards (1981) for carnivorous invertebrates as well as from local estimates of Octopus mimus(Wolff and Perez 1992; Vega and Mendo 2002) and the jumbo squid,Dosidicus gigas (Alegre et al.2005).
We hypothesized that the fit of the simulations would be improved through the forcing of functional group ‘drivers’ whose changes in biomass and production were known to be a result of non-trophic environmentally mediated interactions (i.e. Scallops, Benthic detritivores (shrimp), Octopus, andLittoral fish). Overall, these drivers help little in explaining the remaining functional groups’ dynamics. We propose three hypotheses for the poor performance of the dynamic simulation.
First, the Sechura Bay ecosystem is highly open to outside influences, and thus the scale of the model does not reproduce well the dynamics of functional groups whose life cycles are enclosed in a larger geographic area or whose distribution is linked to particular water masses. We have taken into account the southward migration of more tropical equatorial-associated fish species to Sechura Bay due to their possible impact on benthic resources; however, other groups also show important dynamics on a larger scale. Small pelagic fish catch dynamics in Sechura are mainly due to latitudinal migrations of the stocks in response to changing centers of upwelling and associated plankton variability. One example is the southward retreat of the Peruvian anchoveta during the strong EN of 1997/98 (Alheit and N˜ iquen 2004), which helps in explaining the decreased catches in Sechura. Cephalopod catches have increased following the EN of 1997/98 to become an important target of the artisanal fishery. This is due almost exclusively to large-scale increases in population growth and range expansion of the Jumbo squid,Dosidicus gigas. Evidence suggests that its large-scale expansion is a bot-tom-up response to increases in its principle prey— mesopelagic fish (e.g. Vinciguerria lucetia) (Taylor et al.
2007c). Mesopelagic fish themselves are not found much
applicability of trophodynamic models depends on a cer-tain degree of ‘‘closure’’ of trophic flows in order to be able to reproduce dynamics.
Secondly, other groups’ dynamics, besides the forced drivers, may also be highly influenced by environmental variability. It is possible that given the dramatic changes in temperature and salinity in Sechura Bay, other less mobile benthic invertebrate species may also be affected by ENSO-related variability. Respiration rates of poikilo-therms are sensitive to changes in temperature and thus, depending on the organism’s tolerances, conversion effi-ciencies may also be affected. Several ongoing studies regarding these influences are being conducted within the CENSOR (http://www.censor.name) project, which will aid future modeling efforts.
Finally, the data availability and quality may have affected the accuracy of some parameters and time series data sets. We have constructed our model for the base year of 1996 for several reasons: (1) availability of ben-thic biomass estimates; (2) it marks beginning of constant monitoring of catch and effort data by IMARPE; and (3) it precedes the strong EN event of 1997/98, which offers insight into system dynamics resulting from extreme environmental variability. Our catch and effort data comes from the two main ports in the bay (Puerto Rico and Parachique). Biomass estimates were available for benthic groups based on evaluations conducted by IMA-RPE in 1996, but fish and cephalopod biomasses were approximated by assuming that the fishery takes about 50% of these groups’ production. Such fishing rates are likely, given the operating capacity of the fishers, espe-cially regarding the fleets geared toward anchovy and other pelagic fish. Furthermore, the artisanal fleet has traditionally focused on fishing, and thus we have more confidence in relative biomass changes as calculated by CPUE. On the other hand, the diving activities are less intensive as well as relatively young in development. Although these activities have continued to grow since the mid-1990s, relative changes as calculated by CPUE for our time series may be less indicative of the actual resource dynamics. Future simulations will be able to take advantage of improved time series as derived from more regularly conducted benthic evaluations by IMARPE since 2000.
Importance of environmental variability and implications for management
Although Sechura Bay is a system relatively open to out-side influences, the dynamics of some principle resources may still be largely influenced by local variability. We have explored one such example with the scallop
A. purpuratus for which a simple two-factor multiple regression model is able to predict catches.
Scallop biomass has been shown to be enhanced in southern Peru and northern Chile during EN events (Wolff 1987; Stotz 2000). These events improve benthic oxygen concentrations through a lowering of the thermocline and also increased metabolic activity (res-piration, somatic growth) in response to the increased temperature. New findings suggest that reduced mortality in the larval stage, due to faster development to settle-ment times, may be mainly responsible for population booms during EN periods (Wolff et al. 2007). Our exploration of the environmental influences on the scal-lop stock in Sechura Bay suggests a greater importance of riverine inputs to the bay. The importance of both spawning stock (positive) and river discharge (negative) suggests some degree of self-recruitment with the addi-tional negative effect (i.e. mortality) of riverine discharge on the adult population.
It is likely that similar explorations for other resources may also show an importance of environmental vari-ability on resource dynamics in Sechura Bay. This information will have importance in the designation of management strategies in response to ENSO. Previously, artisanal fishers have operated in a highly mobile manner in response to changing resources (e.g. migration of fishers towards population increases of A. purpuratus in Independence Bay during EN periods); however, increasing regionalization may make this more difficult in the future.
Even if the responses of resources are successfully linked to environmental variability, the predictions of strong EN phenomena are presently only accurate for a few months to half a year, thus preventing longer-term strate-gies for fishers. Nevertheless, forecasts of even a few months could mean substantial benefits; in fact some Peruvian fishers and farmers have based their seeding or harvesting schedules (albeit erroneously at times) on the ENSO predictions of the NOAA website. As these pre-dictions improve, as well as the known responses of resource availabilities, we may see an increased impor-tance of ENSO forecasting to management strategies. For example, forecasting would allow culturists time for har-vest or relocation of scallops to other areas, and fishers could make gear changes or other adjustments in prepara-tion for switching to alternative resources.
Significant emphasis has been placed in recent years for developing an ecosystem-based approach to fisheries (for review, see Browman and Stergiou 2004). Trophic mod-eling tools, such as EwE, have no doubt shed new light on our understanding of ecosystem dynamics and continue to increase in importance for management. Additionally, the incorporation of environmental drivers on ecosystem dynamics is often needed to reproduce historical changes. This study confirms this, and furthermore indicates that systems which are both open to outside influences or bor-dering variable water masses may be less predictable from a trophic modeling perspective than that of more closed systems.
Acknowledgments The authors are grateful for the support and assistance from the following: Dr. Villy Christensen of the Fisheries Centre, University of British Columbia, for his helpful advice regarding the use of Ecoranger routine within Ecopath with Ecosim; Dr. Tom Brey of the Alfred Wegener Institute for Polar and Marine Research (AWI) for helpful discussions regarding benthic inverte-brate energetics and for the use of his somatic production models; Dr. Jorge Tam and David Correa of the Instituto del Mar del Pe´ru (IMARPE) for fruitful discussions and their help in retrieval of SeaWifs data; and three anonymous reviewers whose comments and suggestions greatly improved the earlier manuscript. This study was financed and conducted in the frame of the EU-project CENSOR (Climate variability and El Nin˜o Southern Oscillation: Impacts for natural coastal resources and management, contract No. 511071) and is CENSOR publication 269.
References
Alegre A, Blaskovic V, Castillo R, Espinoza P, Fernandez F, Flores R, Peraltilla S, Tafur R, Tam J, Taylor M, Yamashiro C (2005) Comportamiento alimentario del calamar gigante (Dosidicus
gigas), enfatizando la depredacion ejercida sobre le merluza
(Merluccius gayi peruanus). Instituto del Mar del Peru, Callao,
Peru, pp 36
Alheit J, N˜ iquen M (2004) Regime shifts in the Humboldt Current ecosystem. Prog Ocean 60:201–222
Argu¨elles J, Tafur R, Taipe A, Villegas P, Keyl F, Dominguez N, Salazar M (2007) Changes in the population structure of Jumbo flying squid Dosidicus gigasin Peruvian waters during 1989– 2004. Prog Ocean (in press)
Arias-Gonza´lez JE, Delesalle B, Salvat B, Galzin R (1997) Trophic functioning of the Tiahura reef sector, Moorea Island, French Polynesia. Coral Reefs 16:231–246
Arntz W, Tarazona J (1990) Effects of El Nin˜o on benthos, fish and fisheries off the South American Pacific coast. In: Glynn PW (ed) Global ecological consequences of the 1982–83 El Nin˜o-Southern Oscillation. Elsevier Oceanogr Ser, pp 323–360 Arntz WE, Valdivia E, Zeballos J (1988) Impact of El Nino 1982–83
on the commercially exploited invertebrates (mariscos) of the Peruvian shore. Meeresforschung/Rep Mar Res 32:3–22 Arone´s K, Ayo´n P, Hirche H-J, Schwamborn R (2007) Hydrographic
structure and zooplankton abundance and diversity off Paita, northern Peru (1994 to 2004)—ENSO effects, trends and changes. J Mar Syst (in press)
Baird D, McGlade JM, Ulanowicz RE (1991) The comparative ecology of six marine ecosystems. Philos Trans R Soc Lond B Biol Sci 333:15–29
Brey T (2001) Population dynamics in benthic invertebrates. http://www.awi-bremerhaven.de/Benthic/Ecosystem/FoodWeb/ Handbook/main.html
Browman HI, Stergiou KI (2004) Perspectives on ecosystem-based approaches to the management of marine resources. Mar Ecol Prog Ser 274:269–303
Brown PC, Painting SJ, Cochrane KL (1991) Estimates of phytoplankton and bacterial biomass production in the north-ern and southnorth-ern Benguela ecosystems. S Afr J Mar Sci 11:537–564
Brush MJ, Brawley JW, Nixon SW, Kremer JN (2002) Modeling phytoplankton production: problems with the Eppley curve and an empirical alternative. Mar Ecol Prog Ser 238:31–45 Cardoso F, Tarazona J, Paredes C (1998) Biological aspects of the
Patagonian squid Loligo gahi (Cephalopoda: Loliginidae) in Huarmey, Peru. Rev Peru Biol 5:9–14
Christensen V, Pauly D (1992) ECOPATH II—a software for balancing steady-state models and calculating network charac-teristics. Ecol Model 61:169–185
Christensen V, Walters CJ, Pauly D (2000) Ecopath with Ecosim Version 4, Help systemÓ
Cortez T, Gonzalez AF, Guerra A (1999) Growth ofOctopus mimus
(Cephalopoda, Octopodidae) in wild populations. Fish Res (Amst) 42:31–39
Davis JP, Wilson JG (1985) The energy budget and population structure ofNucula turgidain Dublin Bay. J Anim Ecol 54:557– 571
DiSalvo LH, Alacron E, Martinez G, Uribe E (1984) Progress in the mass culture ofArgopecten purpuratuswith notes on its natural history. Rev Chilena Hist Nat 57:33–45
Eppley RW (1972) Temperature and phytoplankton growth in the sea. Fish Bull 70:1063–1085
Fre´on P (2006) Interdecadal variability of anchovy abundance and overcapacity of commercial fleets in Peru. In: International conference of the Humboldt Current system: climate, ocean dynamics, ecosystem processes, and fisheries, Lima, Peru, November 27–December 1, 2006
Froese R, Pauly D (2006) FishBase.http://www.fishbase.org Gonzales EI, Ye´pez VE (2007) Estudio de lı´nea base de la bahı´a de
Sechura. Inst Mar Peru´, Lima, pp 122
Huebner JD, Edwards DC (1981) Energy budget of the predatory marine gastropodPolinices duplicatus. Mar Biol 61:221–226 Humphreys WF (1979) Production and respiration in animal
popu-lations. J Anim Ecol 48:427–453 doi:10.2307/4171
Hutchings L, Verheye HM, Mitchell-Innes BA, Peterson WT, Huggett JA, Painting SJ (1995) Copepod production in the southern Benguela system. ICES J Mar Sci 52:439–455 Jarre A, Muck P, Pauly D (1991) Two approaches for modelling fish
stock interactions in the Peruvian upwelling ecosystem. ICES Mar Sci Symp 193:178–184
Keen MA (1972) Sea Shells of Tropical West America - Marine Mollusks from Baja California to Peru. Stanford University Press, Stanford, California
Kremer JN, Nixon SW (1977) A coastal marine ecosystem. Simu-lation and analysis. Springer, New York
Lang M (2000) Populations struktur und Konsum verhaltungder decapoden Krebse Cancerpolydon und Cancer porteri inder Independencia Bucht, Peru. Diplome thesis, Bremen University, Bremen
Leon RI, Stotz WB (2004) Diet and prey selection dynamics of Cancer polyodon in three different habitat types in Tongoy Bay, Chile. J Mar Biol Assoc UK 84:751–756
Lluch-Cota DB, Wooster WS, Hare SR (2001) Sea surface temper-ature variability in coastal areas of the Northeastern Pacific related to the El Nino-Southern Oscillation and the Pacific Decadal Oscillation. Geophys Res Lett 28:2029–2032
Mann KH (1982) Ecology of coastal waters. A systems approach. University of California Press, Berkeley
Macchiavello J, Fonck E, Edding M (1987) Antecedentes y perspec-tivas de 1Cultivo de Gracilaria en Coquimbo. In:Arana P (ed) Manejo y Desarollo Pesquero. Univ. Catolica deValparaiso, Valparaiso, Chile, pp 206–214
Martin D, Gre´mare A (1997) Secondary production ofCapitellasp. (Polychaeta: Capitellidae) inhabiting different organically enriched environments. Sci Mar (Barc) 61:99–109
Mendoza JJ (1993) A preliminary biomass budget for the northeastern Venezuela shelf ecosystem. In: Christensen V, Pauly D (eds) Trophic models of aquatic ecosystems. ICLARM Conference Proceedings, pp 285–297
Mendo J, Tam J (1993) Multiple environmental states affecting penaeid shrimp production in Peru. Naga 16:44–47
Mendo J, Valdivieso V, Yamashiro C, Jurado E, Moro´n O, Rubio J (1987) Evaluacio´n de la poblacio´n de concha de abanico
(Argopecten purpuratus) en la Bahı´a Independencia, Pisco,
Peru, 17 de enero - 4 de febrero de 1987 Instituto del Mar del Peru (IMARPE), Callao, Peru, pp 63
Moloney CL, Jarre A, Arancibia H, Bozec Y-M, Neira S, Jean-Paul Roux J-P, Shannon LJ (2005) Comparing the Benguela and Humboldt marine upwelling ecosystems with indicators derived from intercalibrated models. ICES J Mar Sci 62:493– 502
Monaco ME, Ulanowicz RE (1997) Comparative ecosystem trophic structure of three U.S. mid-Atlantic estuaries. Mar Ecol Prog Ser 161:239–254
Montecinos A, Purca S, Pizarro O (2003) Interannual-to-interdecadal sea surface temperature variability along the western coast of South America. Geophys Res Lett 30:1570–1573
Navarro JM, Gonzalez CM (1998) Physiological responses of the Chilean scallopArgopecten purpuratusto decreasing salinities. Aquaculture 167:315–327
Neira S, Arancibia H (2004) Trophic interactions and community structure in the upwelling system off Central Chile (33-39 degrees S). J Exp Mar Biol Ecol 312:349–366
Odum EP (1969) The strategy of ecosystem development. Science (Wash DC) 104:262–270
Ortiz M, Wolff M (2002) Trophic models of four benthic commu-nities in Tongoy Bay (Chile): comparative analysis and preliminary assessment of management strategies. J Exp Mar Biol Ecol 268:205–235
Pauly D, Christensen V (1995) Primary production required to sustain global fisheries. Nature 374:255–257
Polovina JJ, Ow MD (1985) An approach to estimating an ecosystem box model. Fish Bull 83:457–460
Rouillon G, Mendo J, Ochoa N (2002) Fitoplankton en el contenido estomacal deArgopecten purpuratus(Mollusca, Bivalvia) sus-pendida a differentes profundidades en Bahı´a Independencia. In: Mendo J, Wolff M (eds) Memorias I Jornada ‘‘Bases Ecolo´gicas y Socioecono´micas para el Manejo de los Recursos Vivos de la Reserva Nacional de Paracas’’. Universidad Nacional Agraria La Molina, Lima, pp 60–67
Rybarczyk H, Elkaim B, Ochs L, Loquet N (2003) Analysis of the trophic network of a macrotidal ecosystem: the Bay of Somme (Eastern Channel). Estuar Coast Shelf Sci 58:405–421 Samame´ M, Benites C, Valdivieso V, Mendez M, Yamashiro C, Moron O (1985) Evaluaco´n del recurso concha de abanico
(Argopecten purpuratus) en la Bahı´a Independencia, Pisco, en
Octubre-Noviembre 1985. Inst Mar Peru´, pp 63
Schwinghamer P, Hargrave B, Peer D, Hawkins CM (1986) Partitioning of production and respiration size among size groups of organisms in an intertidal benthic community. Mar Ecol Prog Ser 31:131–142
Stotz W (2000) When aquaculture restores and replaces an overfished stock: is the conservation of the Species assured? The case of the scallop Argopecten purpuratus in Northern Chile. Aquac Int 8:237–247
Stotz WB, Gonza´lez SA (1997) Abundance, growth, and production of the sea scallopArgopecten purpuratus(Lamarck 1819): bases for sustainable exploitation of natural scallop beds in north-central Chile. Fish Res (Amst) 32:173–183
Tafur R, Castillo G, Crispin A, Taipe A (2000) Evaluacio´n Poblacional de la Concha de Abanico en la Bahı´a de Sechura e Isla Lobos de Tierra (Julio 1999). IMARPE, Lima, pp 14 Taylor MH, Wolff M, Mendo J, Yamashiro C (2007a) Input–output
parameters for the steady-state models of Independence Bay for the years 1996 and 1998 before application of the Ecoranger resampling routine. PANGAEA, http://www.pangaea.de, doi: 10.1594/PANGAEA.666889
Taylor MH, Wolff M, Mendo J, Yamashiro C (2007b) Diet matrix for the steady-state models of Independence Bay for the years 1996 and 1998 before application of the Ecoranger resam-pling routine. PANGAEA, http://www.pangaea.de, doi: 10.1594/PANGAEA.667813
Taylor MH, Tam J, Blaskovic V, Espinoza P, Ballo´n RM, Wosnitza-Mendo C, Argu¨elles J, Dı´az E, Purca S, Ochoa N, Ayo´n P, Goya E, Quipuzcoa L, Gutie´rrez D, Wolff M (2007c) Trophic flows in the Northern Humboldt Current ecosystem, Part 2: elucidating mechanisms of ecosystem change over an ENSO cycle by simulating changes in low trophic level dynamics. Prog Ocean (in press)
Uriarte A, Prouzet P, Villamor B (1996) Bay of Biscay and Ibero Atlantic anchovy populations and their fisheries. Sci Mar 60:237–255
Vega R, Mendo J (2002) Consumo de alimento y crecimiento del pulpoOctopusspp. alimentado conArgopecten purpuratusen la Bahı´a de Paracas, Pisco. In: Mendo J, Wolff M (eds) Memorias I Jornada ‘‘Bases Ecolo´gicas y Socioecono´micas para el Manejo de los Recursos Vivos de la Reserva Nacional de Paracas’’. Universidad Nacional Agraria La Molina, Lima, pp 212–220 Villegas P (2001) Growth, life cycle and fishery biology ofLoligo
gahi(d’Orbigny, 1835) off the Peruvian coast. Fish Res (Amst) 54:123–131
Walters C, Christensen V, Pauly D (1997) Structuring dynamic models of exploited ecosystems from trophic mass-balance assessments. Rev Fish Biol Fish 7:139–172
Walters CJ, Martell SJD (2004) Fisheries ecology and management. Princeton University Press, Princeton
Warnke K (1999) Observations on embryonic development of
Octopus mimus(Mollusca: Cephalopoda) from Northern Chile.
Veliger 42:211–217
Welch HE (1968) Relationships between assimiliation efficiencies and growth efficiencies for aquatic consumers. Ecology 49:755– 759 doi:10.2307/1935541
Wilson JG, Parkes A (1998) Network analysis of the energy flow through the Dublin ecosystem. Biology and Environment: Proceedings of the Royal Irish Academy 98B:179–190 Wolff M (1987) Population dynamics of the Peruvian scallop
Argopecten purpuratus during the El Nino phenomenon of
1983. Can J Fish Aquat Sci 44:1684–1691
Wolff M (1994) A trophic model for Tongoy Bay – a system exposed to suspended scallop culture (northern Chile). J Exp Mar Biol Ecol 182:149–168
Wolff M, Perez H (1992) Population dynamics, food consumption and gross conversion efficiency ofOctopus mimusGould, from Antofagasta, (northern Chile) ICES Council Meetings Papers. ICES, Copenhagen (Denmark), pp 12
Wolff M, Soto A (1992) Population dynamics of Cancer polyodon in La Herradura Bay, northern Chile. Mar Ecol Prog Ser 85:70–81 Wolff M, von Brand E, Jollan L (1991) Temperature shock treatment for early larval selection in the Chilean scallop Argopecten
purpuratus (Lamarck, 1819). In: Shumway SE, Sandifer PA
(eds) World aquaculture workshops, 1. An international com-pendium of scallop biology and culture—a tribute to James Mason. Selected papers from the 7th International Pectinid Workshop. The World Aquaculture Society, Baton Rouge (USA), pp 357
Wolff M, Taylor M, Mendo J, Yamashiro C (2007) A catch forecast model for the Peruvian scallop (Argopecten purpuratus) based on estimators of spawning stock and settlement rate. Ecol Model 209:333–341. doi:10.1016/j.ecolmodel.2007.07.013