R E S E A R C H
Open Access
C:N:P stoichiometry of particulate and
dissolved organic matter in river waters
and changes during decomposition
Mohammad Jahidul Islam
1, Changwon Jang
2, Jaesung Eum
2, Sung-min Jung
2, Myoung-Sun Shin
2,
Yunkyoung Lee
2, Youngsoon Choi
2and Bomchul Kim
2*Abstract
Background:Stoichiometry plays an important role in understanding nutrient composition and cycling processes in aquatic ecosystems. Previous studies have considered C:N:P ratios constant for both DOM (dissolved organic matter) and POM (particulate organic matter). In this study, water samples were collected in the six major rivers in Korea and were incubated for 20 days. C:N:P ratios were determined during the time course of the incubations. This allowed us to examine the changes in N and P contents of organic matter during decomposition.
Results:POM and DOM showed significant differences in N and P content and the elemental ratios changed during the course of decomposition; DOM showed higher C:N and C:P ratios than POM, and the C:N and C:P ratios increased during decomposition, indicating the preferential mineralization of P over N and N over C.
Conclusions:The N and P contents of organic matter in aquatic ecosystem are far from constant and vary
significantly during decomposition. More detailed information on the changes in C:N:P ratios will provide improved understanding of decomposition processes and improved modeling of aquatic ecosystems.
Keywords:Organic matter C:N:P, POM, DOM, Labile and refractory organic matter, River water
Background
Nutrient cycling processes are important functions of freshwater ecosystems that affect water quality and the impacts of eutrophication. Changes in the stoichiometry of organic matter are associated with nutrient cycling and ecosystem biogeochemical processes. Transforma-tions of nitrogen (N) and phosphorus (P) in organic forms reflect to the assimilation and dissimilation of these important nutrients. Organic matter is initially synthesized in aquatic ecosystems mostly through algal photosynthesis, and the C:N:P ratio is well known to be close to the Redfield ratio (106:16:1).
However, during the decomposition of organic matter, the behavior and the rates of mineralization of C, N, and P can vary. It is known that the mineralization rate of organic P is much faster than the mineralization rate of
organic C and N, resulting in the deviation of C:N:P ra-tio from the Redfield rara-tio (Islam et al.2013; Jeanneau et al. 2018). Another factor that affects C:N:P ratio of or-ganic matter is the input of allochthonous oror-ganic mat-ter. Organic matter derived from vegetation in a watershed usually stays in the watershed for enough time to be degraded and transformed into recalcitrant humic substances which have low N and P contents be-fore they are exported into streams. Sewage and manure can also undergo artificial humification in biological treatment plants or composting process.
Algae are known to have the ability of adjusting their C:N:P ratios according to food quality (Sterner and George2000; Hall et al.2005). Due to the large variation in P availability, freshwater organisms may alter their C:P and N:P ratios (Elser et al. 2005; Cross et al.2007; Fitter and Hillebrand 2009). To maintain optimal body C:N:P ratios and growth, microorganisms can adjust their enzymatic activities to control the mineralization of organic N and P (Sinsabaugh et al.2009). Cleveland and * Correspondence:[email protected]
2Department of Environmental Science, Kangwon National University,
Kangwon-do, Chuncheon, South Korea
Full list of author information is available at the end of the article
Liptzin (2007) reported that the average C:N:P ratio is 186:13:1 in soil and 60:7:1 in microbial communities. Other studies have found that the variations of C:N and C:P ratios of periphyton in stream ecosystems are re-markable (Stelzer and Lamberti2001).
Because CNP stoichiometry can change significantly among different environments, this can cause uncertainty in the selection of correct coefficients when assessing nu-trient cycling processes in modeling efforts. Usually one constant coefficient is selected for the stoichiometry in most models because we lack adequate knowledge to trace changes in stoichiometry, and it is practically difficult to estimate constituent coefficients as a function of environ-mental conditions. In this study, the changes in N and P contents of organic matter in river waters were measured and the changes in C:N:P ratios during decomposition process were examined. The constituent coefficients will help understand nutrient cycling processes in aquatic eco-systems and contribute to the selection of suitable param-eters in ecosystem models.
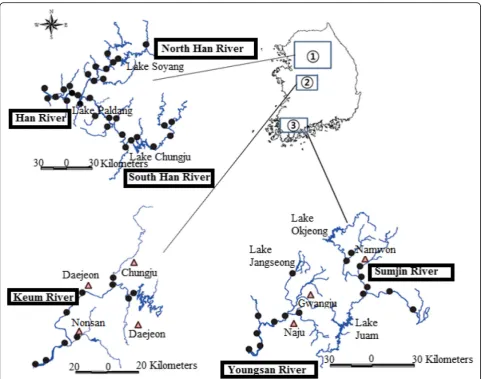
Methods Study area
The rivers sampled in this experiment included the major rivers in Korea. The Han River, the North Han River, and the South Han River are located between 37° 33′N and 126° 59′E. The Han River is the largest river based on basin area and river discharge with a basin area of 26,018 km2. The Keum River is located between 35°
59′ N and 126°39′E. The Youngsan River and the
Sumjin River are located in the central to southern area of Korea between 35°20′and 35°15′N and between 126° and 127° E. The watershed areas of the Youngsan River and the Sumjin River are 3522 km2 and 4897 km2, re-spectively. The river reaches are short, and the river basin areas in Korea are small compared with the other major continental rivers. The channel slopes are rela-tively steep upstream because of steep mountains and deep valleys in the uplands. Due to the natural topog-raphy and river regulation, the downstream regions have considerably lower slopes. The distribution of precipita-tion among the study watersheds is more varied than that of temperature. During the rainy season from June to September, Korea receives approximately 70% of its annual precipitation. River bank erosion in Korea is rela-tively low because of the dominance of rocky structures near the shoreline. However, the land uses within the river basins largely consist of residential, industrial, com-mercial, livestock, pasture, row crops, and forestry.
Collection of samples and measurement of decomposition rates
We measured the amount of particulate organic carbon (POC), particulate organic nitrogen (PON), particulate
organic phosphorus (POP), dissolved organic carbon (DOC), dissolved organic nitrogen (DON), and dissolved organic phosphorus (DOP) in six rivers in Korea from October 2005 to October 2008 to assess changes in par-ticulate and dissolved fractions of organic C, N, and P during decomposition. The sampling sites were the Keum River (10 sites), the Youngsan River (8 sites), the Sumjin River (8 sites), the North Han River (10 sites), the Han River (6 sites), and the South Han River (15 sites). The sampling sites are shown in Fig.1. The num-ber of replicates from each sampling site varied from 3
to 4 (Table 1). Water samples were collected in
pre-cleaned polyethylene bottles thoroughly rinsed with surface water and stored in the dark at 4 °C to minimize deterioration prior to analysis. The water samples were filtered with 200-μm mesh-sized net and were incubated in the dark at a constant temperature of 20 °C. Each incubation bottle was aerated by aquar-ium pumps to provide aerobic conditions and to re-duce particle settling. When the water samples were collected, the entire bottle was shaken vigorously to resuspend any settled particles. Although the decom-position rates under aerobic and anaerobic conditions likely differ, this study focused on aerobic decompos-ition. In most cases, river water in Korea is aerobic.
In this study, organic matter was differentiated accord-ing to biodegradability as labile organic matter and re-calcitrant organic matter. Organic matter was analyzed at the beginning of the incubation and analyzed again after the 20 days incubation. The organic matter remaining after 20 days was regarded as recalcitrant or-ganic matter, and the amount of change during the incu-bation was regarded as labile organic matter. Therefore, total concentration means the initial labile N and P con-centrations, and the final N and P concentrations of re-calcitrant organic matter.
The glassware was cleaned with nutrient P-free deter-gent (Extrans), rinsed three times with ultra-pure water (Milli-Q), soaked in 10% (v/v) HCl for at least 24 h, and then rinsed three times with ultra-pure water. Using an incubation approach, measurements were done at 0 and 20 days from the start of the experiment.
DOC (dissolved organic carbon) concentrations were measured with a TOC analyzer (Shimadzu TOC-5000A) using the high-temperature catalytic oxidation method. After filtering the sample, the filters for the POC analysis were fumigated in an acidifying desiccator filled with 12 N HCl for approximately 4 h. After removing the DIC, the filters were wrapped in tin foil and analyzed by a CHN elemental analyzer (VARIO-EL).
persulfate digestion, using a flow-injection autoanalyzer (SKALAR). Nitrate concentrations were measured with an autoanalyzer by the Cd-reduction method. DTN was oxidized to NO3− with potassium persulfate and ana-lyzed in a similar manner to NO3−. Ammonia concentra-tions were measured by the spectrophotometry, and nitrite concentrations were measured by a flow injection autoanalyzer (APHA (American Public Health Associ-ation) 2005). DON was calculated as DTN–(NO2−+ NO3−+ NH4+). PON was calculated as the difference between the TN and the DTN. The measurements of PON, DON, NH4+, NO2−, and NO3− concentrations were performed at 0 and 20 days after the beginning of the incubation.
DIP (dissolved inorganic P), DTP (dissolved total P), and TP (total P) concentrations of the water samples were measured. DIP was analyzed after GF/F filtration
(0.45μm) using the molybdenum blue method (APHA
(American Public Health Association) 2005). DTP was estimated from the filtered sample as the DIP after per-sulfate digestion (APHA (American Public Health Asso-ciation) 2005). DOP was obtained by subtracting DIP from DTP. TP was analyzed on the unfiltered sample as for DIP after persulfate digestion and determined using the molybdenum blue method (APHA (American Public Health Association) 2005). In both the particulate and dissolved organic forms of C, N, and P, the labile and refractory fractions were calculated as organic C, N, P = labile C, N, P + refractory C, N, P.
The temperature, pH, and EC were measured in situ with a YSI model 600 multi-parameter water analyzer.
DO was measured using a DO meter. For CODMn, 30
mL samples were treated with 5 mN KMnO4 in 1%
NaOH for 1 h at 100 °C in an autoclave.
Results and discussion
Water quality characteristics and CNP content of organic matter
The median values of water quality parameters in the study rivers were pH 7.6, conductivity 220 μs cm−1, DO 9.8 mg O2L−1, COD 5.59 mg O2L−1, DIP 22 mgP m−3, ammonia 120 mgN m−3, and nitrate 1430 mgN m−3. Of the six rivers in this study, two rivers were mesotrophic according to TP concentrations, but majority of sites were eutrophic due to the input of municipal sewage. The mean POC was 1482 mgC m−3(Table1) which is slightly lower than the world river median value of 2000 mgC m−3
(Wetzel 2001). However, DOC showed a mean of
2572 mgC m−3, ranging 975–4400 mgC m−3, which is much lower than the median value of world river (5000 mgC m−3) as suggested by Wetzel (2001) (Table1). DOC concentrations in this study was also much lower than the median value of world eutrophic lakes (10,000 mgC m−3), and it was rather closer to the average
concentration of oligotrophic lakes (2000 mgC m−3). It is not known why DOC is low in Korean rivers, which is possibly associated with geological features and terrestrial ecosystems. Therefore, the DOC:POC ratio (1.6) in this study was lower than the median value of the world river of 3 (Dagg et al.2004).
The median atomic C:N ratio of POM was 2.32, which is lower than the Redfield ratio (6.6). This implies that the median N concentration of POM is 23%, higher than the typical values for N concentration that are employed
in water quality models (6–9%) (APHA (American
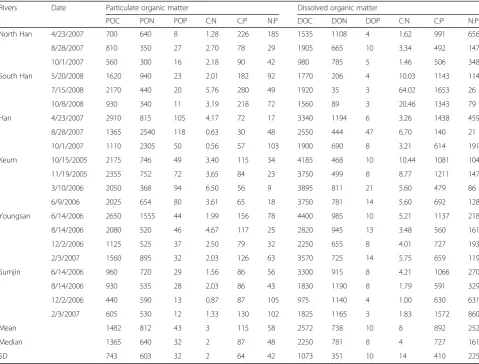
Public Health Association) 2005) (Tables 2 and 3). The median C:P ratio of POM was 120, which is similar to the Redfield ratio of 106. This corresponds to a P con-centration of 0.97%, which is close to the parameter values of water quality model; USEPA (Environmental Protection Agency) suggested 1.0% but the CE-QUAL-W2 model adopted 0.5%. Other studies showed that the C:P ratio of algae is similar to the Redfield ratio in Table 1Median concentrations of particulate organic carbon(POC), dissolved organic carbon (DOC), particulate organic phosphorus (POP), dissolved organic phosphorus (DOP), particulate organic nitrogen (PON), and dissolved organic nitrogen (DON) in the studied rivers and their molar ratios
Rivers Date Particulate organic matter Dissolved organic matter
POC PON POP C:N C:P N:P DOC DON DOP C:N C:P N:P
North Han 4/23/2007 700 640 8 1.28 226 185 1535 1108 4 1.62 991 656
8/28/2007 810 350 27 2.70 78 29 1905 665 10 3.34 492 147
10/1/2007 560 300 16 2.18 90 42 980 785 5 1.46 506 348
South Han 5/20/2008 1620 940 23 2.01 182 92 1770 206 4 10.03 1143 114
7/15/2008 2170 440 20 5.76 280 49 1920 35 3 64.02 1653 26
10/8/2008 930 340 11 3.19 218 72 1560 89 3 20.46 1343 79
Han 4/23/2007 2910 815 105 4.17 72 17 3340 1194 6 3.26 1438 459
8/28/2007 1365 2540 118 0.63 30 48 2550 444 47 6.70 140 21
10/1/2007 1110 2305 50 0.56 57 103 1900 690 8 3.21 614 191
Keum 10/15/2005 2175 746 49 3.40 115 34 4185 468 10 10.44 1081 104
11/19/2005 2355 752 72 3.65 84 23 3750 499 8 8.77 1211 147
3/10/2006 2050 368 94 6.50 56 9 3895 811 21 5.60 479 86
6/9/2006 2025 654 80 3.61 65 18 3750 781 14 5.60 692 128
Youngsan 6/14/2006 2650 1555 44 1.99 156 78 4400 985 10 5.21 1137 218
8/14/2006 2080 520 46 4.67 117 25 2820 945 13 3.48 560 161
12/2/2006 1125 525 37 2.50 79 32 2250 655 8 4.01 727 193
2/3/2007 1560 895 32 2.03 126 63 3570 725 14 5.75 659 119
Sumjin 6/14/2006 960 720 29 1.56 86 56 3300 915 8 4.21 1066 270
8/14/2006 930 535 28 2.03 86 43 1830 1190 8 1.79 591 329
12/2/2006 440 590 13 0.87 87 105 975 1140 4 1.00 630 631
2/3/2007 605 530 12 1.33 130 102 1825 1165 3 1.83 1572 860
Mean 1482 812 43 3 115 58 2572 738 10 8 892 252
Median 1365 640 32 2 87 48 2250 781 8 4 727 161
SD 743 603 32 2 64 42 1073 351 10 14 410 225
optimum eutrophic conditions and high growth rates, but the C:P ratio can be as high as 1000 in P-limited conditions, deviating significantly from the Redfield ratio due to the stress of phosphorus deficiency (Goldman et al.1979; Sterner and Elser 2002). The study sites in this study were mostly eutrophic river and reservoirs, and it can be inferred that the C:P ratio did not deviate much from the Redfield ratio because P deficiency stress was not likely.
The P concentration of algae has an important function in some water quality models, especially for estimating algae growth. Because P is the limiting nu-trient in most rivers and reservoirs, maximum algal
densities are determined by P concentrations. In most of these models, algal growth is calculated on the basis of the limiting nutrient. The algal biomass is converted from P to corresponding dry weight or carbon by using the P composition coefficient of algae. Therefore, the uncertainty in P content is directly proportional to the uncertainty in algal density. For example, if the P concentration in algae is two times higher than at controlled condition, the maximum algal density can be the half of the controlled density. Therefore, it is very important for accurate model re-sults to have the most appropriate coefficient for P concentration in algae.
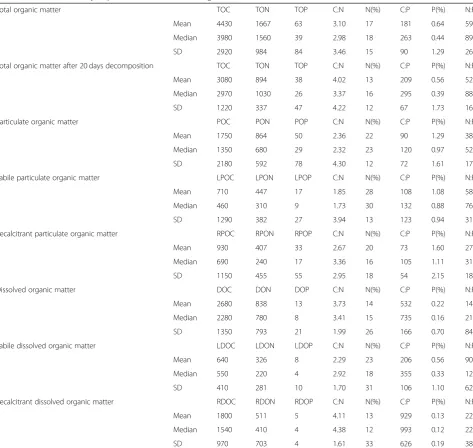
Table 2CNP stoichiometry of particulate and dissolved organic matter
Total organic matter TOC TON TOP C:N N(%) C:P P(%) N:P
Mean 4430 1667 63 3.10 17 181 0.64 59
Median 3980 1560 39 2.98 18 263 0.44 89
SD 2920 984 84 3.46 15 90 1.29 26
Total organic matter after 20 days decomposition TOC TON TOP C:N N(%) C:P P(%) N:P
Mean 3080 894 38 4.02 13 209 0.56 52
Median 2970 1030 26 3.37 16 295 0.39 88
SD 1220 337 47 4.22 12 67 1.73 16
Particulate organic matter POC PON POP C:N N(%) C:P P(%) N:P
Mean 1750 864 50 2.36 22 90 1.29 38
Median 1350 680 29 2.32 23 120 0.97 52
SD 2180 592 78 4.30 12 72 1.61 17
Labile particulate organic matter LPOC LPON LPOP C:N N(%) C:P P(%) N:P
Mean 710 447 17 1.85 28 108 1.08 58
Median 460 310 9 1.73 30 132 0.88 76
SD 1290 382 27 3.94 13 123 0.94 31
Recalcitrant particulate organic matter RPOC RPON RPOP C:N N(%) C:P P(%) N:P
Mean 930 407 33 2.67 20 73 1.60 27
Median 690 240 17 3.36 16 105 1.11 31
SD 1150 455 55 2.95 18 54 2.15 18
Dissolved organic matter DOC DON DOP C:N N(%) C:P P(%) N:P
Mean 2680 838 13 3.73 14 532 0.22 143
Median 2280 780 8 3.41 15 735 0.16 216
SD 1350 793 21 1.99 26 166 0.70 84
Labile dissolved organic matter LDOC LDON LDOP C:N N(%) C:P P(%) N:P
Mean 640 326 8 2.29 23 206 0.56 90
Median 550 220 4 2.92 18 355 0.33 122
SD 410 281 10 1.70 31 106 1.10 62
Recalcitrant dissolved organic matter RDOC RDON RDOP C:N N(%) C:P P(%) N:P
Mean 1800 511 5 4.11 13 929 0.13 226
Median 1540 410 4 4.38 12 993 0.12 227
SD 970 703 4 1.61 33 626 0.19 389
When N:P ratios of POM and DOM were compared, DOM had higher N:P ratios than POM and greater devi-ation from the Redfield ratio. The median N concentra-tion was 23% for POM, compared with 15% for DOM (Table2). And the P concentration showed a much big-ger difference than nitrogen; 0.97% for POM and 0.16% for DOM. The reasons why DOM had lower P concen-trations than POM are not examined in this study. One plausible explanation is that P leach from particulate or-ganic molecules faster than the loss of N and C.
In the comparison of labile and recalcitrant forms of organic matter, the median LPOC was 460 mg m−3
and RPOC was 690 mg m−3 which shows that 40% of
POM was labile. For DOM, the proportion of labile
form was 26%, LDOC was 550 mg m−3, and RDOC
was 1540 mg m−3 (Table 2).
Changes in stoichiometric ratios during decomposition In accordance with the differences in N:P ratios in POM and DOM, N:P ratios showed remarkable change during the course of decomposition. The most remarkable change during the decomposition was the decrease in P concentration. The median value of the TOC:TOP was 263:1 at the start of the incubation, whereas the ratio was 295:1 after 20 days, showing that the P concentrations be-came lower during decomposition. When organic matter was differentiated into four categories of LPOM, RPOM, LDOM, and RDOM, it was found that LDOM portion showed a significant change of P concentration after decomposition. The DOC:DOP ratio of LDOM was 355 (P concentration 0.33%), but the ratio increased to 993 (P concentration 0.12%) after decomposition. The change of P concentration in LDOM was remarkable; however, the major reason for the decrease in P concentration during the incubation is thought to be the degradation of LPOM (higher P concentrations 0.88%) into DOM (lower P concentrations 0.16%) than POM (Table2).
The changes in C:P indicate the preferential
mineralization of organic P over organic C and organic N. This result coincides with reports about the
differential mineralization of organic P and organic C (Guo and Santschi 1997; Søndergaard et al.2000; Islam et al. 2013). Because P is the limiting nutrient in fresh-water, algae have developed efficient enzyme system for competitive utilization of organic P. Inorganic ortho-phosphate is preferably absorbed by algae, and then or-ganic matter acts as a reservoir of potential P sources. Algae and bacteria are known to excrete an extracellular enzyme, alkaline phosphatase, in order to facilitate P ab-sorption when inorganic phosphate is deficient. Alkaline phosphatase is attached to the cell surface or excreted out of cells as dissolved free enzyme, and cleave the ester bond between organic carbon and phosphate of dis-solved organic matter (Wetzel1991).
The result of this study confirms that the rate of mineralization can be quite different for organic C and or-ganic P. Particulate oror-ganic matter in freshwater can be synthesized by algal growth initially and this “young” or-ganic matter will have similar a C:N:P ratio with the Red-field ratio. Through enzymatic activities, POM is transformed into“old” dissolved organic matter with low P concentration and finally mineralized into inorganic matter. The large difference of P concentration in POM and DOM implies that the age and biochemical history of organic matter might be important factors in the consider-ation of stoichiometry in addition to the nutrient availabil-ity and species composition (Klausmeier et al.2004).
Molar ratios of labile and recalcitrant P and N
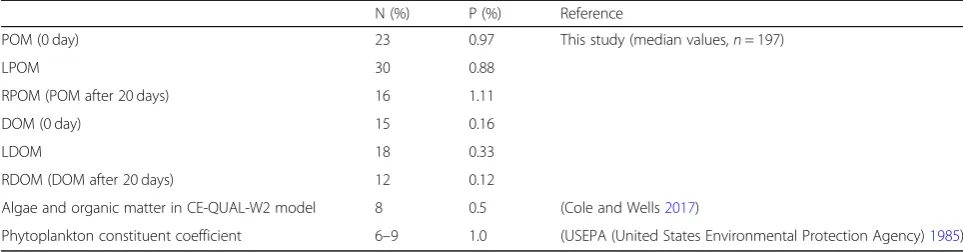
Relationships between the C:N:P ratios of river organic matter offer an informative look at organic matter dy-namics. The molar ratios of labile and recalcitrant P and N fractions in different seasons at different sampling sites varied widely. These variations were considered reasonable because the different sampling locations var-ied with respect to urban and industrial discharges and runoff, agricultural activities, and the bathymetric char-acteristics. The median ratio of LPON:LPOP in the stud-ied rivers was 76 (Table 2). But in case of dissolved fractions, the median LDON:LDOP ratio was 122 Table 3N and P contents in labile and recalcitrant forms of POM and DOM of river water measured after 20 days incubation, and the comparison with other model coefficients
N (%) P (%) Reference
POM (0 day) 23 0.97 This study (median values,n= 197)
LPOM 30 0.88
RPOM (POM after 20 days) 16 1.11
DOM (0 day) 15 0.16
LDOM 18 0.33
RDOM (DOM after 20 days) 12 0.12
Algae and organic matter in CE-QUAL-W2 model 8 0.5 (Cole and Wells2017)
(Table 2). In contrast, the median ratio of RPON:RPOP was 31 while the median ratio of RDON:RDOP was 227 (Table2). The ratios of labile LPON: LPOP increased dur-ing decomposition while the ratios of LDON:LDOP de-creased than the initial PON:POP and DON:DOP ratios reflecting faster decomposition of LPOP than LPON.
The spatial and temporal changes in the C:N:P ratios of POM could be due to the variations in proportions of the four major groups of biomolecules (carbohydrates, lipids, proteins, and P-compounds). The N:P ratio of DOM in unpolluted rivers is 30_170 (Meybeck1982). In this study, there were also significant differences in the N:P ratios of the POM and DOM. In fact, the average N:P molar ratio of POM (Table 1) in the Keum River throughout the study period (N:P, 21), in the Youngsan River during August (N:P, 25), and in the Han River dur-ing April (N:P, 17) was close to the Redfield ratio of 16, typical of detrital organic matter derived from aquatic plants and phytoplankton (Anderson1995). The N:P ra-tio of organic matter in the other rivers differed more widely from the Redfield ratio, perhaps due to the marked increase in the proportion of particulate carbo-hydrates at the expense of proteins and P-compounds. Depending on the type of vegetation, such as plants with soft tissues vs. woody tissues, terrestrial organic matter shows a wide range of N:P ratios. The terrestrial plants have low N and P contents with N:P ratios of 10_100 and 100_1000 for soft tissues and woody tissues, respect-ively (Ruttenberg and Goni1997).
Conclusions
During and decomposition of organic C, P, and N, both labile and refractory fractions are essential to understand the C, N, and P dynamics in aquatic systems. There were major differences in the relative amount of labile and re-calcitrant fractions of POC, DOC, PON, DON, POP, and DOP as a result of preferential mineralization of P over N and N over C. Our results provide some details on changes in the ratios of organic C, N, and P that will be useful for understanding organic matter decomposition and biogeochemical nutrient cycling and modeling appli-cations in freshwater ecosystems.
Abbreviations
CNP:Carbon nitrogen phosphorus; COD: Chemical oxygen demand; DIP: Dissolved inorganic phosphorus; DO: Dissolved oxygen; DOC: Dissolved organic carbon; DOM: Dissolved organic matter; DON: Dissolved organic nitrogen; DOP: Dissolved organic phosphorus; DTN: Dissolved total nitrogen; DTP: Dissolved total phosphorus; LDOC: Labile dissolved organic carbon; LDOM: Labile dissolved organic matter; LDON: Labile dissolved organic nitrogen; LDOP: Labile dissolved organic phosphorus; LPOC: Labile particulate organic carbon; LPOM: Labile particulate organic matter; LPON: Labile particulate organic nitrogen; LPOP: Labile particulate organic phosphorus; POC: Particulate organic carbon; POM: Particulate organic matter; PON: Particulate organic nitrogen; POP: Particulate organic phosphorus; RDOC: Refractory dissolved organic carbon; RDOM: Refractory dissolved organic matter; RDON: Refractory dissolved organic nitrogen; RDOP: Refractory dissolved organic phosphorus; RPOC: Refractory particulate
organic carbon; RPOM: Refractory particulate organic matter;
RPON: Refractory particulate organic nitrogen; RPOP: Refractory particulate organic phosphorus; TN: Total nitrogen; TOC: Total organic carbon; TON: Total organic nitrogen; TOP: Total organic phosphorus; TP: Total phosphorus
Acknowledgements
This study was supported by a Research Grant from Kangwon National University (No. 120140151) and the Korean Ministry of Environment.
Funding
This study was funded by a 2014 Research Grant from Kangwon National University (No. 120140151) and the Korean Ministry of Environment.
Availability of data and materials
The datasets generated during and/or analyzed during the current study are available from the corresponding author on reasonable request.
Authors’contributions
All authors contributed in the manuscript. BK designed the study. MJI, CJ, JE, SJ, MSS, YL, and YC collected and analyzed the data. MJI and BK wrote the initial draft of the manuscript. All authors read and approved the final manuscript.
Ethics approval and consent to participate
Not applicable.
Consent for publication
Not applicable.
Competing interests
The authors declare that they have no competing interests.
Publisher’s Note
Springer Nature remains neutral with regard to jurisdictional claims in published maps and institutional affiliations.
Author details
1Department of Agricultural Chemistry, Hajee Mohammad Danesh Science
and Technology University, Dinajpur 5200, Bangladesh.2Department of Environmental Science, Kangwon National University, Kangwon-do, Chuncheon, South Korea.
Received: 8 August 2018 Accepted: 13 December 2018
References
Anderson LA. On the hydrogen and oxygen contents of marine phytoplankton. Deep-Sea Res. 1995;42:1675–80.
APHA (American Public Health Association). Standard methods for the examination of water and wastewater, 21th ed. Washington, DC: American Public Health Association; 2005.
Cleveland CC, Liptzin DC. N:P stoichiometry in soil: is there“Redfield ratio”for the microbial biomass? Biogeochemistry. 2007;85:235–52.
Cole TM, Wells SA. CE-QUAL-W2: a two-dimensional, laterally averaged, hydrodynamic and water quality model, version 3.71. User manual. Washington, DC: U.S. Army Corps of Engineers; 2017.
Cross WF, Wallace JB, Rosemond AD. Nutrient enrichment reduces constrains on material flows in a detritus-based food web. Ecology. 2007;88:2563–75. Dagg M, Benner R, Lohrenz S, Lawrence D. Transformation of dissolved and
particulate materials on continental shelves influenced by large rivers: plume processes. Cont Shelf Res. 2004;24:833–58.
Elser JJ, Schampel JH, Garcίa-Pichel F, Wade BD, Souza V, Eguiarte L, et al. Effects of phosphorus enrichment and grazing snails on modern stromatolitic microbial communities. Freshw Biol. 2005;50:1808–25.
Fitter A, Hillebrand H. Microbial food web structure affects bottom-up effects and elemental stoichiometry in periphyton assemblages. Limnol Oceanogr. 2009;54:2183–200.
Goldman JC, McCartthy JJ, Peavey DG. Growth rate influence on the chemical composition of phytoplankton in oceanic waters. Nature. 1979;279:210–5. Guo L, Santschi PH. Isotopic and elemental characterization of colloidal organic
Hall SH, Smith VH, Lytle DA, Leibold MA. Constrains of primary producer N:P stoichiometry along N:P supply ratio gradients. Ecology. 2005;86:1894–904. Islam MJ, Jang C, Eom J, Jung S, Shin M-S, Lee Y, et al. The decomposition rates
of organic phosphorus and organic nitrogen in river waters. J Freshw Ecol. 2013;28(2):239–50.
Jeanneau L, Richard R, Shreeram I. Molecular fingerprinting of particulate organic matter as a new tool for its apportionment: changes along a headwater drainage in coarse, medium and fine particles as a function of rainfalls. Biogeosciences. 2018;15(4):973–85.
Klausmeier CA, Litchman E, Daufresne T, Levin SA. Optimal nitrogen-to-phosphorus stoichiometry of phytoplankton. Nature. 2004;429:171–4. Meybeck M. Carbon, nitrogen and phosphorus transport by world rivers.
Am J Sci. 1982;282:401–50.
Ruttenberg KC, Goni MA. Phosphorus distribution, C:N:P ratios andδ13C subOC in arctic, temperate, and tropical coastal sediments: tools for characterizing bulk sedimentary organic matter. Mar Geol. 1997;139:123–45.
Sinsabaugh RL, Hill BH, Follstad Shah JJ. Ecoenzymatic stoichiometry of microbial organic nutrient acquisition in soil and sediment. Nature. 2009;462:795–8. Søndergaard M, PJLeB W, Cauwet G, Riemann B, Robinson C, Terzic S, et al. Net
accumulation and flux of dissolved organic carbon and dissolved organic nitrogen in marine plankton communities. Limnol Oceanogr. 2000;45:1097–111. Stelzer RS, Lamberti GA. Ecological stoichiometry inrunning waters: periphyton
chemical composition and snail growth. Ecology. 2001;83:1039–51. Sterner RW, Elser JJ. Ecological stoichiometry: the biology of elements from
molecules to the biosphere. Princeton: Princeton University Press; 2002. Sterner RW, George N. Carbon, nitrogen, and phosphorus stoichiometry of
cyprinid fishes. Ecology. 2000;81:127–40.
USEPA (United States Environmental Protection Agency). Water quality analysis simulation program (WASP) version 6.0 user’s manual. Washington: United States Environmental Protection Agency. EPA/823/B/95/003; 1985. Wetzel RG. Extracellular enzymatic interactions in aquatic ecosystems: storage,