R E S E A R C H
Open Access
Changes in resource allocation among
vegetative organs during the clonal growth
of
Polygonatum humile
(Liliaceae) grown in
a temperate forest gap
Byeong-Mee Min
Abstract
Background:The aim of this study was to examine the resource allocation among the organs and the leaf morphology ofPolygonatum humile.The data were collected from June 2014 to May 2015 in a naturalP. humile stand of a temperate forest gap.
Results:The dry weight of new rhizome (R0) sharply decreased to the time of new shoot sprouting in next year
and was constant for 2 ~ 3 years. However, dry weight of root on R0increased to the end of growth season and,
thereafter, decreased slowly along the time elapsed. The correlation coefficients between the rhizome and the leaf sizes were 0.5 for the last year’s rhizome (R1) and 0.6 for R0and were significant at 0.1% level for R0. The increase of
one leaf a plant led to increase of the total leaf area, total leaf weight, and stem length. Moreover, the organ sizes’ differences between two plants of the one leaf difference were almost significant at 1% level. In 11-leaf plant, the leaf length/width ratio and specific lea area increased to the second, relative leaf area to the fourth and relative leaf dry weight to the fifth, and thereafter, decreased to the last leaf. The differences in the values of these four parameters between two leaves on a stem were almost significant at 5% level.
Conclusion:P. humileexamined showed the close relationships between the last year’s rhizome or this year’s one and the shoot system (leaf and stem) sizes. The leaf number a shoot greatly influenced specific leaf area.P. humile’s leaf might showed diverse morphology with leaf rank on a stem in a forest gap environment.
Keywords:Dry weight, Forest gap, Leaf rank,Polygonatum humile, Rhizome, Specific leaf area, Stem
Background
In temperate deciduous forests, understorey herbaceous plants are more sensitive than those in the open area to sunlight and use diverse strategies for adaptation to their environment. Shade-tolerant plants that can complete life cycle under the canopy slowly grow. However, light-demanding plants need gaps to grow to full plant size (Legner et al. 2013). Studies for the plant population in gap under the canopy have been performed for many times (Kern et al. 2013). Plants in perennial herb popula-tions in gaps compete with each other for sunlight and for minerals and water in the soil. Energy is needed for understorey herbaceous plant population to sustain their
asexual or sexual reproduction. However, photosynthesis is limited by low irradiance, and plant populations should apply proper strategies to ensure reproduction. Asexual reproduction by vegetative growth is generally used by understorey clonal herbaceous plants in temper-ate forests (Cook 1983, Gao et al. 2012). In these plants, shoot germination consumes root system energy in the early growth season, whereas photosynthetates produced by leaves are transported to the underground part in the late growth season. In these processes, root system bio-mass of the previous year directly influences the shoot size and, in turn, the latter determines the newly germi-nated former. However, it is unclear whether leaf area or leaf weight has a greater influence on biomass of the new root system. To accurately estimate biomass of the Correspondence:[email protected]
Department of Science Education, Dankook University, Yongin 16890, Korea
root system, a pertinent indicator is needed (Klinkhamer et al. 1990). Almost all leaves on a woody twig or on a stem of an herbaceous plant develop at the same time in temperate forest (Min 1995, Ishioka et al. 2013). These leaves are exposed to an almost the same microenviron-ment, so their morphologies or sizes should be similar. However, the leaves on a stem are morphologically and remarkably different from each other (Min 1995). More-over, it is unclear whether or not this dissimilarity is significant and whether it is caused mainly by genetic factors or by the microenvironments.
Polygonatum humile(Liliaceae) is generally distributed in grasslands or at forest edge in Korea (Choung 1991, Jang 2002), or in grasslands and sand dunes in Japan (Hasegawa and Kudo 2005). This species asexually or sexually reproduces (Lee 2003). In addition, this species flowers in May to June (Lee 2003). Asexual reproduction is accomplished by rhizome (Jang 2002), which grows in soil horizontally. The rhizome forms one main node per year and thus its age can be easily counted. Roots are formed on the rhizome and their number is decreased by their death with time. The shoot appears on the tip of the rhizome and its reported height is 60 ± 10.1 cm (Jang et al. 1998), 30∼50 cm (Choung 1991), 22.4–38.7 cm (Jang 2002), or 15–30 cm (Lee 2003, Hasegawa and Kudo 2005). The leaves ofP. humileare oval and have an entire margin (Choung 1991). The reported number of leaves is 5–8 (Choung 1991) or 13 (Jang et al. 1998). The leaf length and width are 12 ± 1.6 and 4.4 ± 6.7 cm (Jang et al. 1998) or 4–7 and 1.5–3 cm (Lee 2003), respectively. The number of rhizomes newly developed from a shoot is 1–2 (Choung 1991), 2 (Jang et al. 1998), or 2–4 (Jang 2002), and their length is 1.1–9.2 cm (Choung 1991). These data suggest thatP. humilehas the broad morphological range or is very sensitive to the microenvironment. The proper-ties thatP. humileis composed of one rhizome–one shoot and its leaf area can be easily estimated (oval and entire) are convenient for studying the relationship between the root and shoot systems and the main fac-tors of leaf variation, without destroying the whole plant. Moreover, energy shifting among roots, rhizome, and shoot (leaf and stem) in the non-flowering P. humile is simple and clear, and density is very high in narrow spaces. In Korea, many studies of Polygonatum
have been performed in terms of its use in pharmacol-ogy or agriculture (Seo et al. 2011), but few ecological studies are available. Moreover, studies for P. humile
are scarce and there are only two reports of Choung (1991) and Jang et al. (1998) for Korea.
The aim of this study was to examine the changes in biomass of vegetative parts and the response to the environment in a naturalP. humilepopulation, the rela-tionship between the number of leaves in a plant, and their properties along the leaf rank on a stem.
Methods
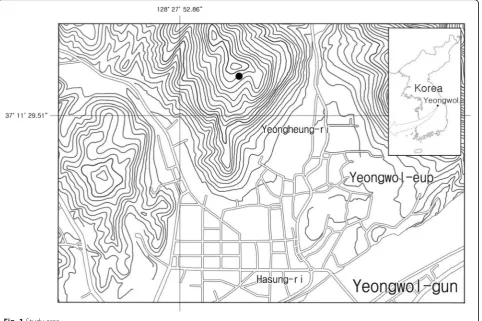
The location of the study area was at Yeongheung-ri, Yeongwal-eup, Yeongwal-gun, Gangwon province (37° 11′ 35.7″ N, 128° 28′ 04.0″E) (Fig. 1). The study site was 385 m a.s.l., (slope, 5°; direction, 175°). The annual mean air temperature and precipitation in an average year were 10.8 °C and 1224.1 mm, respectively, and those in 2015 were 12.5 °C and 676 mm on Yeongwal Meteorological Station.P. humilegrew in a gap created to move a grave to another place (radius, 10 m) and was momentarily shaded by trees in the south (Fig. 2a).
P. humile’s patch was about a 5 m × 6 m circle. Except
for P. humile, the herb layer was 5% in coverage and
composed ofAster scaber,Carex lanceolata,Festuca ovina,
and Zoysia japonica. The surrounding forest had four
layers of vegetation. The tree layer was composed ofPinus densiflora, Quercus mongolica, and Q. dentata and had 90% coverage. There wereP. densiflora,Q. serrata,Prunus sargentii, andEuonymus sieboldianaand 40% coverage in the subtree layer. There were Exochorda serratifolia,
Pourthiaea villosa, and Rhododendron mucronulatum in
the shrub layer andCarex lanceolata,Leibnizia anandria, andAster scaberin the herb one. The coverage was 10% in the former and 1% in the latter, respectively. Litter layer was 10 cm deep and A layer of soil was 10 cm deep. How-ever, the soil of the area thatP. humilapopulation was dis-tributed had been disturbed by work relocated to grave but had settled by the time of the study. Plant shoots were partly attached to each other and their rhizomes over-lapped or were located closely (Fig. 2b, c).
Field survey was carried out six times from June 22, 2014 to May 26, 2015. All plants were dug out together with soil from two 50 × 50 cm quadrats, and soil was slowly washed out by running water to prevent roots from breaking. The age of rhizome was up to 4 years. However, the numbers of 4-year and 3-year rhizome samples were very small. Thus, these samples were not analyzed. Only undamaged new rhizomes (R0) were counted. Rhizomes
longer than 6 cm were used to follow changes in root system biomass during the growth season and to assess the relationship between the root and shoot systems. According to Choung (1991), plants with rhizome longer than 6 cm did not change their size class in the next year. However, to analyze the total number and length of rhi-zomes per shoot, all rhirhi-zomes were counted. In the lab, plants were divided into the root and shoot systems. Roots were separated according to the age of rhizome and rhi-zomes were numbered of R0(this year’s rhizome), R1(the
last year’s rhizome), and R2 (2 years ago rhizome). Leaf
ranks on a stem were numbered from the lowest or the first leaf on a stem (L1) to the highest (the last leaf on a
Fig. 1Study area
a b
c
from analysis. Length, width and/or area in rhizomes, leaves and stems were measured, followed by oven-drying at 85 °C for 48 h and weighing on a Hansung Analytical and Precision Balance, model MARK M (1 mg unit) and model YMJ-C digital leaf area eter (0.0001 cm2 unit). Values of leaf size along the leaf rank were calculated for each leaf relative to those of L1. Significance of the
differences was verified by Student t-test, and correlation coefficients (CCs) between the two factors were calculated by Pearson’s equation (y= ax+ b).
Results
Relationships between the root and the shoot’s systems The number of new rhizomes (R0; > 1 cm in length) per
shoot was 1, 2, or 3. Shoots forming three R0s were most
represented (Table 1). The largest R0 was 25.5 cm in
length, with dry weight of 1262 mg. The maximum root dry weight on an R1(the last year’s rhizome) or R0was
165 mg and thus was remarkably smaller than that of rhizome. The maximum cumulative length of R0 per
shoot was 38.5 cm (Table 2).
R0 biomass was 522.1 ± 101.2 mg·plant−1 by June 22,
2014 and then 775.4 ± 206.7 mg·plant−1 by August 28, 2014; it was relatively constant before the shoot sprouting in the spring of the next year. However, after shoot sprout-ing, R1 (R0 in 2014) biomass sharply decreased to
284.6 ± 88.5 mg·plant−1on April 26, 2015. This value was similar to that of R2(260.7 ± 60.2 mg·plant−1) (R1in 2014)
(260.7 ± 60.2 mg·plant−1; Fig. 4). After April 26, 2015, R1
biomass was constant or slightly deceased. The pattern of changes in rhizome thickness (dry weight/rhizome length) was similar to that of rhizome biomass. However, the root’s biomass was small from June to August of the first year; it strongly increased before shoot sprouting the next year and continuously decreased thereafter. The root/rhizome dry weight ratio increased until the early growth season of next year and was almost constant thereafter. In 2015, root and shoot systems dry weights were 93.8 ± 33.9 and 758.8 ± 211.1 mg·plant−1on March 16, 2015 (before shoot sprouting) and 91.0 ± 28.8 and 284.6 ± 88.5 mg·plant−1on April 26, 2015 (after shoot sprouting), respectively (Table 3). The total dry weight of a plant (root system + shoot system) was smaller than before shoot sprouting (Fig. 5).
In the middle of the growth season (June 22, 2014), the most CC (correlation coefficient) values between the R (R0
and R1) and the shoot system size were over 0.4 and
significant at 0.1% level (Table 4). Thus, leaf size was a proper indicator for estimating of the total plant size. The largest CC value was 0.753 between dry weight of R0and
that of leaves (Fig. 6).
Relationships between the number and the properties of leaves
P. humilehad a shoot (or a stem) on a R1and there were
from the plants with 3 leaves (3-L plant) to the plants with 11 leaves (11-L plant). For the 11 plant properties–the
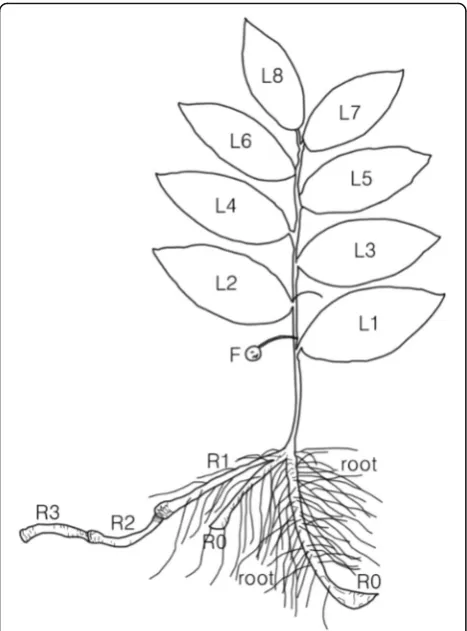
Fig. 3Schematic diagram ofP. humilemorphology.R,L, andFwere rhizome, leaf, and fruit, respectively. R0, R1, R2and R3were rhizomes grown in this year (2014), last year (2013), the year before last (2012), and 3 years ago (2011), respectively
Table 1The number and rate of rhizomes newly germinated from a shoot
Number of rhizome
1 2 3 Total
Rate (number) 16.5% (118) 28.1% (201) 56.2% (395) 100% (715)
Table 2Maximum values of each property inPolygonatum
humile’s root system grown per year (a rhizome means section
grown for a year)
Property Value
Length of a rhizome 25.5 cm
Total length of rhizomes grown from a shoot 38.5 cm
Dry weight of a rhizome 1262 mg
Total dry weight of rhizomes grown from a shoot 1540 mg
Dry weight of roots on a rhizome 163 mg
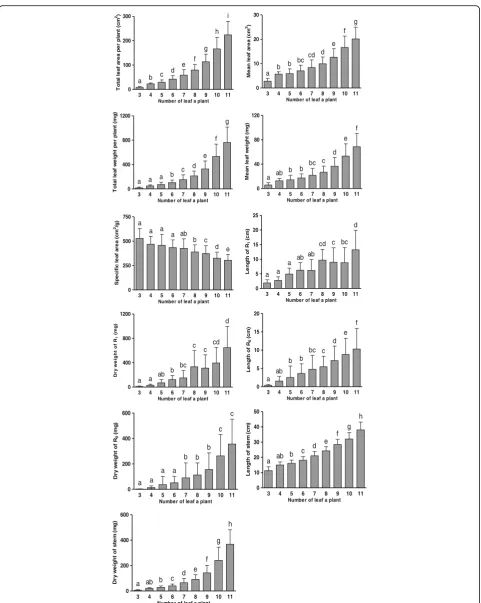
total leaf area and dry weight per stem, mean leaf area and dry weight per leaf, specific leaf area (SLA), length and dry weight of R0 and R1, length and dry weight of stem–
assessed on June 22, 2014, all values increased with the number of leaves except for SLA (Fig. 7). Moreover, an increment of only one leaf resulted in a conspicuous increase in organ property values. Of the total 9 steps from 3-L plant to 11-L plant, the maximum number of steps with the difference in values of plant properties between two leaf type plants significant at 1% level was 9 for total leaf area per stem. Significant differences at 1%
level were revealed at the 8 steps for stem length and weight and at 7 steps for the total leaf weight per stem and mean leaf area. Thus, the values of these five proper-ties conspicuously increased with the increase in leaf number. Significant differences at 1% level were observed at 4 steps for R1weight and length and at 3 steps for R0
weight, so these three properties were loosely related to leaf number. Of the 11 properties, only SLA decreased with the increase in leaf number. SLA significantly dif-fered at 1% level at 5 steps, and no significant differences in SLA were found in plants that had < 7 leaves.
Jun Jul Aug Mar Apr May 0
200 400 600 800 1000
2014 2015
Rhizome(R0-R1) Rhizome(R1-R2)
22 25 28 16 26 10
R1 R
2 R0
R1
)
g
m(
t
h
gi
e
w
yr
d
e
m
oz
i
h
R
Jun Jul Aug Mar Apr May 0
20 40 60 80
2014 2015
Rhizome(R0-R1)
Rhizome(R1-R2)
22 25 28 16 26 10
R1
R2 R0
R1
)
m
c/
g
m(
ht
g
n
el
ti
n
u r
e
p t
h
gi
e
w
yr
d
e
m
ozi
h
R
Jun Jul Aug Mar Apr May 0
50 100 150
2014 2015
Rhizome(R0-R1)
Rhizome(R1-R2)
22 25 28 16 26 10
R1
R2 R0
R1
)
g
m(
t
h
gi
e
w
yr
d t
o
o
R
Jun Jul Aug Mar Apr May 0
300 600 900 1200
2014 2015
Rhizome(R0-R1) Rhizome(R1-R2)
22 25 28 16 26 10
R1 R
2 R0
R1
)
g
m(
t
h
gi
e
w
yr
d l
at
o
T
Jun Jul Aug Mar Apr May 0
10 20 30 40
2014 2015
Rhizome(R0-R1)
Rhizome(R1-R2)
22 25 28 16 26 10 R1
R2
R0
R1
me
ts
ys
t
o
or
/ t
o
or
f
o
et
a
R
Fig. 4Changes of the length, the dry weight and thickness of rhizome, root dry weight, total root system (root + rhizome) dry weight and the root/root system dry weight ratio from June 22, 2014 to May 28, 2015.Barsindicate the standard deviation
Table 3Dry weight of each plant organ inPolygonatum humilepopulation (unit; mg)
Date Number Root system Leaf Stem Shoot system
Mar. 16, 2015a 40 852.6 ± 262.5
Apr. 26, 2015b 68 375.6 ± 131.9 286.6 ± 77.2 96.2 ± 33.2 382.8 ± 100.4
a
Before theP. humileshoot appearance on the ground
b
Changes in four properties along the leaf rank on a stem and the number of leaves
The plants used for the leaf rank on a stem analysis were from plants with 4 leaves (4-L plant) to 11 leaves (11-L plant). Of these plants, I considered 11-L plant as the most reliable indicator to show the standard character (Fig. 8). For 11-L, two types of changes in four leaf prop-erties along the leaf rank on a stem from L1(the first leaf
on a stem) to L11 (the 11th leaf on a stem) were
observed, one producing a regular curve and the other one an irregular curve. In the former case, the values first increased and then decreased, with the maximum at L2 (the second leaf on a stem) for relative leaf area, L4
(the fourth leaf on a stem) for relative dry weight and L4
and L5 (the fifth leaf on a stem) for SLA. The curve
showed the positive skewness. Of the 55 leaf pairs of the relative leaf area, the differences between the 2 leaves on a stem were significant at 0.1% in 39 and at 1 ~ 5% level in 4. For relative dry weight, the differences were signifi-cant at the 0.1% level in 20 leaf pairs and at 1–5% level in 18 leaf pairs. However, for SLA the differences almost reached significance at 5% level in 25 leaf pairs. The latter irregularly fluctuated and was the leaf length/width ratio. Of the 55 leaf pairs, the differences between the 2
leaves on a stem were significant only at the 5% in four leaf pairs. In plants with leaves ≤ 10, two types of changes in leaf properties along the leaf rank on a stem were observed. For the leaf length/width ratio, the values along the leaf rank on a shoot showed normal distribu-tion curve in plants with 3–8 leaves and fluctuated in plants with 9 or 10 leaves. However, the differences between the 2 leaves on a stem were not significant for most properties. For the other three properties, the locus of leaf showing the maximum value moved to the L1
direction with the decrease in the total number of leaves a stem. In other words, in plants with more leaves, the leaves with the maximum values were located further from L1than in plants with fewer leaves. Moreover, with
the increase in the number of leaves per plant, the differ-ences between the 2 leaves on a stem increased and their significance at 0.1% level increased. For example, for the relative leaf area of a 5-L plant, the number of relation-ships showing significant difference at 0.1% level was 1 of 12 leaf pairs; however, it was 12 of 28 leaf pairs in a 7-L plant and 26 of 38 leaf pairs in a 9-L plant. However, the numbers of leaf pair in which the difference was significant at 0.1% level were dissimilar to each other among the three properties for the same leaf plants. In the plants with a small number of leaves (4 to 7 leaves), leaf properties changed along the leaf rank on a stem; however, the patterns of these changes were irregular and most of the difference was not significant.
Discussion
In northern temperate deciduous forest, understorey perennial herbs receive little sunlight because they are shaded by the canopy (Embrog 1998, Whingham 2004). Thus, these plants should respond and acclimate to a low-light environment. In this environment, gap provides a good refuge for these plants (Kem et al. 2013). In this study, a P. humile population showed a morphological diversity for sunlight. First,P. humile’s rhizome grew up to 25.5 cm in length. This is in contrast to the data of Choung (1991), who reported that the maximal growth of
P. humile’s rhizome was 9.2 cm under nearly full sunlight. Thus, the growth ofP. humilerhizome was longer at this study site than in other study. This strategy might be the means to avoid shade and is in clonal plants (Gao et al. 2012). Moreover, the number of P. humile’s rhizomes generated on a shoot was 1–3 in most plants, rather than 2–4 by Jang (2002). In general, foraging of rhizome is observed in environment with nutrient resource hetero-geneity (Dong and Alaten 1999). Second, the shoots ofP. humilesprouted in spring using root system energy. Thus, root system biomass decreased in accordance with shoot sprouting. In this study, root system dry weight decreased to 44% (375.6 ± 131.9 mg·plant−1on April 26, 2015 and 852.6 ± 262.5 mg·plant−1 on March 16, 2015) after the 0
300 600 900 1200
***
*
root rhizome stem leaf total
March 16 April 26
)
g
m(
t
h
gi
e
w
yr
D
Fig. 5Dry weight of each organ before (March 16) and after (April 26) the shoot sprouting.Barindicates standard deviation. *** Significant at 0.1% level in difference between dry weights of rhizome on March 16 and April 26
Table 4Correlation coefficients between the rhizome and shoot system inPolygonatum humilepopulation. R1and R0are the last year rhizome and this year one, respectively. Number is samples (n). All correlation coefficients are significantly different at an 1% level
Rhizome Shoot system Number
Length of stem
Weight of stem
Total weight of shoot
Length of R1 0.3171 0.2583 0.2814 263
Weight of R1 0.5420 0.5683 0.5946 263
Length of R0 0.4947 0.4017 0.5201 51
shoot sprouted. Moreover, rhizome dry weight decreased to 37% (from 758.8 ± 211.1 to 284.6 ± 88.5 mg·plant−1) after shoot sprouting. The total dry weight of a plant (root system + shoot system) was smaller than before shoot sprouting. This result indicates considerable energy expenditure for respiration during shoot sprouting. It may be impossible for the same rhizome to produce shoots twice because of insufficient energy. No shoots were found on R2(rhizome that developed 2 years ago) or R3
(rhizome that developed 3 years ago) which attached to R1(Hasegawa and Kudo 2005). Under optimal conditions,
offspring production does not depend on the “starting capital” in the hibernacle; but under growth-limiting conditions, a thick hibernacle may be more successful in
Helianthus x latifolius (Verburg et al. 1996). Third, the size of each plant organ increased with the number of
leaves per plant and the difference corresponding to a one-leaf increment was significant at 1–5% level. Thus, the number of leaves was a good indicator of plant size. Although rhizome size increased with the number of leaves, most differences were not significant; in particular, plants with a small number of leaves (3 to 7 leaves) showed no significant differences, likely because small plants could not fully receive sunlight like the larger plants. The reason for this inference was that small plants had low SLA values and, as a result, grew more slowly than large plants. As expected, plants with many leaves were taller than plants with fewer leaves. Thus,P. humile
appears to sense and to respond to microclimate. Fifth, the CC values between rhizome and shoot sizes were significant at 1% level. In general, organic matter is transported from R1 to the stem and leaves, whereas
0 10 20 30 40 50
0 100 200 300 400
r = 0.3095
Length of R1 (mm)
m
c(
a
er
a
f
a
e
L
2)
0 10 20 30 40 50
0 500 1000 1500
r = 0.2900
Length of R1 (mm)
)
g
m(
f
a
el
f
o
t
h
gi
e
w
yr
D
0 500 1000 1500 2000
0 100 200 300 400
r = 0.5889
Dry weight of R1 (mg)
m
c(
a
er
a
f
a
e
L
2)
0 500 1000 1500 2000
0 500 1000 1500
r = 0.6038
Dry weight of R1 (mg)
)
g
m(
f
a
el
f
o
t
h
gi
e
w
yr
D
0 100 200 300 400
0 10 20 30 40 50
r = 0.5639
Leaf area (cm2)
R
f
o
t
h
g
n
e
L
0
)
m
m(
0 500 1000 1500
0 10 20 30 40 50
r = 0.6384
Dry weight of leaf (mg)
R
f
o
t
h
g
n
e
L
0
)
m
m(
0 100 200 300 400
0 500 1000 1500 2000
r = 0.6535
Leaf area (cm2)
R
f
o
t
h
gi
e
w
yr
D
0
)
g
m(
0 500 1000 1500
0 500 1000 1500 2000
r = 0.7535
Dry weight of leaf (mg)
R
f
o
t
h
gi
e
w
y
r
D
0
)
g
m(
3 4 5 6 7 8 9 10 11 0
100 200 300
a b c d e
f g
h i
Number of leaf a plant
m c( t n al p r e p a er a f a el l at o T 2)
3 4 5 6 7 8 9 10 11
0 10 20 30 a b b bc cd d e f g
Number of leaf a plant
m c( a er a f a el n a e M 2)
3 4 5 6 7 8 9 10 11
0 400 800 1200
a a a b c d
e f
g
Number of leaf a plant
) g m( t n al p r e p t h gi e w f a el l at o T
3 4 5 6 7 8 9 10 11
0 40 80 120
a ab b b bc c
d e
f
Number of leaf a plant
) g m( t h gi e w f a el n a e M
3 4 5 6 7 8 9 10 11
0 250 500 750 a a a a ab b c d e
Number of leaf a plant
m c( a er a f a el ci fi c e p S 2/g)
3 4 5 6 7 8 9 10 11
0 5 10 15 20 25 a a a ab ab cd c bc
d
Number of leaf a plant
R f o ht g n e L 1 ) m c(
3 4 5 6 7 8 9 10 11
0 400 800 1200
a a ab b bc
c c
cd d
Number of leaf a plant
R f o t h gi e w y r D 1 ) g m(
3 4 5 6 7 8 9 10 11
0 5 10 15 20 a ab b b bc c d e f
Number of leaf a plant
R f o ht g n e L 0 ) m c(
3 4 5 6 7 8 9 10 11
0 200 400 600 a a a a b b b c c
Number of leaf a plant
R f o t h gi e w yr D 0 ) g m(
3 4 5 6 7 8 9 10 11
0 10 20 30 40 50
a ab b c d
e f
g h
Number of leaf a plant
) m c( m et s f o ht g n e L
3 4 5 6 7 8 9 10 11
0 200 400 600
a ab b c d e
f g
h
Number of leaf a plant
) g m( m et s f o t h gi e w yr D
photosynthetates are transported from leaves to R0. Thus,
rhizome and shoot are closely related. In general, the leaf area is used to estimate of photosynthetic productivity, possibly because, in the field, the amount of sunlight received by each leaf affects leaf dry weight and direct sunlight induces leaf thickening and reduces the SLA (Ferreira et al. 2013). As mentioned above, SLA values were smaller in tall plants than in short plants because the former received more sunlight than the latter. SLA is a good indicator for recipient sunlight gradient (Dwyer et al. 2014) and leaf weight might change according to cumula-tive sunlight exposure. Finally, in plants with the same number of leaves, the values of four leaf properties first increased and then decreased along the leaf rank on a
stem. However, the curves fluctuated slightly in plants with a small number of leaves. This fact indicates that the properties of leaves at the same node are diverse in small plants due to variation in the amount of received sunlight. In 11-L plant, leaf area, SLA, and dry weight increased from the L1to L2or L3or L4and, thereafter, decreased to
L11. Differences of leaf properties between the 2 leaves on
a stem were significant for most at 0.1–1% level. From the leaf with the maximum value, the higher the leaf position, the less the SLA and the area values were. Thus, changes in these properties could be an adaptation to variations in sunlight. I believe thatP. humilepopulation examined had a good strategy for adaptation by avoiding the shade (Hasegawa and Kudo 2005). Woody plant leaves in
1 2 3 4 5 6 7 8 9 10 11 0 1 2 3 4 7-leaf plant 5-leaf plant 9-leaf plant 11-leaf plant Leaf rank f a el f o ht di w / ht g n el f o et a R
1 2 3 4 5 6 7 8 9 10 11 0.0 0.4 0.8 1.2 7-leaf plant 5-leaf plant 9-leaf plant 11-leaf plant Leaf rank a er a f a el e vit al a e R
1 2 3 4 5 6 7 8 9 10 11 0.0 0.5 1.0 1.5 7-leaf plant 5-leaf plant 9-leaf plant 11-leaf plant Leaf rank t h gi e w yr d f a el e vit al a e R
1 2 3 4 5 6 7 8 9 10 11 0 100 200 300 400 500 7-leaf plant 5-leaf plant 9-leaf plant 11-leaf plant Leaf rank m c( a er a f a el cif i c e p S 2 ) g/
1 2 3 4 5 6 7 8 9 10 0.0 0.4 0.8 1.2 6-leaf plant 4-leaf plant 8-leaf plant 10-leaf plant Leaf rank a er a f a el e vit al a e R
1 2 3 4 5 6 7 8 9 10 0 1 2 3 4 6-leaf plant 4-leaf plant 8-leaf plant 10-leaf plant Leaf rank f a el f o ht di w / ht g n el f o et a R
1 2 3 4 5 6 7 8 9 10 0.0 0.5 1.0 1.5 6-leaf plant 4-leaf plant 8-leaf plant 10-leaf plant Leaf rank t h gi e w yr d f a el e vit al a e R
1 2 3 4 5 6 7 8 9 10 0 100 200 300 400 500 6-leaf plant 4-leaf plant 8-leaf plant 10-leaf plant Leaf rank m c( a er a f a el cif i c e p S 2 ) g/
temperate deciduous forest show heteromorphism along the leaf rank on a new twig, although the time needed for the growth from the L1 to the last leaf is
short and each leaf might grow under the same sunlight conditions (Min 1995). P. humile leaves on a stem almost grew at the same time, so microenvironment might similarly affect all leaves. Thus, plant leaf might show diverse morphology with leaf rank on a stem or a twig under similar microenvironments.
Conclusions
Relationships between the root and the shoot’s systems Root system’s biomass decreased in accordance with shoot sprouting and this resulted from considerable energy expenditure for respiration during shoot sprout-ing. Moreover, the CC values between rhizome and shoot sizes were significant at 1% level. Thus, rhizome and shoot are closely related. The growth of P. humile
rhizome was longer at this study site than in others. This strategy of clonal plants might be the means to avoid shade in a forest gap.
Relationships between the number and the properties of leaves
The size of each plant organ increased with the number of leaves per plant, and the difference corresponding to a one-leaf increment was significant at 1–5% level. Thus, the number of leaves was a good indicator of the plant size. Although rhizome size increased with the number of leaves, most differences were not significant, likely because small plants could not fully receive sunlight like the larger plants. The reason for this inference was that small plants had low SLA values and, as a result, grew more slowly than large plants.
Changes in four properties along the leaf rank on a stem and the number of leaves
For 11-leaf plants, two types of changes in four leaf properties along the leaf rank on a stem from L1to L11
were observed, one producing a regular curve and the other one an irregular curve. In the former case, the values first increased and then decreased along the leaf rank. There were relative leaf area, relative dry weight, and SLA in these properties. In the latter case, the value irregularly fluctuated along the leaf rank and was the leaf length/width ratio. Thus, changes in the leaf sizes showed a regular trend along the leaf rank on a stem. However, change of leaf morphology along the leaf rank on a stem was irregular.
Abbreviations
(3 ~ 12)-L:(3 ~ 12)-leaf plant; a.s.l.: Above sea level; CC: Correlation coefficient; L(1~12): Leaf’s ordinal number on a stem; R0: New (this year) rhizome;; R1: The last year’s rhizome; R2: 2 years ago rhizome; R3: 3 years ago rhizome; SLA: Specific leaf area
Acknowledgements Not applicable.
Funding Not applicable.
Availability of data and materials
The datasets analyzed during the current study are directly available from the fields (a natural population ofP. humile), as mentioned in“Methods”section.
Ethics approval and consent to participate Not applicable.
Consent for publication Not applicable.
Competing interests
The author declares that he has no competing interests.
Publisher’s Note
Springer Nature remains neutral with regard to jurisdictional claims in published maps and institutional affiliations.
Received: 22 February 2017 Accepted: 2 August 2017
References
Choung, Y.-S. (1991). Growth characteristics and demography ofPolygonatum involucratumandPolygonatum humileramet population.Korean J Ecol, 14, 305–316. Cook, R. E. (1983). Clonal plant population.American Scientist, 71, 244–253. Dong, M., & Alaten, B. (1999). Clonal plasticity in response to rhizome severing
and heterogeneous resource supply in the rhizomatous grassPsammochloa villosain an inner Mongolian dune, China.Plant Ecology, 141, 53–58. Dwyer, J. M., Hobbs, R. J., & Mayfield, M. M. (2014). Specific leaf area responses to
environmental gradients through space and time.Ecology, 95, 399–410. Emborg, J. (1998). Understorey light conditions and regeneration with respect to
the structural dynamics of a near-natural temperature deciduous forest in Denmark.Forest Ecology and Management, 106, 83–95.
Ferreira, G. N., Prado Jr., J. A., Schiavini, I., & Melo, C. (2013). Plastic responses in tree architecture and specific leaf area ofXylopia aromaticaAnnonacea: Adaptations to environments with different light intensities.Braz J Bot, 36, 279–283. Gao, Y., Xing, F., Jin, Y., Nie, D., & Wang, Y. (2012). Foraging responses of clonal
plants to multi-patch environmental heterogeneity: Spatial preference and temporal reversibility.Plant and Soil, 359, 137–147.
Hasegawa, T., & Kudo, G. (2005). Comparisons of growth schedule, reproductive property and allocation pattern among three rhizotomousPolygonatum species with reference to their habitat types.Plant Species Biology, 20, 23–32. Ishioka, R., Muller, O., Hiura, T., & Kudo, G. (2013). Responses of leafing
phenology and photosynthesis to soil warming in forest-floor plants.Acta Oecologia, 51, 34–41.
Jang, C.-C. (2002). A taxonomic review of KoreanPolygonatum(Ruscaceae). Korean Journal of Plant Taxonomy, 32, 417–447.
Jang, K. H., Park, J. M., Kang, J. H., & Lee, S. T. (1998). Growth and flowering characteristics ofPolygonatumspp.J Medicinal Crop Sci, 6, 142–148. Kern, C. C., Montgomery, R. A., Reich, P. B., & Strong, T. F. (2013). Canopy gap size
influences niche portioning of the ground-layer plant community in a northern temperate forest.Journal of Plant Ecology, 6, 101–112. Klinkhamer, P. G. L., de Jong, T. M., & Meelis, E. (1990). How to test for
proportionality in the reproductive effort of plants.Amer Natl, 135, 291–300. Lee, T. B. (2003).Coloured flora of Korea(p. 676). Seoul: Hyangmoon.
Legner, N., Fleck, S., & Leuschner, C. (2013). Low light acclimation in five temperate broad-leaved tree species of different successional status: The significance of a shade canopy.Annals of Forest Science, 70, 557–570. Min, B. M. (1995). Growth and heteromorphism of leaves along the leaf rank
(plastochron) of woody plants.J Plant Biol, 38, 63–72.
Seo, Y.-S., Park, W.-H., & Cha, Y.-Y. (2011). Effect ofPolygonatum odoratumon lowering lipid and antioxidation.J Oriental Rehab Med, 21, 49–62. Verburg, R. W., Kwant, R., & Werger, M. J. A. (1996). The effect of plant size on
vegetative reproduction in a pseudo-annual.Vegetatio, 125, 185–192. Whigham, D. F. (2004). Ecology of woodland herbs in temperate deciduous