R E S E A R C H
Open Access
Genome-wide identification of RNA editing
in seven porcine tissues by matched DNA
and RNA high-throughput sequencing
Yuebo Zhang, Longchao Zhang
*, Jingwei Yue, Xia Wei, Ligang Wang, Xin Liu, Hongmei Gao, Xinhua Hou,
Fuping Zhao, Hua Yan and Lixian Wang
*Abstract
Background:RNA editing is a co/posttranscriptional modification mechanism that increases the diversity of transcripts, with potential functional consequences. The advent of next-generation sequencing technologies has enabled the identification of RNA edits at unprecedented throughput and resolution. However, our knowledge of RNA editing in swine is still limited.
Results:Here, we utilized RES-Scanner to identify RNA editing sites in the brain, subcutaneous fat, heart, liver, muscle, lung and ovary in three 180-day-old Large White gilts based on matched strand-specific RNA sequencing and whole-genome resequencing datasets. In total, we identified 74863 editing sites, and 92.1% of these sites caused adenosine-to-guanosine (A-to-G) conversion. Most A-to-G sites were located in noncoding regions and generally had low editing levels. In total, 151 A-to-G sites were detected in coding regions (CDS), including 94 sites that could lead to nonsynonymous amino acid changes. We provide further evidence supporting a previous observation that pig transcriptomes are highly editable at PRE-1 elements. The number of A-to-G editing sites ranged from 4155 (muscle) to 25001 (brain) across the seven tissues. The expression levels of the ADAR enzymes could explain some but not all of this variation across tissues. The functional analysis of the genes with tissue-specific editing sites in each tissue revealed that RNA editing might play important roles in tissue function. Specifically, more pathways showed significant enrichment in the fat and liver than in other tissues, while no pathway was enriched in the muscle.
Conclusions:This study identified a total of 74863 nonredundant RNA editing sites in seven tissues and revealed the potential importance of RNA editing in tissue function. Our findings largely extend the porcine editome and enhance our understanding of RNA editing in swine.
Keywords:ADAR, A-to-G, High-throughput sequencing, RNA editing, Swine
Background
In the 1980s, Benne et al. discovered an RNA editing event in which four nonencoded nucleotides were inserted into the mRNA of the mitochondrial cyto-chrome oxidase subunit II (coxII) gene in trypanosoma-tids [1]. Subsequently, RNA editing was defined as a co/ posttranscriptional modification mechanism that alters sequence information at the RNA level by introducing differences between a final RNA sequence and its
template DNA through the insertion, deletion or substi-tution of nucleotides [2]. This modification can occur in coding regions (CDS) and noncoding regions, thereby recoding amino acids, affecting alternative splicing, influencing RNA stability, and modulating the nuclear retention of RNAs [3, 4]. In mammals, adenosine-to-inosine (A-to-I) editing catalyzed by adenosine deami-nases acting on RNA (ADAR) is the most common type of RNA editing [5, 6]. As inosine is generally read as guanosine (G) by the cellular machinery, A-to-I editing is also named A-to-G editing. The ADAR enzyme family, which primarily includes three members (ADAR1,
* Correspondence:[email protected];[email protected]
Key Laboratory of Animal (Poultry) Genetics Breeding and Reproduction, Ministry of Agriculture; Institute of Animal Science, Chinese Academy of Agricultural Sciences, Beijing 100193, China
ADAR2 and ADAR3), targets only double-stranded RNA to catalyze A-to-G RNA editing [7]. Both ADAR1 and ADAR2 are essential for normal development, and a homozygous null mutation in either of these two genes causes early lethality in mice [8,9].
The identification of RNA editing sites heavily depends on sequencing technologies. Therefore, RNA edits were originally regarded as rare variants due to the limitations of sequencing technologies [10]. The advent of next-generation sequencing (NGS) technologies has en-abled the identification of transcriptome-wide RNA edit-ing events across individuals and tissues at unprecedented throughput and resolution. Subsequently, the discovery rate of RNA editing sites has dramatically increased. With the development of bioinformatics tools designed for RNA editing detection and the significant decline in se-quencing costs, RNA editing studies are ushering in an unprecedented opportunity. Currently, RNA editing stud-ies are widely implemented in humans and mice by com-paring matched RNA and DNA sequencing data or using only RNA sequencing (RNA-seq) data [11–19]. Moreover, separate laboratories have reported the potentially bio-logical significance of RNA editing in disease pathobiology and tumorigenicity [20,21], introducing a new regulatory layer to enhance our understanding of complex diseases. Pigs are considered an ideal animal model of human dis-eases since they share similar anatomic and physiologic characteristics with humans. Therefore, RNA editing stud-ies involving pigs can promote an understanding of the molecular basis of human diseases. However, to the best of our knowledge, only one research study, which identi-fied 5294 nonredundant A-to-G sites across three tissues from one pig, has provided information about RNA edit-ing at a transcriptome-wide level in pigs [22]. Our know-ledge of RNA editing in pigs is very limited compared to that in humans and other model species.
Given the significance of pigs in biomedical research and animal husbandry, we systematically detected and characterized the RNA editome in pigs based on strand-specific RNA sequencing data and whole-genome sequencing data of the brain, fat, heart, liver, lung, muscle and ovary from three 180-day-old Large White gilts. We revealed a total of 74863 RNA editing sites and imple-mented a detailed characterization of the sequence and distribution features of these sites. We found frequent oc-currence in noncoding regions, especially PRE-1, provid-ing further evidence supportprovid-ing a previous observation that pig transcriptomes are highly editable in PRE-1 ele-ments. Furthermore, the functional analysis of the genes with tissue-specific editing sites in each tissue revealed the potential functional importance of RNA editing in porcine tissue regulation. Our study largely extends the list of RNA editing sites in swine and provides deeper insight into the characteristics of the pig editome.
Methods
Sample collection and nucleic acid isolation
The frontal lobe of the brain, tip of the heart, left lateral lobe of the liver, caudal lobe of the left lung,Longissimus dorsi(the 10-11thrib, muscle), follicles and surrounding tissue of the ovary, and shoulder subcutaneous fat were collected from three 180-day-old Large White gilts (Table1and Additional file1: Figure S1), snap frozen in liquid nitrogen and stored at−80 °C until use. The gen-omic DNA was extracted from the muscle samples by using the standard phenol-chloroform protocol. The total RNA was isolated using TRIzol reagent (Invitrogen, Carlsbad, CA, USA) according to the manufacturer’s in-structions. Only DNA samples with OD 260/280 ratios of 1.8~2.0 and total contents greater than 1.5μg were used in the subsequent steps. RNA samples with RNA integrity number (RIN) scores higher than seven were used in this study.
Strand-specific transcriptome sequencing
Three micrograms of total RNA per sample were used for the subsequent creation of strand-specific RNA-seq librar-ies. In total, 21 strand-specific sequencing libraries were generated using mRNA purified from total RNA using oli-go(dT) beads by NEBNext® Ultra™Directional RNA Library Prep Kit for Illumina® (NEB, USA) following the manufac-turer’s protocol. After qualification by an Agilent 2100 Bioanalyzer and real-time PCR, each library preparation was sequenced on an Illumina HiSeq platform by the Novogene Bioinformatics Technology Cooperation (Beijing, China), and 150 bp paired-end reads were generated.
Whole-genome sequencing
Muscle DNA was extracted from the three pigs men-tioned above and used to construct three DNA libraries (Additional file1: Figure S1). These libraries were gener-ated using a TruSeq Nano DNA HT Sample Preparation Kit (Illumina, USA) according to the manufacturer’s rec-ommendations. The quantification and quality of the se-quencing libraries were assessed by real-time PCR and an Agilent Bioanalyzer 2100 system. Then, each library constructed above was sequenced on an Illumina HiSeq platform provided by the Novogene Bioinformatics Technology Cooperation (Beijing, China), and 150 bp paired-end reads were generated for further analysis.
Read processing
RNA editing detection
The detection of RNA editing sites was conducted using RES-Scanner [23]. Parameters were adopted according to the author’s recommendation. The reference genome
Sus scrofa10.2.87 was downloaded from Ensembl (ftp:// ftp.ensembl.org/pub/release-87/fasta/sus_scrofa/dna/). The genomic feature position files and Sus_scro-fa.dbSNP145.gtf were prepared using custom scripts on the basis of Sus_scrofa.Sscrofa10.2.87.gtf (ftp://ftp.en sembl.org/pub/release-87/gtf/sus_scrofa/) and Sus_scro-fa.vcf (ftp://ftp.ensembl.org/pub/release-87/variation/vcf/ sus_scrofa/) following the RES-Scanner user manual.
A candidate RNA editing site must meet the follow-ing conditions: 1) the genomic site is homozygous with a Bayesian probability exceeding 0.95 and is supported by at least 10 reads; 2) at least three RNA reads differ from the genomic genotype; 3) the site has an editing level≥0.05 and must be supported by at least one RNA read in the middle of its length; 4) the binomial test false discovery rate (FDR) of this site must be < 0.05; and 5) the site is not located within homopolymeric re-gions of five or more residues and within six intronic bases of a splice site. All thresholds used for the
identification of the RNA editing sites were the default parameters of RES-Scanner.
Validation of RNA editing sites through sanger sequencing
In total, 64 editing sites randomly selected from all sites identified in Brain3 were used to assess the reliability of RES-Scanner. RNA isolated from Brain3 was used for re-verse transcription by a PrimeScript™ RT Reagent Kit (Takara, Japan) according to the manufacturer’s instruc-tions. DNA was extracted from Muscle3. The primers were designed by the National Center for Biotechnology Information (NCBI) Primer–BLAST and synthesized by Thermo Fisher Scientific Inc. (Beijing, China) to amplify appropriate fragments for Sanger sequencing (Additional file 2: Table S1). The sites were considered verified if the cDNA sequence was heterozygous while the corresponding DNA sequencing was homozygous.
Gene expression and editing level
To quantify the porcine gene expression level, Tophat2 [24] was applied with the default command options to align the RNA-seq reads against the reference genome
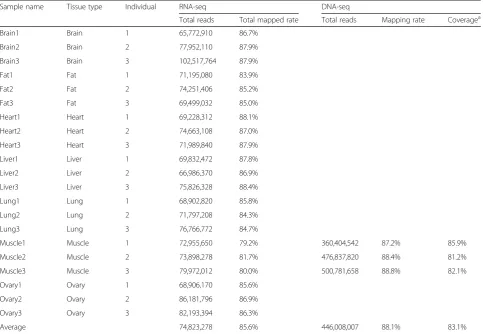
Table 1Statistics of the high-throughput sequencing
Sample name Tissue type Individual RNA-seq DNA-seq
Total reads Total mapped rate Total reads Mapping rate Coveragea
Brain1 Brain 1 65,772,910 86.7%
Brain2 Brain 2 77,952,110 87.9%
Brain3 Brain 3 102,517,764 87.9%
Fat1 Fat 1 71,195,080 83.9%
Fat2 Fat 2 74,251,406 85.2%
Fat3 Fat 3 69,499,032 85.0%
Heart1 Heart 1 69,228,312 88.1%
Heart2 Heart 2 74,663,108 87.0%
Heart3 Heart 3 71,989,840 87.9%
Liver1 Liver 1 69,832,472 87.8%
Liver2 Liver 2 66,986,370 86.9%
Liver3 Liver 3 75,826,328 88.4%
Lung1 Lung 1 68,902,820 85.8%
Lung2 Lung 2 71,797,208 84.3%
Lung3 Lung 3 76,766,772 84.7%
Muscle1 Muscle 1 72,955,650 79.2% 360,404,542 87.2% 85.9%
Muscle2 Muscle 2 73,898,278 81.7% 476,837,820 88.4% 81.2%
Muscle3 Muscle 3 79,972,012 80.0% 500,781,658 88.8% 82.1%
Ovary1 Ovary 1 68,906,170 85.6%
Ovary2 Ovary 2 86,181,796 86.9%
Ovary3 Ovary 3 82,193,394 86.3%
Average 74,823,278 85.6% 446,008,007 88.1% 83.1%
a
(Sus scrofa10.2.87). Then, HTseq [25] was used to count the reads aligned to each gene. Finally, fragments per kilobase million (FPKM), which is currently the most commonly used method for estimating gene expression levels [26], was calculated based on the length of the gene and the number of reads mapped to this gene. The RNA editing level at a given site was calculated as the ratio of reads supporting the edited base to the total number of reads covering the site. The editing level ana-lysis was limited to RNA editing sites covered by at least 10 RNA reads.
Functional enrichment analysis
We used the clusterProfiler package [27] to conduct a functional enrichment analysis based on Gene Ontology (GO) biological processes and Kyoto Encyclopedia of Genes and Genomes (KEGG) pathway terms. Human gene sets were chosen as the background. GO/KEGG terms withq-value < 0.05 were considered significantly enriched.
Results
Identification of RNA editing sites in swine
To accurately detect the candidate RNA editing sites at the transcriptome-wide level in swine, strand-specific poly(A)-positive RNA sequencing and matched DNA se-quencing were performed using seven tissues from three pigs. After quality trimming, on average, 74.8 million reads were generated from each sample, with an average mapping rate of 85.6%. Approximately 88.1% of the 1338 million pass-filter reads obtained from the DNA sequen-cing were successfully aligned to theSus scrofareference genome. A summary of the deep sequencing process is provided in Table1.
To fully utilize our sequencing data, the possible RNA editing events were detected with RES-Scanner, which re-quires matched RNA-seq and DNA-seq data to rule out genomic single nucleotide variants and automatically sep-arates the plus-strand alignments from the minus-strand alignments for the strand-specific RNA-seq libraries to identify the correct genomic loci of origin. Using this method, in total, 163315 RNA editing events at 74863 sites were detected within our datasets (edited sites in dif-ferent tissues or animals were considered separate events), including 68934 A-to-G editing sites (Additional file 3: Table S2).
Validation of predicted RNA editing sites
First, we used an in silico approach as previously re-ported [28] to search for evidences of the detected RNA editing sites in porcine expressed sequence tags (ESTs) of NCBI. In brief, 50 bp upstream and 50 bp downstream of the flanking regions of the RNA editing sites were ex-tracted and queried against the public pig ESTs using BLAST. Then, ESTs with an e-value < 10−5 were
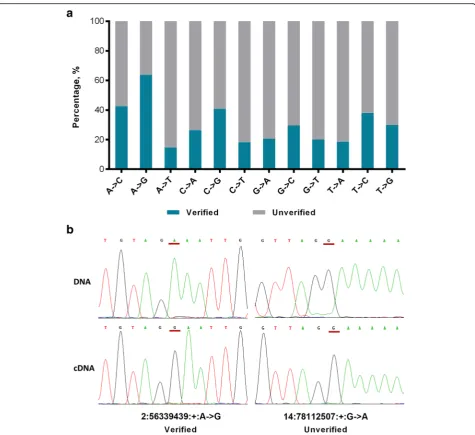
counted. Of the 74863 editing sites, 67450 (90.1%) sites were covered by at least one EST sequence, and 45243 (60.4%) sites were found in at least one RNA edited EST clone. The validation rates significantly varied across the different RNA editing types as follows: 63.7% (43901/ 68934) of the A-to-G editing sites were supported by at least one RNA edited EST sequence, while less than 43% of the RNA editing sites were validated for each of the 11 non-A-to-G types (range from 14.9% to 42.5%) (Fig.1a). Then, Sanger sequencing was carried out to experimen-tally validate 64 editing sites (47 A-to-G sites and 17 non-A-to-G sites) across five genomic feature regions comprising CDS, noncoding RNA (ncRNA) and un-translated, intronic and intergenic regions. Forty-three A-to-G sites (91.4%) and 10 other type sites (58.8%), in-cluding two C-to-A, three G-to-A and five T-to-C sites, were experimentally verified (Fig.1band Additional file
1: Figure S2). However, no known enzymes or biological mechanisms can catalyze the 10 non-A-to-G sites. Given these results, we focused on the A-to-G editing sites for further analysis.
Characterization of porcine RNA editing sites
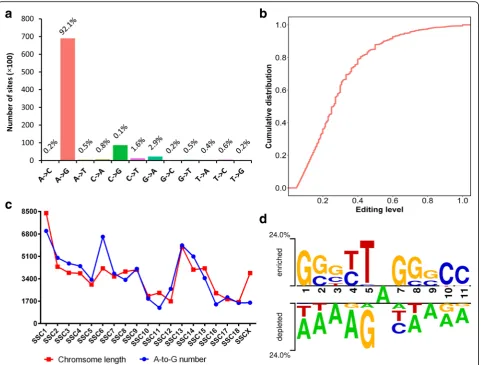
of the editing sites, which was also observed in the hu-man inosinome [14] and rhesus macaque editome [5]. To explore whether porcine RNA editing sites also oc-curred in clusters similar to humans, the sites patterning in clusters ≥3 sites within 100 bp were calculated. We found that the extent of A-to-G site clustering widely ranged across the samples (from 24.8% to 98.7%, Additional file4: Table S3). At the tissue level, the high-est rate of A-to-G site clustering was found in the fat group (87.8% on average), while the lowest rate was found in the liver group (26.9% on average). A cross-species comparative analysis was performed to
compare our detected editing sites and the human editome retrieved from the REDIportal (http:// srv00.recas.ba.infn.it/atlas/) and DARNED (https://dar ned.ucc.ie/) databases. Using 50 bp flanking regions of the porcine RNA editing sites, BLAST analyses were performed against 50 bp flanking regions of the hu-man sites. The sites supported by the ESTs with e-values <0.001, identity >85% and alignment length >50 bp were considered conserved editing sites [28]. This analysis revealed 454 conserved A-to-G sites (Additional file 5: Table S4), which is compar-able to a previous study [5].
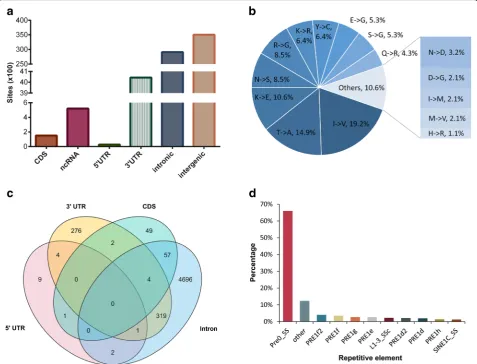
Analysis of the editing sites across genomic regions Next, we studied the location characteristics of the de-tected RNA editing sites, and the priority was consistent with ANNOVAR [29]. Interestingly, the largest fraction of A-to-G sites was located in intergenic regions, followed by introns (Fig. 3a). In total, 520 A-to-G sites were located in ncRNA, and most (89.4%) of these sites occurred in introns. Less than 6% of the A-to-G sites were located in 3′untranslated regions (UTR), including 592 sites that overlapped with the target sites of miRNA seed regions (2nd to 8thnucleotides, the key region in-volved in the recognition between a miRNA and the 3´ UTR of its target mRNA [30]) predicted by miRanda [31]. The top 20 miRNAs according to the number of edited targets are shown in Additional file 6: Table S5. Furthermore, we found that 341 of the remaining 3451 3´UTR sites potentially generated novel miRNA targets.
In addition, 151 A-to-G sites were detected in CDS, in-cluding 94 sites that could lead to nonsynonymous amino acid changes (Additional file7: Table S6). Among the 94 missense sites, 30 sites had editing evidence in all seven studied tissues, and 59 sites were detected in at least two tissues. Notably, the top three most frequent substitution types, i.e., isoleucine to valine (I-to-V), threonine to alanine (T-to-A) and lysine to glutamate (K-to-E), accounted for more than 44% of all amino acid conversions (Fig. 3b). Up to 70.2% of the missense A-to-G sites were observed at the first or second pos-ition in codons. The putative impacts of the amino acid replacements predicted by snpEff [32] demonstrated that all 94 missense variances were likely to be moderate. Only four missense sites (Chr4:98044799, Chr7:10-2789222, 8:48244993 and Chr11:22178068) have been previously identified in a single female pig from an F2
Fig. 2Characteristics of the pig editome.aDistribution of RNA editing types.bCumulative percentage distribution of the editing levels of A-to-G sites. The editing level of a given editing site is determined by the number of reads with the edited base divided by the total reads. If the same site was detected in multiple samples, the highest editing level was used in the analysis.cChromosome distribution of A-to-G sites.
population [22]. This finding might be caused by a dif-ference in breeds.
While concentrating on the distribution of A-to-G sites within a gene model, we found that 92.8% of the 5420 protein-coding genes undergoing RNA editing were edited in only one genic region (Fig. 3c). While 93.7% of the edited genes had intronic editing sites, only 7.1% of the edited genes simultaneously had intronic and other genic region editing sites. The considerable in-tronic RNA editing sites and the observation that most genes were edited in intronic regions suggested that A-to-G editing may impact splicing as previously re-ported [33]. It is universally acknowledged that in pri-mates, RNA editing sites are mostly located in Alu elements, which are categorized into short interspersed nuclear elements (SINEs). This property allowed us to understand the association between the RNA editome and repetitive elements in the pig. AnnotateTable.py
from REDItools [34] was used to determine which re-petitive elements contained the identified RNA editing sites. Consistent with previous studies [5, 22,35], 97.3% of the RNA editing sites located in the repeats were A-to-G conversions (Additional file 1: Figure S3), and 94.1% of the repetitive A-to-G sites were located in SINEs (Additional file1: Figure S4). By further subdivid-ing the repetitive element families, we found that 88.6% of the repetitive A-to-G sites occurred within the PRE-1 fam-ily, and, notably, approximately 66% of these sites oc-curred in the Pre0_SS element, which is an active pig-specific SINE belonging to the PRE-1 family (Fig.3d).
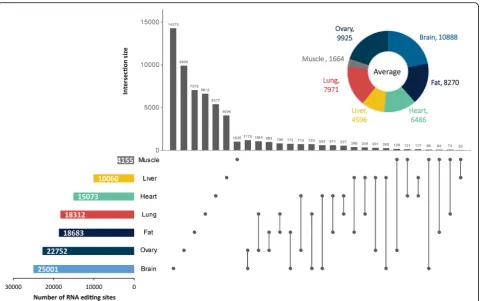
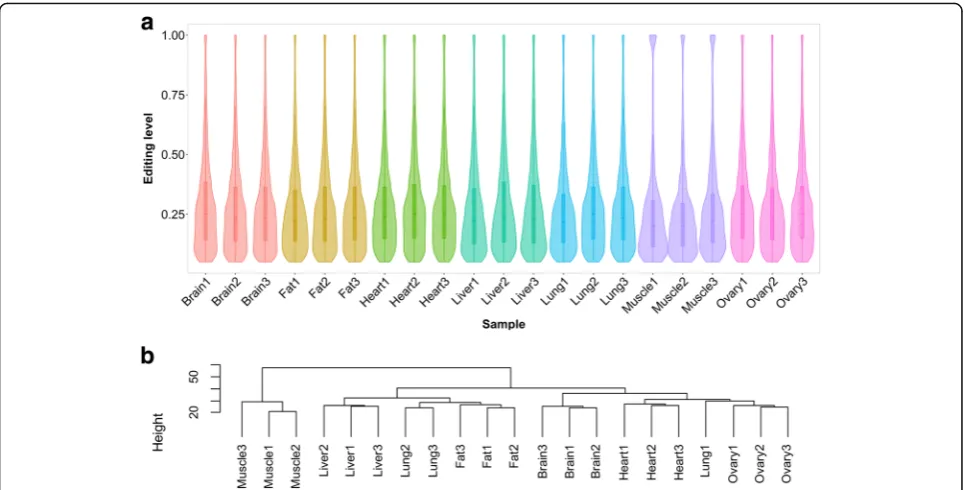
Less than 10% of the RNA editing sites were shared across the three samples of each tissue. These observations highlighted the variety and diversity of co/posttranscrip-tional modification. Overall, the brain was the most edited tissue, with an average of 10888 A-to-G sites, followed by the ovary, and the muscle had the least number of A-to-G sites (on average 1664). After removing the duplicates, the number of nonredundant RNA editing sites in the tissues ranged from 4155 to 25001. The large number of sites in each tissue suggested that RNA editing is likely function-ally important in nonbrain tissues. Unexpectedly, although an obvious difference was discovered in the number of A-to-G sites per sample, the detected sites exhibited strong comparability in editing levels, with the median level ranging from 0.2 to 0.25 (Fig.5a). According to the hierarchical clustering analysis, we further found that the interindividual variations of the editing levels were smaller than the cross-tissue variation (Fig.5b).
Interestingly, most tissue-shared sites were present in noncoding regions, especially the 3´UTR, and less than 6% of the shared sites were located in CDS. This result suggested that common RNA editing may function by regulating the expression of specific genes. While con-centrating on the tissue specificity of RNA editing, we
found that a host of A-to-G sites occurred only in spe-cific tissues (Fig. 4). This finding highlighted the strong tissue specificity of RNA editing. Therefore, we further counted the tissue-specific sites by referring to a previ-ously reported study [14]. Briefly, we mapped all de-tected A-to-G sites on the expressed genes with an FPKM > 1 and then selected tissue-specific sites from the sites in the expressed genes. Unexpectedly, the ovary, rather than the brain, had the largest number of tissue-specific editing sites (Additional file 9: Table S8). Notably, less than 10% of the tissue-specific editing sites occurred in tissue-specific expressed genes within each tissue type. To characterize the functional significance of the tissue-specific editomes, a functional enrichment ana-lysis of the genes with tissue-specific editing sites was car-ried out using the Bioconductor package clusterProfiler. As expected, these genes were significantly enriched in biological processes related to their respective tissue func-tions, such as “dendrite development” in the brain (q-value = 9.07 × 10⁻⁵), “lipid modification” in the fat (q-value = 4.98 × 10⁻⁴), “cardiac muscle cell differenti-ation”in the heart (q-value = 1.07 × 10⁻³),“carboxylic acid catabolic process” in the liver (q-value = 3.68 × 10⁻¹⁴),
“actomyosin structure organization” in the muscle (q-value = 3.28 × 10⁻²), and“cell cycle G2/M phase transi-tion” in the ovary (q-value = 2.93 × 10⁻⁸). The top 5 GO terms of each tissue according to the q-values are dis-played in Additional file1: Figure S6. Based on the path-way analysis (Fig. 6), we discovered obviously different enriched pathways among these tissues. In addition, most pathways enriched in each tissue were related to their re-spective tissue function, such as “glutamatergic synapse” in the brain (q-value = 4.33 × 10⁻²), “AMPK signaling pathway”in the fat (q-value = 3.64 × 10⁻²), and “fatty acid metabolism” (q-value = 1.21 × 10⁻³) in the liver. Specific-ally, more pathways were enriched in the fat and liver than in the other tissues, while no pathway was enriched in the muscle. Similar results were obtained even after excluding the tissue-specific expressed genes (Additional file 1: Figure S7).
Association betweenADARexpression levels and the porcine RNA editome
It is well known that A-to-G editing is catalyzed by ADAR enzymes. Hence, we investigated whether the tis-sue differences in RNA editing are related to the differ-ential expression of theADARgenes. First, we calculated the expression levels of theADAR1,ADAR2andADAR3
genes using our RNA-seq data. The total expression of theADARs is the highest in the brain, and the lowest ex-pression is in the muscle (Fig. 7). We also found that
ADAR3 was nearly exclusively expressed in the brain.
Next, we estimated the correlations between the expres-sion of the ADARs and the RNA editing site number and between the expression of the ADARs (except for
ADAR3, which is only expressed in the brain) and the global RNA editing level (summing the editing levels at all positions) at the sample level. This analysis revealed a strong and statistically significant correlation between both the number of editing sites (r= 0.89, P <0.01) and the global level of editing (r= 0.89,P< 0.01) with the ex-pression ofADAR1(Additional file1: Figure S8). Statisti-cally significant correlations were also observed for
ADAR2, but these correlations were not strong (r= 0.59 for RNA editing number;r= 0.58 for global RNA editing level). Then, by repeating this analysis at the tissue group level, statistically significant correlations were found only forADAR1 (number of editing sites:r= 0.96,
P< 0.01; global level of editing: r= 0.95, P< 0.01) (Additional file 1: Figure S9). These observations indi-cated that ADAR1 may be the primary editor of the A-to-G sites.
Discussion
widespread anti-sense expression [5,37]. Then, matched RNA and DNA sequencing was performed in porcine tissues from the same individuals, which efficiently elim-inated genetic variations compared with working with RNA-seq data alone. Finally, RES-Scanner, which is an all-in-one tool that incorporates sophisticated statistical models, was applied to effectively distinguish the real RNA editing sites from potential false positives. These efforts ensured the accuracy and quantity of the editing site identification.
Overall, we identified 74863 editing sites, which is far less than that detected in a similar survey in humans (2013010 sites) [14]. A certain proportion of this differ-ence could be attributed to the primate-specific Alu ele-ments, which are active SINE retrotransposons. We further noted that there are more editing sites in pigs Fig. 6Pathway enrichment analysis of the genes containing tissue-specific RNA editing. Dot plot of the enriched KEGG pathways in each tissue. Dot color indicates the statistical significance of the enrichment (q-value); dot size represents the fraction of genes annotated to each term
than in cows [28] and chickens [38]. The PRE-1 ele-ments are pig-specific SINE retrotransposons that pos-sess properties similar to Alu [39], and a previous study reported that RNA editing in swine is associated with PRE-1 elements [22]. Similar to the previous study, our results showed that 88.6% of the 67136 repetitive A-to-G sites occurred within the PRE-1 family. Hence, PRE-1 retrotransposons may contribute to the difference in the number of RNA editing sites between pigs and humans or other animals.
Consistent with previous studies in primates [5,6,40], > 90% of the identified sites are of the A-to-G type, which is higher than that reported in the pig in a previ-ous study (75% A-to-G changes) [22]. This indicates the high accuracy of our detection referring to the study of Porath et al. [41]. Approximately 64% of the A-to-G sites were validated by at least one EST sequence, which is consistent with studies in mice (> 55% of validation) [16] and cows (66% of validation) [28]. To understand the mechanism of target recognition, the sequence contexts of the A-to-G editing sites were analyzed. The sequence preference in pigs is similar to that in humans [42], mice [43], cows [28] and chickens [38], indicating the conver-sion of the recognition mechanism. It is well known that A-to-G sites can be grouped into clusters and that an editing cluster increases the reliability of the contained editing sites. In the present study, we found strong tissue specificity of A-to-G site clustering.
In our research, the intergenic regions contained the largest number of RNA editing sites, which is different from humans, where intronic editing sites are the most common. A possible explanation for the difference is that the porcine genome annotation is of poor quality compared with the human annotation, and many unan-notated genes are present (25322 pig genes vs 63305 human genes in Ensembl release 87). However, the abundance of RNA editing within the intronic and inter-genic regions is unexpected because our RNA-seq librar-ies were purified using oligo(dT) beads to enrich polyadenylated mRNAs that had undergone splicing. This finding could be partially attributed to intron reten-tion [44]. Moreover, SINEs may be another reason for this unexpected observation. SINEs are sequences of noncoding DNA that generally have more or less degen-erate poly(A) tails [45]. It is entirely possible that a standard oligo(dT) protocol introduces SINEs into RNA-seq libraries, increasing the reads that overlap with intronic and intergenic sequencing. We found 94 nonsy-nonymous A-to-G editing sites resulting in 15 amino acid change classes across 76 genes. Notably, a number of RNA editing sites that control I/V, Y/C and Q/R in
GRIK2,I/V inCOPA,I/V inKCNA1,T/A inACOT4,R/G inGRIA2,I/V, I/M and N/S inHTR2Cand R/G inGRIA3
have been identified in pigs in other studies [22, 46].
The three RNA editing sites in GRIK2 are consid-ered important for regulating calcium permeability [47]. For COPA, I/V editing was detected in the current seven tissues, and its hypoediting is associ-ated with hepatocellular carcinoma pathogenesis in humans [48]. The I/V recoding of KCNA1 via RNA editing affects the action potential shape, signal propagation and the firing pattern by accelerating the KCNA1 channel recovering from inactivation [49]. Consistent with previous work [22], ACOT4
was also found to be edited in fat, but the function of its editing is unknown. The R/G recoding in
GRIA2 and GRIA3 leads to faster desensitization re-covery [50]. The RNA editing in HTR2C can reduce the efficacy of the interaction between receptors and their G protein [51]. In addition to the above re-ported genes, we discovered several genes with non-synonymous A-to-G editing sites for further studies investigating the function of RNA editing.
regulation underlying complex traits in pigs. Furthermore, RNA edits provide information that has been unexplored at the DNA level. Hence, RNA edits could be integrated with SNPs and used in genome selection to improve the accuracy of breeding. In addition, given that RNA editing is dynamically regulated, RNA editing sites could be used as markers to monitor development, health and response to feed in breeding.
The ADAR enzymes have been shown to be essential for normal life and development in mice [8, 9]. Consist-ent with other mammals, three ADARs exist in pigs, in-cluding ADAR1, ADAR2 and ADAR3. Only ADAR1 and ADAR2 have been shown to be enzymatically active [58]. However, ADAR3 can inhibit RNA editing by com-petitively binding double stranded RNA [59]. Consistent with previous studies, ADAR1 and ADAR2 were highly expressed in the brain and lung, andADAR3 was exclu-sively expressed in the brain [5, 14]. Although the sam-ple distribution of the A-to-G sites was significantly and positively correlated with the expression of the ADARs, the tendency to change did not perfectly align. This ob-servation shows that the editing enzymes play an im-portant role in RNA editing regulation but cannot explain all modification.
Conclusions
This study identified 74863 RNA editing sites using matched RNA and DNA sequencing data and revealed the comprehensive profile of RNA editing in pigs. We also provide further evidence supporting a previous observa-tion that pig transcriptomes are highly editable in PRE-1 SINE elements. Furthermore, the functional analysis of the genes with tissue-specific editing sites in each tissue revealed the potentially functional importance of RNA editing in porcine tissue regulation. Our study largely ex-tends the list of RNA editing sites in swine and provides deeper insight into the characteristics of the pig editome.
Additional files
Additional file 1:Figure S1.Overview of the experimental design. Figure S2.Results of the Sanger sequencing validation of all 64 selected editing sites. For each candidate editing site (indicated by genome coordinates and red arrow), raw chromatograms of sequences derived from cDNA and matched DNA samples are shown. Unverified sites are marked with an asterisk.Figure S3.Distribution of RNA editing types in repetitive sequences.Figure S4.Distribution of A-to-G sites across major repeat families.Figure S5.Overlap of RNA editing sites among the three samples of each tissue.Figure S6.Dot plot of the top five enriched GO biological process terms in each tissue. Dot color indicates statistical significance of the enrichment (q-value); dot size represents the fraction of genes annotated to each term.Figure S7.Dot plot of the enriched KEGG pathways after removing the tissue-specific expressed genes. Dot color indicates the statistical significance of the enrichment (q-value); dot size represents the fraction of genes annotated to each term.Figure S8. RNA editing vs expression ofADARs in all samples. a) We correlated the number of A-to-G sites andADAR1expression levels in all samples
(n= 21). b) We correlated the number of A-to-G sites andADAR2 expression levels in all samples (n= 21). c) and d) We calculated the correlations between the overall RNA editing levels and the expression values ofADAR1andADAR2in all samples (n= 21). Correlation coefficients (r) andP-values are shown in each graph.Figure S9.RNA editing vs the expression ofADARs in tissue groups. a) We correlated the number of A-to-G sites andADAR1expression levels in all tissue groups (n= 7). b) We correlated the number of A-to-G sites andADAR2expression levels in all tissue groups (n= 7). c) and d) We calculated the correlations between the overall RNA editing levels and the expression values ofADAR1 andADAR2in tissue groups (n= 7). Correlation coefficients (r) andP-values are displayed in each graph. (PDF 87057 kb)
Additional file 2:Table S1.Primers used in the Sanger sequencing. (XLSX 135 kb)
Additional file 3:Table S2.RNA editing sites identified in this study. (XLSX 6798 kb)
Additional file 4:Table S3.Clustering of A-to-G sites in each sample. (XLSX 9 kb)
Additional file 5:Table S4.Conserved A-to-G editing sites between pigs and humans. (XLSX 25 kb)
Additional file 6:Table S5.Top 20 miRNAs according to the number of edited targets. (XLSX 9 kb)
Additional file 7:Table S6.A-to-G sites resulting in amino acid changes. (XLSX 13 kb)
Additional file 8Table S7.RNA editing sites shared by the seven examined tissues. (XLSX 27 kb)
Additional file 9Table S8.Statistics of the tissue-specific A-to-G editing sites. (XLSX 9 kb)
Abbreviations
ADARs:Adenosine deaminases acting on RNA; A-to-G: Adenosine-to-guanosine; CDS: Coding regions; EST: Expressed sequence tag; FPKM: Fragments per kilobase million; GO: Gene Ontology; KEGG: Kyoto Encyclopedia of Genes and Genomes; NCBI: National Center for
Biotechnology Information; ncRNA: noncoding RNA; SINE: Short interspersed nuclear element; SSC:Sus scrofachromosome; UTR: Untranslated regions
Acknowledgements
We thank the researchers at our laboratories for their dedication and hard work.We would like to thank everyone who made this thesis possible. Funding
This research was supported by the National Key Technology R&D Program of China (2015BAD03B02–2), Beijing Natural Science Foundation (6174047), earmarked fund for Modern Agro-industry Technology Research System (CARS-35), and Agricultural Science and Technology Innovation Program (ASTIP-IAS02).
Availability of data and materials
The sequencing data used in the current study are available at the Sequence Read Archive, BioProject PRJNA493166 (http://www.ncbi.nlm.nih.gov/bioproject/493166).
Authors’contributions
ZYB carried out the experiment and analysis. ZYB drafted the manuscript. ZYB, ZLC, WLG and WLX conceived and designed the experiments. All authors read and approved the final manuscript.
Ethics approval and consent to participate
All animals were sacrificed by electric shock in Beijing Fifth Meat Processing Factory according to the guidelines for experimental animals established by the Council of China. The experiments involving animals were approved by the Science Research Department of the Institute of Animal Science, Chinese Academy of Agricultural Sciences (CAAS) (Beijing, China).
Competing interests
The authors declare that they have no competing interests.
Received: 27 September 2018 Accepted: 24 January 2019
References
1. Benne R, Van Den Burg J, Brakenhoff JP, Sloof P, Van Boom JH, Tromp MC. Major transcript of the frameshifted coxll gene from trypanosome mitochondria contains four nucleotides that are not encoded in the DNA. Cell. 1986;46:819–26.
2. Farajollahi S, Maas S. Molecular diversity through RNA editing: a balancing act. Trends Genet. 2010;26:221–30.
3. Tajaddod M, Jantsch MF, Licht K. The dynamic epitranscriptome: a to I editing modulates genetic information. Chromosoma. 2016;125:51–63. 4. Nishikura K. A-to-I editing of coding and non-coding RNAs by ADARs. Nat
Rev Mol Cell Biol. 2016;17:83–96.
5. Chen J, Peng Z, Zhang R, Yang X, Tan BC, Fang H, et al. RNA editome in rhesus macaque shaped by purifying selection. PLoS Genet. 2014;10: e1004274.
6. Peng Z, Cheng Y, Tan BC-M, Kang L, Tian Z, Zhu Y, et al. Comprehensive analysis of RNA-Seq data reveals extensive RNA editing in a human transcriptome. Nat Biotechnol. 2012;30:253–60.
7. Valente L, Nishikura K. ADAR gene family and A-to-I RNA editing: diverse roles in posttranscriptional gene regulation. Prog Nucleic Acid Res Mol Biol. 2005;79:299–338.
8. Higuchi M, Maas S, Single FN, Hartner J, Rozov A, Burnashev N, et al. Point mutation in an AMPA receptor gene rescues lethality in mice deficientin the RNA-editing enzyme ADAR2. Nature. 2000;406:78–81.
9. Wang Q, Khillan J, Gadue P, Nishikura K. Requirement of the RNA editing deaminase ADAR1 gene for embryonic erythropoiesis. Science. 2000;290: 1765–8.
10. Brennicke A, Marchfelder A, Binder S. RNA editing. FEMS Microbiol Rev. 1999;23:297–316.
11. Wang Y, Xu X, Yu S, Jeong KJ, Zhou Z, Han L, et al. Systematic
characterization of A-to-I RNA editing hotspots in microRNAs across human cancers. Genome Res. 2017;27:1112–25.
12. Wang C, Zou J, Ma X, Wang E, Peng G. Mechanisms and implications of ADAR-mediated RNA editing in cancer. Cancer Lett. 2017;411:27–34. 13. Tan MH, Li Q, Shanmugam R, Piskol R, Kohler J, Young AN, et al. Dynamic
landscape and regulation of RNA editing in mammals. Nature. 2017;550: 249–54.
14. Picardi E, Manzari C, Mastropasqua F, Aiello I, D’Erchia AM, Pesole G. Profiling RNA editing in human tissues: towards the inosinome atlas. Sci Rep. 2015;5:14941.
15. Blanc V, Park E, Schaefer S, Miller M, Lin Y, Kennedy S, et al. Genome-wide identification and functional analysis of Apobec-1-mediated C-to-U RNA editing in mouse small intestine and liver. Genome Biol. 2014;15:R79. 16. Lagarrigue S, Hormozdiari F, Martin LJ, Lecerf F, Hasin Y, Rau C, et al.
Limited RNA editing in exons of mouse liver and adipose. Genetics. 2013; 193:1107–15.
17. Gu T, Buaas FW, Simons AK, Ackert-Bicknell CL, Braun RE, Hibbs MA. Canonical A-to-I and C-to-U RNA editing is enriched at 3'UTRs and microRNA target sites in multiple mouse tissues. PLoS One. 2012;7:e33720. 18. Danecek P, Nellaker C, McIntyre RE, Buendia-Buendia JE, Bumpstead S,
Ponting CP, et al. High levels of RNA-editing site conservation amongst 15 laboratory mouse strains. Genome Biol. 2012;13:26.
19. Li M, Wang IX, Li Y, Bruzel A, Richards AL, Toung JM, et al. Widespread RNA and DNA sequence differences in the human transcriptome. Science. 2011; 333:53–8.
20. Paz N, Levanon EY, Amariglio N, Heimberger AB, Ram Z, Constantini S, et al. Altered adenosine-to-inosine RNA editing in human cancer. Genome Res. 2007;17:1586–95.
21. Gallo A, Locatelli F. ADARs: allies or enemies? The importance of A-to-I RNA editing in human disease: from cancer to HIV-1. Biol Rev. 2012;87:95–110. 22. Funkhouser SA, Steibel JP, Bates RO, Raney NE, Schenk D, Ernst CW.
Evidence for transcriptome-wide RNA editing among Sus scrofa PRE-1 SINE elements. BMC Genomics. 2017;18:360.
23. Wang Z, Lian J, Li Q, Zhang P, Zhou Y, Zhan X, et al. RES-scanner: a software package for genome-wide identification of RNA-editing sites. GigaScience. 2016;5:37.
24. Kim D, Pertea G, Trapnell C, Pimentel H, Kelley R, Salzberg SL. TopHat2: accurate alignment of transcriptomes in the presence of insertions, deletions and gene fusions. Genome Biol. 2013;14:R36.
25. Anders S, Pyl PT, Huber W. HTSeq—a Python framework to work with high-throughput sequencing data. Bioinformatics. 2015; 31:166–169
26. Trapnell C, Williams BA, Pertea G, Mortazavi A, Kwan G, Van Baren MJ, et al. Transcript assembly and quantification by RNA-Seq reveals unannotated transcripts and isoform switching during cell differentiation. Nat Biotechnol. 2010;28:511.
27. Yu G, Wang L, Han Y, He Q. clusterProfiler: an R package for comparing biological themes among gene clusters. OMICS: J Integrative Biol. 2012;16: 284–7.
28. Bakhtiarizadeh MR, Salehi A, Rivera RM. Genome-wide identification and analysis of A-to-I RNA editing events in bovine by transcriptome sequencing. PLoS One. 2018;13:e0193316.
29. Wang K, Li M, Hakonarson H. ANNOVAR: functional annotation of genetic variants from high-throughput sequencing data. Nucleic Acids Res. 2010;38:e164. 30. Lambert NJ, Gu SG, Zahler AM. The conformation of microRNA seed regions
in native microRNPs is prearranged for presentation to mRNA targets. Nucleic Acids Res. 2011;39:4827–35.
31. Betel D, Wilson M, Gabow A, Marks DS, Sander C. The microRNA. Org resource: targets and expression. Nucleic Acids Res. 2008;36:D149–D53. 32. Cingolani P, Platts A, Wang LL, Coon M, Nguyen T, Wang L, et al. A program
for annotating and predicting the effects of single nucleotide polymorphisms, SnpEff: SNPs in the genome of Drosophila melanogaster strain w1118; iso-2; iso-3. Fly. 2012;6:80–92.
33. Goldberg L, Abutbul-Amitai M, Paret G, Nevo-Caspi Y. Alternative splicing of STAT3 is affected by RNA editing. DNA Cell Biol. 2017;36:367–76.
34. Picardi E, Pesole G. REDItools: high-throughput RNA editing detection made easy. Bioinformatics. 2013;29:1813–4.
35. Ramaswami G, Zhang R, Piskol R, Keegan LP, Deng P, O'connell MA, et al. Identifying RNA editing sites using RNA sequencing data alone. Nat Methods. 2013;10:128.
36. Carmi S, Borukhov I, Levanon EY. Identification of widespread ultra-edited human RNAs. PLoS Genet. 2011;7:e1002317.
37. Bass B, Hundley H, Li JB, Peng Z, Pickrell J, Xiao XG, et al. The difficult calls in RNA editing. Nat Biotechnol. 2012;30:1207.
38. Bakhtiarizadeh MR, Shafiei H, Salehi A. Large-scale RNA editing profiling in different adult chicken tissues. bioRxiv. 2018:319871.
39. Yu H, Wu Q, Zhang J, Zhang Y, Lu C, Cheng Y, et al. Genome-wide characterization of PRE-1 reveals a hidden evolutionary relationship between suidae and primates. BioRxiv. 2015:025791.
40. Ramaswami G, Lin W, Piskol R, Tan MH, Davis C, Li JB. Accurate identification of human Alu and non-Alu RNA editing sites. Nat Methods. 2012;9:579. 41. Porath HT, Carmi S, Levanon EY. A genome-wide map of hyper-edited RNA
reveals numerous new sites. Nat Commun. 2014;5:4726.
42. Bazak L, Haviv A, Barak M, Jacobhirsch J, Deng P, Zhang R, et al. A-to-I RNA editing occurs at over a hundred million genomic sites, located in a majority of human genes. Genome Res. 2014;24:365.
43. Huntley MA, Lou M, Goldstein LD, Lawrence M, Dijkgraaf GJP, Kaminker JS, et al. Complex regulation of ADAR-mediated RNA-editing across tissues. BMC Genomics. 2016;17:61.
44. Rodriguez J, Menet JS, Rosbash M. Nascent-seq indicates widespread cotranscriptional rna editing in drosophila. Mol Cell. 2012;47:27–37. 45. Moran C. Molecular Genetics.In: F.Rothschild M, Ruvinsky A, editors. The
genetics of the pig.UK: CABI; 2011. p. 73–100.
46. Venø M, Bramsen JB, Bendixen C, Panitz F, Holm I, Öhman M, et al. Spatio-temporal regulation of ADAR editing during development in porcine neural tissues. RNA Biol. 2012;9:1054–65.
47. Köhler M, Burnashev N, Sakmann B, Seeburg PH. Determinants of Ca2+ permeability in both TM1 and TM2 of high affinity kainate receptor channels: diversity by RNA editing. Neuron. 1993;10:491–500.
48. Chan THM, Lin CH, Qi L, Fei J, Li Y, Yong KJ, et al. A disrupted RNA editing balance mediated by ADARs (adenosine DeAminases that act on RNA) in human hepatocellular carcinoma. Gut. 2014;63:832–43.
49. Gonzalez C, Lopez-Rodriguez A, Srikumar D, Rosenthal JJ, Holmgren M. Editing of human K V 1.1 channel mRNAs disrupts binding of the N-terminus tip at the intracellular cavity. Nat Commun. 2011;2:436. 50. Lomeli H, Mosbacher J, Melcher T, Hoger T, Kuner T, Monyer H, et al.
51. Burns CM, Chu H, Rueter SM, Hutchinson LK, Canton H, Sanders-Bush E, et al. Regulation of serotonin-2C receptor G-protein coupling by RNA editing. Nature. 1997;387:303.
52. Brawand D, Soumillon M, Necsulea A, Julien P, Csárdi G, Harrigan P, et al. The evolution of gene expression levels in mammalian organs. Nature. 2011;478:343.
53. Shin Y, H-j J, Jung M, Yoo S, Subramaniyam S, Markkandan K, et al. Discovery of gene sources for economic traits in Hanwoo by whole-genome resequencing. Asian Australas J Anim Sci. 2016;29:1353. 54. Yu H, Zhang M, Ma Y, Lu J, Pan J, Pan P, et al. 5-ALA ameliorates hepatic
steatosis through AMPK signaling pathway. J Mol Endocrinol. 2017;59:121–8. 55. Watt MJ, Holmes AG, Pinnamaneni SK, Garnham AP, Steinberg GR, Kemp BE,
et al. Regulation of HSL serine phosphorylation in skeletal muscle and adipose tissue. American Journal of Physiology-Endocrinology and Metabolism. 2006;290:E500–E8.
56. Ahmadian M, Abbott MJ, Tang T, Hudak CS, Kim Y, Bruss M, et al. Desnutrin/ ATGL is regulated by AMPK and is required for a brown adipose phenotype. Cell Metab. 2011;13:739–48.
57. Frayn KN, Arner P, Ykijärvinen H. Fatty acid metabolism in adipose tissue, muscle and liver in health and disease. Essays Biochem. 2006;42:89. 58. Nishikura K. Functions and regulation of RNA editing by ADAR deaminases.
Annu Rev Biochem. 2010;79:321–49.