Open Access
Research
Refuting phylogenetic relationships
James Bucknam
1, Yan Boucher
2and Eric Bapteste*
1Address: 1Canadian Institute for Advanced Research and Genome Atlantic, Department of Biochemistry and Molecular Biology, Dalhousie University, Halifax, Nova Scotia, B3H 4H7, Canada and 2Department of Chemistry and Molecular Biosciences, Macquarie University, North Ryde, NSW 2109, Australia
Email: James Bucknam - [email protected]; Yan Boucher - [email protected]; Eric Bapteste* - [email protected] * Corresponding author
Abstract
Background: Phylogenetic methods are philosophically grounded, and so can be philosophically biased in ways that limit explanatory power. This constitutes an important methodologic dimension not often taken into account. Here we address this dimension in the context of concatenation approaches to phylogeny.
Results: We discuss some of the limits of a methodology restricted to verificationism, the philosophy on which gene concatenation practices generally rely. As an alternative, we describe a software which identifies and focuses on impossible or refuted relationships, through a simple analysis of bootstrap bipartitions, followed by multivariate statistical analyses. We show how refuting phylogenetic relationships could in principle facilitate systematics. We also apply our method to the study of two complex phylogenies: the phylogeny of the archaea and the phylogeny of the core of genes shared by all life forms. While many groups are rejected, our results left open a possible proximity of N. equitans and the Methanopyrales, of the Archaea and the Cyanobacteria, and as well the possible grouping of the Methanobacteriales/Methanoccocales and Thermosplasmatales, of the Spirochaetes and the Actinobacteria and of the Proteobacteria and firmicutes.
Conclusion: It is sometimes easier (and preferable) to decide which species do not group together than which ones do. When possible topologies are limited, identifying local relationships that are rejected may be a useful alternative to classical concatenation approaches aiming to find a globally resolved tree on the basis of weak phylogenetic markers.
Reviewers: This article was reviewed by Mark Ragan, Eugene V Koonin and J Peter Gogarten.
Open peer review
Reviewed by Mark Ragan, Eugene V Koonin and J Peter Gogarten. For the full reviews, please go to the Reviewers' comments section.
Background
Since the 1960's, molecular phylogeneticists have sought to reconstruct organismal relationships based on gene and protein trees [1]. Generally, successes in this enter-prise have been evaluated as a function of the capacity to build unambiguous monophyletic groups, thus reducing the paraphyly of former classifications [2]. Despite such Published: 06 September 2006
Biology Direct 2006, 1:26 doi:10.1186/1745-6150-1-26
Received: 25 August 2006 Accepted: 06 September 2006
This article is available from: http://www.biology-direct.com/content/1/1/26
© 2006 Bucknam et al; licensee BioMed Central Ltd.
precise goals, tree reconstruction remains notoriously dif-ficult, both for practical and conceptual reasons. Regard-ing some of the problems of classical phylogenetics, many publications have presented what we feel to be valid argu-ments [3]. At a large scale, the most pervasive issue is probably the occurrence of lateral gene transfers (LGT) [4]. This paper will, however, focus on a different topic, tackling instead a peculiar practical issue: the relative weakness and the ambiguity of the phylogenetic signal in a context of a tree-like pattern of evolution.
Dealing with phylogenetic information recorded in molecular markers is indeed often a major challenge. Each individual gene is of limited size, generally too short to fully resolve a given phylogenetic question [5]. In addi-tion, the phylogenetic signal is generally eroded by muta-tional saturation and suffers from other sources of homoplasy such as convergence or parallelism that led to unevenly resolved trees. This unequal support is reflected by the bootstrap values (BVs) associated with the different nodes of the gene tree. BVs are the most common way to assess the robustness of clades. They are produced by a random resampling of positions with replacement to determine sampling error or the confidence interval for the groups as displayed in the hypothesized best tree [6]. Low BVs reflect that the marker employed contained too few synapomorphies to be conclusive. High BVs indicate that the data consistently support a given grouping. How-ever to conclude that a highly supported grouping identi-fies a true set of descendants from a common ancestor requires that the BV statistics are not artefactually biased. Such artifactual biases often arise, since very fast-evolving species of an alignment will systematically tend to group together, independently of their real phylogenetic rela-tionships [3]. If present, this long branch attraction prob-lem is generally aggravated as the sequences under study get longer [7]. Such artifically increased BVs are also observed in self-concatenation (i.e. concatenation of a single marker with itself). While no new independent data are added, the simple repetition of the same characters leads to questionnable higher supports (data not shown).
In spite of this, when phylogeneticists face problems of weak resolution using a few markers, they traditionally try to increase the support for the clades under study by pro-viding more phylogenetic signal (i.e. increasing the sequence length) [8]. That is, they study simultaneously several genes or proteins in an attempt to raise the global quantity of synapomorphies available to support each monophyletic group, following a principle of total evi-dence. As one often reads in papers proposing concatena-tion analyses, total evidence rests on the assumpconcatena-tion that if multiple markers share a common history then their overall analysis will produce a concatenation tree that is
better resolved, through summation of their individually weak phylogenetic signals.
As debates around the works of the famous philosopher R. Carnap have shown, total evidence methods have a defined epistemological background: they belong to the
verificationist toolkit. In other words, aware of it or not, classical phylogeny and its attempt to establish robust clades by concatenation are a verificationist procedure. Importantly, verificationism is not the only possible approach to acquiring scientific knowledge, as decades of epistemological studies have underlined. For instance, it is well known that falsificationism directly opposes verifi-cationism. Falsificationism supposes that "natural laws ... can never do more than exclude certain possibilities"[9]. To make the constrast more clear in a phylogenetic context: instead of aiming to confirm clades via a progressive increase in their bootstrap support when more data is added, a falsificationist would more likely be interested first by the rejection of impossible groupings, underlining what can not be a natural group. These divergent goals introduce some asymetry in our way of looking at phylo-genetic results. We will argue that it can sometimes be eas-ier (and preferable) to decide which species do not group together than which ones do. Our reason to encourage the development of an alternative perspective to verification-ism is not a commitment to falsificationist sensu stricto. Simply, it follows a third epistemological current: the one of P. Feyerabend, who stated that: «proliferation of theories is beneficial for science, while uniformity impairs its critical power» [10].
that could help traditional (verificationist) classifiers explore a refined selection of realistic taxonomic connec-tions.
Material and methods
Constitution of the datasetsThe archaeal dataset is the one presented in [11]. In brief, it comprises 23 aligned ribosomal markers: rpl2p, rpl15p, rpl18p, rpl22p, rpl23p, rpl30p, rpl37ae, rpl3p, rpl44e, rpl4p, rps10p, rps13, rps15p, rps17e, rps19e, rps19p, rps2p, rps3p, rps4p, rps5p, rps6e, rps7p and rps8e. Each marker presented 23 species: 4 crenarchaeotes ( Pyrobacu-lum aerophiPyrobacu-lum, Aeropyrum pernix, Sulfolobus solfataricus, Sulfolobus tokodaii), 3 Thermococcales (Pyrococcus furiosus, Pyrococcus abyssi, Pyrococcus horikoshii), 3 Thermoplasmat-ales (Ferroplasma acidarmanus, Thermoplasma volcanium, Thermoplasma acidophilum), 2 Halobacteriales ( Halobacte-rium sp, Haloarcula marismortui), 4 Methanosarcinales (Methanosarcina barkeri, Methanosarcina mazei, Methanosa-rcina acetivorans, Methanoccoides burtonii), 1 Methanobac-teriales, (Methanothermobacter thermoautotrophicus), 2 Methanococcales (Methanocaldococcus jannaschii, Methano-coccus maripaludis) Archaeoglobus fulgidus, diverse metha-nogens (Methanogenium frigidum Methanopyrus kandleri) and Nanoarchaeum equitans.
The sequences of 34 genes identified as core genes in [12] were retrieved using the program "retrieve sequences" in all analyses of the Neurogadgets website [38] (option "Reciprocal best match in other genomes" using a GI number). The 34 genes were: argS, infB, pheS, rplN, secY, dnaG, ksgA, proS, rpsB, serS, dnaX, leuS, rplA, rpsC, thrS, fusA, lysS, rplC, rpsD, trpS, gcp, metG, rplE, rpsG, valS, gltX, nusA, rplF, rpsH, ychF, hisS, nusG, rplK, rpsM. For all these markers, we produced a careful alignment and prelimi-nary phylogenetic analyses (NJ) to check the sequence orthology. We subsequently excluded from the files all the instances of species harboring multiple copies of each gene and obtained a set of 34 files with 135 shared spe-cies. Maximum Likelihood analyses, using Phyml [13], were conducted on these data to ensure that the mono-phyly of the main groups under study was supported. As it appeared that the homology of archaeal and bacterial sequences in lysS was doubtful, and that pheS and proS presented either hidden paralogy problems or more likely ancient LGTs between the two prokaryotic domains, these 3 markers were removed for the rest of our study. We used a selection of 43 common species representative of 8 major prokaryotic groups in the 31 remaining markers, for further in-depth phylogenetic analyses to be presented here and elsewhere. The groups tested here were: the Archaea (Halobacterium sp., Pyrococcus abyssi, Archaeoglobus fulgidus, Methanosarcina acetivorans, Thermoplasma volca-nium, Pyrobaculum aerophilum, Aeropyrum pernix, Sulfolobus solfataricus), the Spirochaetes (Borrelia burgdorferi,
Treponema denticola, Treponema pallidum), the Chlamy-diales (Parachlamydia sp., Chlamydia muridarum, Chlamydia trachomatis, Chlamydophila pneumoniae, Chlamydophila cav-iae), the actinobacteria (Propionibacterium acnes, Bifidobac-terium longum, Mycobacterium avium subsp paratuberculosis, Corynebacterium diphtheriae gravis), the Proteobacteria (Campylobacter jejuni, Wolinella succinogenes, Desulfovibrio vulgaris, Geobacter sulfurreducens, Xanthomonas axonopodis, Nitrosomonas sp., Caulobacter crescentus, Mesorhizobium loti), the Cyanobacteria (Gloeobacter violaceus, Synechocystis sp., Prochlorococcus marinus, Thermosynechococcus elongatus, Nostoc sp., Synechocystis sp.), the Aquificales/Thermoto-gales (Thermotoga maritima, Aquifex aeolicus) and the firmi-cutes (Clostridium acetobutylicum, Thermoanaerobacter tengcongensis, Ureaplasma parvum, Mesoplasma florum, Lactobacillus johnsonii, Bacillus subtilis, Staphylococcus aureus).
Impossible analyses
Bootstrap calculations were calculated using PHYML [13] (settings, 4 categories, Γ law, JTT model of evolution) and CONSENSE [14] for each of the 31 markers. These bipar-titions were inputed to our new software: Impossible, which accepts as input any bipartition files produced by CONSENSE [14], containing identical or overlapping set of species. Missing taxa are not a problem, as an option allows us to filter the outputs to focus on the common species, if desired. Typically, these infiles, one per marker, contain the list of the species investigated and the list of bipartitions with their BVs. Bipartitions appear as a string of "*" and ".", which splits the species investigated into two disjoint subsets. Species sharing a "*" or species shar-ing a "." are more closely related than species with a dif-ferent symbol. In classical phylogeny, each bipartition, thus defining a split, allows us to draw a dichotomy on a tree, and the bootstrap support indicates the robustness of this relationship. Impossible examines all of the biparti-tions that have support above a user-defined cutoff to determine two different types of impossible relationships: the basic impossibility and the combined impossibility (see Additional file 1).
pairs of bipartitions are examined to determine if a com-bined impossibility exists between them. For instance, for the bipartitions ABC|DEF and AB|CDEF, there are four pairs of cross-subsets: ABC-AB, ABC-CDEF, AB-DEF, and CDEF-DEF. However, in our definition, only AB-DEF is a combined-impossibility since all the other pairs, sharing species between their subsets, are partly overlapping. Each combined impossibility is given a score of one plus their degree value. Conceptually, this degree value represents the number of strongly supported nodes which occur on the path between the two subsets of the cross impossibil-ity and thus oppose to their direct grouping. To calculate this degree value, we defined a 'related set' as any set that includes one member of the combined-impossibility as a subset. We then listed the related sets present in all the bipartitions of a marker for each subset of the combined-impossibility of interest. Our second step is to evaluate the number of related sets that do not share any species in common. Indeed, the list of related sets does not corre-spond exactly to the number of dichotomies between two combined-impossible subsets of species as some of the related sets partially overlap and encompass common species. In order to detect and remove the overlaps between 'related sets' (not to obtain artefactually high degree values of impossibilities) and to define the number of nodes separating two groups, we sort them by decreas-ing order of size, based on the number of species that they encompass.
Briefly, 'related sets' with the most species are more likely to be involved in an overlap. The related sets that are both involved in the most numerous overlaps and higher in our list are then removed. In case of ties, one of the related sets involved in the largest number of overlaps is ran-domly selected for removal. The procedure is repeated until no overlap is left. By default, the degree of this com-bined-impossibility is then evaluated as the number of remaining related sets plus one (see Additional file 2). Researchers are however able to change these weightings in order to give cross impossibilities more or less empha-sis. If the user specifies «linear» weighting, the weighting becomes the number of related sets + 1 + a user-supplied value, if he specifies «multiplicative» weighting, the weighting becomes the number of related sets + 1 multi-plied by a user-supmulti-plied value, if he specifies «exponen-tial» weighting, the weighting becomes the number of related sets + 2 exponential a user-supplied value.
Finally, these scores of impossibilities are used to compile the tables and diagrams outputted by Impossible (see Additional file 1). The tools propose 4 different summa-ries: (1) an impossibility diagram, (2) a group-group dia-gram, (3) a species-group diadia-gram, and (4) a pairwise impossibility diagram. Each of these diagrams, while based on the same data, displays a different facet of the
results. The first set of diagrams displays all of the impos-sibilities that the program has identified. This set contains three different sections: (a) basic impossibilities, (b) com-bined impossibilities, and (c) a summation of basic and cross impossibilities. On (1), the impossibilities are dis-played as coloured squares sets on a grid. Each column corresponds to a different markers, whereas each row cor-responds to an individual impossible association of spe-cies, supported by one marker under investigation. Therefore, a square in column X in the row corresponding to impossibility w-y indicates that the association of w with y is impossible for the marker X. One can thus assess which markers present similar pattern of refutation and which do not, and which relationships are strongly rejected, or only rejected by a few markers. To ease this identification further, the rows are ordered to locate the impossibility that occurs in the largest number of markers at the bottom of the diagram, while the rarest impossible relationships is placed at the top of the diagram. In both (1a) and (1b), basic impossibility squares are coloured in white, and combined-impossibilities are indicated with various shades of blue, with darker shades corresponding to a higher overall degree value. The numerical values indicating the strength of the rejection of a relationship are also displayed in an array, for further statistics (outfile .pharm). Finally, in the combined diagram (1c), an extra-row and an extra-column display the overall impossibility score for that whole row or whole column. Markers pro-posing the most impossibilities (refuting genes), and strongest impossibilities (refuted groups) receive the highest overall score, and are easily identified.
The second diagram, which is known as the group-group impossibility diagram, transforms the data included in the first diagram in a bar graph. The length of each bar rep-resents the total score for a particular impossible group-ing. For instance, the entry AB would show the sum of the values for all of the impossibilities that have AB as a sub-set. Diagram (2) thus allows a researcher to find which groups of species tend to be the most unrelated to other species, and thus would deserve further investigations to be classified. This diagram presents another interesting property: the groups with the highest impossibility scores relative to other groups are also the most probable associ-ations of species.
placed. Counter-instances in a given marker presenting the grouping of the species with its usually refuted part-ners, would thus help to unravel interesting exceptions and original gene histories (i.e. LGT).
The final diagram produced by Impossible is the pairwise impossibility diagram (4). It shows impossibilities between pairs of individual species. By only showing pair relationships, this diagram avoids any possible group size bias, which tend otherwise to award large groups high impossibility scores. This is because large groups contain more elements which can be involved in impossibility relations. By using only single species, there is always only a one-to-one relationship. This diagram is also converted into numbers that can be used in statistical analyses to identify species with similar/different patterns of refuta-tions of relarefuta-tionships.
Finally, Impossible contains a rough feature to test the inconsistency of a priori user-defined original groupings, switch -g. Although a researcher can manually look through the complete diagrams to determine which groups are refuted and which ones are not, a more user-friendly method might be to input predefined groups of interest into Impossible (i.e. the cabozoa) and have Impossible return their information. As the user-defined group to be tested will appear in the pairwise impossibil-ity diagram under the appelation chosen by the user, an entry showing the internal impossibilities between the members of the predefined group will also be indicated in the pairwise diagram. In order for a group to be consid-ered potentially solid, a rough estimate is that the sum of its external impossibilities (the number of associations rejected by a group) must be greater than the sum of its internal impossibilities. Otherwise, the members of the a priori groups will reject their grouping more than they reject their association to any other taxa.
For the archaeal dataset, we ran Impossible with the fol-lowing command-line:
Java Impossible F1 0.9 -a -g F2 -o F3, with F1 correspond-ing to the list of files of bipartitions, F2 becorrespond-ing the descrip-tion of groups to be tested by the rough estimate of inconsistency and to be listed in the pairwise diagram and F3, the name of the outfile at the pdf format. As test-groups for F2, we retained the Methanococcales/Meth-anobacteriales, the Methanosarcinales, the Crenarchae-otes, the Halobacteriales, the Thermococcales, the Thermoplasmatales as described above. F2 exact format is built as the name of the group followed by the names of the species of the group, separated by a coma (i.e. groupName1 species1, species2, species3 and, on the next line, groupName2 species2, species3, species4.) 0.9 indi-cates that all the bipartitions with more than 10 % of
sup-port were considered. For the prokaryotic core dataset, we first ran Impossible with the following command-line: Java Impossible F1 0.1 -a -o F3, respecting the same nomenclature than above in the text. 0.1 means that biparitions with a support higher than 1-0.1, which is 90%, were considered.
The principal component analyses were run using R and a script presented in [15]. The coordinates of the species of the principal component analyses were extracted and used to test the normality of the data as well as the two-sample T-test and the Wilcoxson rank-sum with NCSS Junior 6.0. This program, which is a freely-distributed and can be downloaded from the NCSS website [39], runs on any ver-sion of Windows. The data are inputted into the program in the form of a tab-delimited table (although space-delimited and comma-space-delimited tables are also accepta-ble). This table can be prepared using our script Make-Group, with the command line MakeGroup group pgroup, where group is a text file containing the group to be tested, as described above for Impossible and pgroup is simply the output of the Principal Component Analysis, presented on two columns. Each column represents a list of values to test different species grouping (i.e. the X axis or Y axis coordinates on the principal component analy-sis). To run the analysis (options Run > Run Analysis), the columns of data of interest have to be selected in the Response variables section of the options Analysis > T-tests > Two-sample t test. The output from the program will be displayed on the screen. In addition to the primary statistical tests mentioned above, NCSS also runs several other tests to determine the validity of the data such as tests of the normality and variance equality. If the normal-ity test fail for a certain pair of groups, as its variance tests determine that the sample groups have unequal variances, it is still possible to use the Aspin-Welch Unequal-Vari-ance test instead of the two-sample T-test to assess if two groups of species are statistically different or not. It was not needed here.
Results and discussion
Toward an attempt to facilitate classical molecular systematics
simplest positions is to assume that everything is possible, that many groups might potentially host the new species.
T. Cavalier-Smith's writings about the «cabozoan hypoth-esis», (the claim that there is a common origin for eugle-noid and chlorarachnean chloroplasts), illustrate this logic of a priori maximal possibility well. As this author underlined in a paper from 1999 [17], "a relationship between euglenoid and chlorarachnean chloroplasts has not been previously suspected apart from one brief mention of the possibility [...] Though at first sight a strikingly different arrangement, it does not actually preclude a direct phylogenetic sister relationship between them, as postulated here". T. Cava-lier-Smith used the absence of evidence as a starting point for his revised systematics. For example, he argued that for "cabozoan", "the phylogeny of both groups is imperfectly known. [...] But this is no serious objection to the cabozoan the-ory", for discicristates, that "there is no particular reason to think that archezoa/discicristates are sisters to all eukaryotes except Reclinomonas. So I suggest that they may instead be sis-ter only of the Cercozoa", for the phylogenetic proximity between the sporozoan and the dinoflagellates plastids, he recalled that "the published [tufA] trees do not rule out a direct relationship instead with dinoflagellates, for which no tufA sequences are yet available" [17]. Open exploration of the taxonomically possible is definitely an important part of the traditional classification task.
Yet, discussing the possibility of new groupings is only the first step in such an analysis. Once a group and its subse-quent sister-groups are proposed, these hypotheses must be tested. In pursuing the cabozoan case, Cavalier-Smith made it clear that "one way of testing the cabozoan theory is to establish which of the clades postulated here are correct and which are false". The test may not be easy, due to the weak-ness of phylogenetic markers [18], which is often the first problem with testing taxonomic hypotheses. Along this line of thought, Cavalier-Smith recognized that "our ina-bility to infer the correct branching order of the seven taxa [including sporozoan, dinoflagellates, euglenoids and chlorarachnean] merely from rRNA trees cannot be seriously questioned. Therefore such trees cannot be used to confirm or refute my postulates of plant, chromist, and chromalveolate monophyly" [17]. Better resolution (at least locally) is thus often needed to refute some groupings. Yet obtaining bet-ter apparent resolution is not sufficient. Some visibly robust results on phylogenetic trees should be interpreted with caution due to potential artefacts that would unite some unrelated species in an erroneously supported sin-gle group. Another of T. Cavalier-Smith's proposed clades, the myosozoans, illustrated this issue and how the sys-tematist should not take a phylogeny at face value without a critical look. Some results may simply be «too nice» to be considered true, i.e. "the extreme divergence of the dino-flagellate sequences might be expected to cause them to group
with the sporozoan sequences even if they were not directly related" [17]. In this case, the comparison with other gene phylogenies, especially those including species with slower evolving genes [19], might help to pinpoint gene-specific artefactual groupings. The contrast of multiple independent gene phylogenies is thus another key in test-ing taxonomic hypotheses.
Consequently, these few examples stress the value in sys-tematics of developing phylogenetic approaches aimed at testing multiple relationships, possible and impossible alike: accounting both for the limited as well as for the conflictual resolutions between multiple gene trees.
Epistemological principles of our tests of phylogenetic hypotheses
With this goal in mind, we developed phylogenetic anal-yses testing hypothetical groupings but trying to be less verificationist and more falsificationist in spirit. To make this last principle explicit, we will discuss in more detail the interests and scopes of these two different epistemog-ical approaches.
The notion that cladism and total evidence are verifica-tionist is indeed often argued in the literature [20]. For instance, «introducing the concept of 'total evidence' in system-atics, Kluge (1989) cited the relevant theoretical background, namely the work on inductive inference and its relevance for epistemology by the philosophers Rudolf Carnap and Carl Hempel. Consulting the references provided by Kluge (1989) of Carnap (1950) and Hempel (1965) shows that for these authors, the principle of 'total evidence' was tied to inductive inference» [21]. More precisely, «the empiricist philosopher Rudolf Carnap used 'total evidence' as a tool of decision-mak-ing, where the decision is to accept or reject a certain theory/ hypothesis on inductive grounds. 'Total evidence' supports this process of decision-making by determining, in part, the value of a 'c-function,' which is the 'degree of confirmation'» [22]. «If [evidence] e expresses the total knowledge of X at time t, that is to say, his total knowledge of the results of his observations, then X is justified at this time to believe [hypothesis] h to the degree r [where r is the result of applying inductive logic to e and h], and hence to bet on h with a betting quotient not higher than r.]" [23]. Put in more concrete phylogenetic terms, total evidence suggests to analysing as many data as possible to decide how much support a given relationship has. In concatenation analyses, this is achieved by joining all the genes together in the largest alignment possible, thus maximising the number of synapomorphies.
inconsistent with A. So if x confirms hypothesis A, y confirms hypothesis B, and if x carries a greater evidentiary weight than y, then A is confirmed and B is symmetrically disconfirmed» [24]. Total evidence is thus fundamentally a confirmatory approach, going for the majority rule as the answer, instead of carefully testing if some individual gene in the concatenation rejects some groupings, and identifying which ones. This is problematic as it makes the untested assumption that there is a unique phylogenetic answer, which relevantly summarizes the phylogenetic informa-tions of the different markers. Inevitably, in a verification-ist approach (for instance after the concatenation of multiple markers) the most-parsimonious tree or the most-likely one is always «well-"corroborated"» [20]. Yet, as falsificationists would point out, it does not mean that this concatenation tree has been proven to represent the true evolutionary history for all the genes. Falsificationists would claim that the «y» characters in favor of hypothesis B have been unfairly dismissed.
This is a real problem, as more sequences would increase the global bootstrap support even when conflicting in phylogeny [15]. This may be true even when disagree-ments between markers remain, due to lateral gene trans-fer, hidden paralogy or artefacts [5]. So, when provided with a long concatenation and a verificationist tree, « sys-tematists typically talk about 'congruent' characters, but what they really mean by that is the coherence of sets and subsets of character statements relative to an inclusive hierarchy» [22]; the common tree whose existence was taken a priori for granted. Importantly, such a «test of congruence under total evidence [...] is shown to be related to the coherence theory of truth in metaphysics and thus to coherentism in epistemology» [22]. What this does mean is that such a method is not employed independently of an ontological conception of species, which is not necessarily explicitly stated and, should it be, would not necessarily be approved by all the community. As demonstrated by Ruse, "as soon as one starts breaking organisms into parts, one must bring in theory ... Take two bears, one white and one brown. Do they differ in one feature, or does one take each hair separately ... The point is whether someone who explicitly eschews the theory has the right to combine all the hairs into one feature" [22]. What the systematists who work from a verificationist/coherentist point of view classically do, is to force a unique model upon all markers, as if they were not as many gene histo-ries as there are genes: they assume that, like bear hairs, genes can be combined in one feature.
Yet, if the hairs of a bear all quite likely share a same ori-gin, in a context of lateral gene transfers (hidden paralogy and artefacts), the a priori hypothesis that there is a com-mon phylogenetic history for the genes might be very risky to embrace, as the resulting truth might well be very artefactual. After all, even random markers concatenated
together can strongly support a tree. On the one hand, "as Farris himself pointed out: "... the decision [the choice amongst competing hypotheses of relationships] is made by accepting the stronger body of evidence over the weaker, and ad hoc hypoth-eses of homoplasy are required to the extent that evidence must be dismissed in order to defend the conclusion"» [22]. On the other hand, despite what it seems "congruence does not sup-port a phylogenetic hypothesis, for the congruent characters need not be homologous, they could also be homoplastic» [22]. Philosophically speaking, the least we can say is that the greatest care should accompany the positive interpreta-tion of any global well-corroborated topology. There is indeed a high type I error to accept a wrong tree with this approach.
Some systematists, such as Kluge, came progressively to realize some of the weaknesses of verificationism, and tried to shelter phylogeny under the apparently more pro-tective aura of falsificationism. They reworded the logic of the test of congruence and insisted on the fact that «in phy-logenetic analysis, an hypothesis of relationships can be said to be falsified if a perceived synapomorphy is inconsistent or in conflict with the hypothesis», a claim that indeed sounds fal-sificationist [20]. However, there are numerous reasons for which this semantic trick falls short, as discussed in length and convincingly by Rieppel.
expounded by Rieppel, 'it is evident that no such asymmetry of falsification obtains in the 'test of congruence' based on total evidence. Congruent characters (coherent character state-ments) confirm a hypothesis of relationships to the degree that incongruent characters disconfirm it symmetrically. This is the relationship expressed in the ensemble consistency index (or tree length)» [22], or in a higher likelihood for the concate-nation ML tree. Indeed, since most phylogenetic programs work by identifying the most likely relationships between species while eliminating the most unlikely, a best tree is simply the one having a slightly higher acceptability than the rest in the output given to the user, which usually con-tains a large number of very different trees. Yet, even if such a tree is still unproven, some relationships, by defi-nition not reported on this drawing, might well have been rejected in the process of its reconstruction.
One of our guiding principle was to look for these locally rejected grouping and to try to promote a way to think more assymetrically about phylogeny without taking the verificationist shortcut, as the only answer of a phyloge-netic analysis. Instead of letting our main concern be about the 'best supported' hypothesis of relationships, we decided to focus on the most falsified hypotheses of rela-tionships. To do so, we first looked not only at the domi-nant relationships – the ones found on the best tree-but also at all the challenged associations and the multiple phylogenetic falsifications they allowed us to infer. Inter-estingly, we do not need a fully resolved tree to produce such results: the list of the bipartitions, not necessarily consistent between and within a marker suffices. Second, we analysed the refuted relationships for multiple markers of interest independently, to avoid masking any minor phylogenetic histories that would be overwhelmed by the consensus in a verificationist concatenation. We feel that this perspective might more efficiently gain taxonomic knowledge than the traditional attempt to increase the support for a given possible phylogenetic group. Indeed, from an epistemological point of view, it would allow some firm conclusions to be drawn about which groups are not true for a given dataset, while the classical approach would establish only a limited number of rela-tionships that have not been falsified yet.
Our approach to refute impossible groups
We wrote a program in java, named Impossible, which looks first of all for the relationships that are the most strongly falsified by the genomic data, using bootstrap bipartitions as infiles (see Material and methods for details). In brief, Impossible estimates a degree of impos-sibility for any pair of species or groups of species by com-paring and ranking all the bipartitions, for each marker as well as for all the markers, if they are above a user-defined threshold.
An Impossible analysis can then be followed by statistical tests, which can help decide which groupings are likely statistically rejected. We suggest using principal compo-nents analysis [25] on the data reflecting the degree of impossibility for any pair of species to group together. This multivariate analysis takes the data points, which cor-respond to all the pairwise impossibility relationships, and transforms them onto a n-dimensional plan, where the dispersal between species is maximised. That way, in the principal component analysis, the higher the pairwise impossibility score between two species, the further away from each other they will be placed on the graph. Con-versely, species for which groupings are possible will tend to cluster more closely on the graph. Observing the spread of species can thus, provide a first clue about which group-ings are refuted.
Once the data have been organised (for instance along the two main axes of the principal component analysis), the two-sample T-test and the Wilcoxson rank-sum test can be applied to compare the values of the coordinates of a pri-ori user-defined groups of species [26]. These statistical tests allow determination of whether two groups of data, A and B, are not significantly different and can be consid-ered as a subset of an overall common group or not. If the data have a normal distribution, and if the means and overall standard deviations of groups A and B are not sta-tistically different, the grouping is stasta-tistically possible. Conversely, if their means and their standard deviations differ significantly, the two groups can be determined as independent. The grouping of A and B is then statistically rejected. Clearly, the size of the data sets under investiga-tion will affect the overall accuracy of the statistical analy-sis, and larger data sets of roughly equal size provide better estimates than smaller sets.
Application to several prokaryotic genes
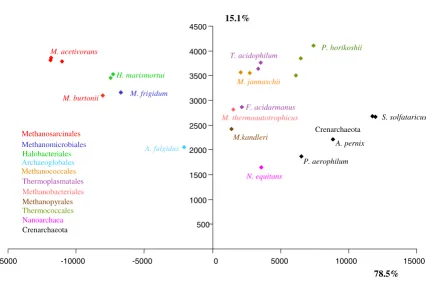
To illustrate a possible use of our software, we considered two prokaryotic datasets. First, Impossible was used to study the mysterious phylogenetic position of Nanoar-chaeum equitans, the sole cultured representative of the phylum Nanoarchaea, for an archaeal dataset of 23 ribos-omal proteins, including 23 species, belonging to more than 10 phyla (see Material and Methods). Impossible rough estimates indicated that it was more likely that N. equitans should not be grouped with the Methanosarci-nales/Methanomicrobiales (2723 degrees of impossibil-ity), then not with the Halobacteriales (1461 degrees of impossibility), the crenarchaeotes (1348 degrees of impossibility), the Methanobacteriales/Methanococcales (1335 degrees of impossibility), the Thermoplasmatales (1280 degrees of impossibility) and the Thermococcales (1208 degrees of impossibility), respectively. The PCA reflects these numbers. In Figure 1, the Methanosarcinales
(identified as members of the Class II of methanogens in [11]), as well as the Halobacteriales, fall far to the left of N. equitans, suggesting that these species are not closely related. We had however no direct way to test which of the groupings of N. equitans with species falling close to it in the PCA, such as the Methanobacteriales/Methanococca-les (identified as members of the Class I of methanogens in [11]), the Thermoplasmatales, the Thermococcales or the crenarchaeotes, were rejected or possible. We thus used these 4 different a priori groups, each containing more than three species, to operate a "triangulation" and define which could not be closely related to the Nanoar-chaea. Based on the coordinates of each species on each axis of the PCA independently, we used the two-sample T-test and the Wilcoxson rank-sum T-test at the level of 5% to test if some associations amongst all the possible pairs of these 4 groups of species were significantly rejected.
Inter-estingly, the two tests convergently concluded that the coordinates of the crenarchaeotes and the Thermococcales along the first axis were significantly larger than the coor-dinates of both the Thermoplasmatales and the Methano-coccales/Methanobacteriales. We symbolized this result on Figure 2, by a vertical frontier between these two groups of species, as the tests indicated that the species on each side of the frontier (i.e. the crenarchaeotes and the Thermococcales on one hand, and the Thermoplasmat-ales and the MethanococcThermoplasmat-ales/MethanobacteriThermoplasmat-ales on the other hand) were statistically different. When we repeated the same tests for the y axis, we observed a second frontier, horizontal, separating the "lower" crenarchaeotes from the "higher" Thermococcales/Methanobacteriales/Meth-anococcales/Thermoplasmatales. The conjunction of these two frontiers remarkably isolated N. equitans from the 4 groups, but left it in the vicinity of M. kandleri. This
Principal Component Analysis of the archaeal dataset
Figure 1
Principal Component Analysis of the archaeal dataset. Degrees of impossibility of the pairwise diagram were used to infer this principal component analysis. The variance explained by each axis is reported along the lines. Each point on the dia-gram corresponds to a species, and received the colours of the archaeal order to which it belongs, as indicated on the left of the graph.
500 1000 1500 2000 2500 3000 3500 4000 4500
-15000 -10000 -5000 0 5000 10000 15000
15.1%
78.5% M. thermoautotrophicus
M. burtonii
M.kandleri
S. solfataricus
P. aerophilum A. pernix
N. equitans
Crenarchaeota
Thermococcales
Methanosarcinales
Thermoplasmatales Methanococcales
Halobacteriales
Crenarchaeota Methanomicrobiales
Archaeoglobales
Nanoarchaea
Methanopyrales
M. frigidum
M. acetivorans
M. jannaschii
P. horikoshii
A. fulgidus H. marismortui
T. acidophilum
F. acidarmanus
analysis thus indicates that, contrary to previous sugges-tions, N. equitans might not represent a third archaeal kingdom [27,28], nor a Thermoccocales [29], but clusters within the euryarchaeotes, possibly as a relative of the Methanopyrales. This proposition now deserves careful consideration to ensure that it does not result from a long branch artefact, since both Nanoarchaeum and Methano-pyrus display high evolutionary rates for the components of their transcription apparatuses [30]. The proximity
between Methanobacteriales/Methanococcales and Ther-mosplasmatales in the upper left corner of the diagram, delineates another possible group. It is also consistant with phylogenetic analysis of concatenated ribosomal proteins that weakly groups Methanococcales and Meth-anobacteriales together, and the lack of any support in the backbone branches separating them from Thermoplas-matales, which suggest that a specific sister-grouping between them is indeed possible. However, so far no
spe-Statistics applied to PCA results
Figure 2
Statistics applied to PCA results. This figure is the same principal component analysis as figure 1, on which the boundaries deduced from the convergent results of the two-sample T-test and the Wilcoxson rank-sum test have been mapped. A thick red line corresponds to the rejection of the null hypothesis that members on opposite side could come from a same group. Identically shaded areas represent regions where the difference of coordinates would not be considered as significant.
500
1000
1500
2000
2500
3000
3500
4000
4500
0
5000
10000
15000
Y-axis
X-axis
M. kandleri
Methanococcales
Thermoplasmatales
Thermococcales
S. solfataricus
P. aerophilum
A. pernix
N. equitans
cific synapomorphies appear obvious. Other groupings, such as the two distinct classes of methanogens identified in a previous study [11], are similarly not rejected by Impossible. Methanococcales, Methanobacteriales and Methanopyrales fall on the righthand side of the x axis in the PCA (class I methanogens) as Methanosarcinales and Methanomicrobiales fall on the lefthand side (class II methanogens) (Figure 1).
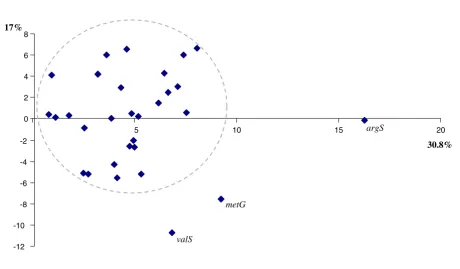
Another prokaryotic dataset of 31 ubiquitous markers constituted our second case study, as the classification of prokaryotes remains a major challenge for phylogeny [31]. These genes, present in no less than 180 complete prokaryotic genomes [12], are a potentially important set of molecular candidates to analyse what might be the ver-tical backbone at the "Tree of Life" level. In order to reduce the potential impact of lateral gene transfer or other arte-facts that would contribute an important non-vertical
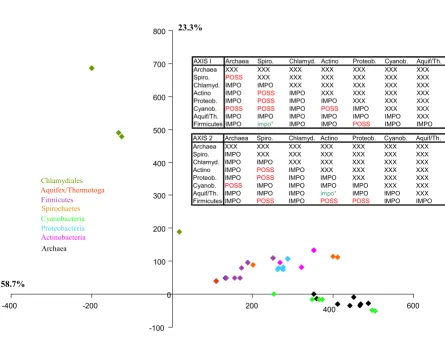
sig-nal, we carried out a first Impossible analysis focusing on the congruence between these 31 markers. We performed a principal component analysis, based on the degrees of impossibility for the 58 most commonly rejected biparti-tions presented by the Impossibility diagram. Figure 3 shows that all these markers belong to a cloud with the possible exception of argS, valS and metG. We subse-quently removed these 3 genes from our analysis and reran Impossible with the same parameters on the 28 core genes for which no incongruence was suspected a priori. The second principal component analysis based on the degrees of impossibility of the 28 markers and for 43 spe-cies is reported in Figure 4. In this diagram, the spespe-cies known a priori to belong to a monophyletic group tend to group closer (i.e the Proteobacteria are very close on the diagram), but the distance between the different mono-phyletic groups varies (i.e. the Proteobacteria are closer to the Actinobacteria than to the Chlamydiales). Some
phy-Principal component analysis of the 31 prokaryoticcore genes
Figure 3
Principal component analysis of the 31 prokaryoticcore genes. This PCA of core genes is based on their degrees of impossibility for the 58 most commonly rejected bipartitions, as reported in the .pharm. In grey, we have drawn the cloud of markers without obviously different phylogenetic signal. The variance explained by each axis is reported along the graph.
-12 -10 -8 -6 -4 -2 0 2 4 6 8
5 10 15 argS 20
metG
valS
logenetic information might thus be gained from this principal component analysis. The tables in Figure 4 report when this dispersion in the principal component analysis was considered statistically significant and excluded that two groups belong to a common clade. Interestingly, the two axes provided highly congruent answers concerning which groups were rejected or possi-ble (23 agreements and only 5 disagreements). Unfortu-nately, the position of the Chlamydiales remains undecided. Their isolation from the other bacterial taxa under study is made obvious on the PCA (Figure 4). Con-sequently, the Chlamydiales are involved in a very high number of rejections of potential relationships in the
group-group diagram (data not shown but see tables in Figure 4). This could be because all known representatives of this group are obligate intracellular pathogens, a life-style that can result in drastic changes in evolutionary rates and codon uasge biases. Additional slowly evolving representatives of the Chlamydiales appear to be needed to understand the origin of this group and no concate-nated trees involving these taxa, wherever they branch, should be taken for granted. It is interesting to note how-ever, that despite their fast evolutionary rates, they do not artefactually group with distantly related species (i.e. Archaea), as would be the case due to typical LBA artefact in a molecular phylogeny.
Principal component analysis of the degrees of impossibility of 43 species, for 28 core genes
Figure 4
Principal component analysis of the degrees of impossibility of 43 species, for 28 core genes. Each point on the diagram corresponds to a species, and received the colours of its group, as indicated on the left of the graph. The two tables contain the results of the two statistical tests applied to the coordinates on axis 1 and on axis 2, to decide if a priori groups of points on the principal component analysis are overlapping or not. Eight groups were tested (see. Mat. and Meth.). When two groups were non-overlapping, we reported IMPO for impossible grouping on the table, and when we could not reject the null hypothesis that they overlap, we reported POSS. We indicated by an impo*, when one test only rejected a grouping.
-100 0 100 200 300 400 500 600 700 800
-400 -200 200 400 600
58.7%
23.3%
Chlamydiales
Aquifex/Thermotoga Firmicutes Spirochaetes Cyanobacteria
Proteobacteria
Actinobacteria
Archaea
AXIS I Archaea Spiro. Chlamyd. Actino Proteob. Cyanob. Aquif/Th. Archaea XXX XXX XXX XXX XXX XXX XXX Spiro. POSS XXX XXX XXX XXX XXX XXX Chlamyd. IMPO IMPO XXX XXX XXX XXX XXX Actino IMPO POSS IMPO XXX XXX XXX XXX Proteob. IMPO POSS IMPO IMPO XXX XXX XXX Cyanob. POSS POSS IMPO POSS IMPO XXX XXX Aquif/Th. IMPO IMPO IMPO IMPO IMPO IMPO XXX Firmicutes IMPO impo* IMPO IMPO POSS IMPO IMPO
The non-conflictual information about the rejected groups and the convergent information about the possi-ble ones allowed us to suggest three possipossi-ble groupings: (i) the proximity of the Archaea and the Cyanobacteria, (ii) the proximity of the Spirochaetes and the Actinobac-teria and (iii) the proximity of the ProteobacActinobac-teria and the Firmicutes, while other configurations are rejected. The possibility of an even larger clade comprising this last two could also be put forward, consistent with the dispersion along the principal component analysis. These results are of interest as they suggest an early emergence of both Cyanobacteria and Archaea, should the root of this tree be placed in between the two prokaryotic domains. Should the tree-like reasoning apply to these markers, this hypothesis would be consistent with the proposition that there might have been methanogenic Archaea and Cyano-bacteria living contemporarily 2.8 billions years ago [32,33]. Such an ancestry of Archaea is however impor-tantly contested by T. Cavalier-Smith [34], for whom the old fossil evidence is too indirect to be conclusive. Pres-ently, Cyanobacteria live closely associated with halo-philic Archaea in microbial mats found in saline environments, and it has been suggested that the fact that both Cyanobacteria and Archaea display gas vesicle struc-tures (which help them keep afloat in their natural envi-ronments) could be the result of lateral gene transfer. Yet, on the other hand, if the relationship between these taxa is one of common descent, this feature could be instead an ancestral characteristics of this group. Further in-depth phylogenetic studies will be needed to decide if this con-nection is genuine or should be rejected. A priori, this grouping is unlikely to result from an artefact due to pref-erentially shared lateral gene transfer, as prokaryotic groups known to have undergone frequent interdomain gene transfers (such as Thermotogales or Methanosarci-nales) are not artificially attracted to representatives of the donor domain in our PCA (Figure 4). Furthermore, earlier gene phylogenies dealing with partially overlapping sets of markers never identified such a problem [35]. Yet, it might reflect another problem if one considers the prox-imity of Thermotogales and Aquificales (Figure 4), which are both hyperthermophilic specialist bacteria with small genomes, as artefactual. Perhaps similar lifestyles could impose similar evolutionary biases on their genomes [35]. Finally, the possible proximity between the Spirochaetes and the Actinobacteria, as well as between the Proteobac-teria and the Firmicutes also deserve to be studied in evo-lutionary scenarios, as it might help to refine our understanding of the bacterial evolution.
Conclusion
Surprisingly, the application of our simple software based on a slightly modified perspective allowed us to extract some original information about complex phylogenetic problems. We easily rejected a large number of a priori
possible combinations, which is our primary results. That some groups are left possible for these markers is then mentionned, as a complementary result. None of these possible group (the proximity of N. equitans and of the Methanopyrales, of the Archaea and the Cyanobacteria, the possible groupings of Methanobacteriales/Methanoc-cocales and Thermosplasmatales, of Spirochaetes and the Actinobacteria and of the Proteobacteria and the firmi-cutes) should be taken as proven by this approach. Instead all of them should be tested further under the advice of biologists working with the organisms, with other mark-ers or charactmark-ers, and eventually be falsified. In any case, we hope that our present work encourages the attempts to multiply the perspectives in phylogeny. In this respect, a lot remains to be done to investigate more exhaustively, and with more powerful tools than ours, the "impossible informations" carried by phylogenetic markers, and their conflicting signal, which is too rarely discussed (but see [36] and [37] for interesting exceptions).
Competing interests
The author(s) declare that they have no competing inter-ests.
Authors' contributions
JB wrote Impossible. YB provided the biological expertise required to interpret the phylogenetic results and helped with the redaction of the manuscript. EB conceived the project, supervised it, created the datasets and wrote the manuscript.
Reviewers' comments
We would like to thank the referees for their comments that greatly help to improve this manucript.
Reviewer's report 1
Mark Ragan, The University of Queensland, Brisbane, Aus-tralia
Philosophical theorising on classification is as old as Plato, and will continue for centuries. In the absence of logical error, the authors' programme cannot be proven either right or wrong, although it might be examined (subjectively) for aesthetic qualities such as elegance. Thus I offer these comments to help explore not the truth of fal-sity of their claims, but rather their generality, explanatory power, and utility in application to real problems.
(1) Does concatenation practice rest on verificationism? The authors assert that when bootstrap values are low, phylogeneticists "try to increase the support of the clades under study by providing always more phylogenetic sig-nal (i.e. increasing the sequence length)". No doubt some do, but alternatively we might view sequence regions as samples of the genome. A small sample (i.e. a single short sequence) might represent a region of the genome that happens to be anomalous in some way – as the result of mutational saturation, selection, GC bias or whatever – and it would simply be good scientific practice to obtain further samples from different genomic regions, in hopes of integrating over as much local misinformation as pos-sible. The motivation would be not purely to pull signal out from stochastic noise, but equally to avoid interpret-ing a local anomaly as the true genome-wide phylogenetic signal. This seems beneficial regardless of philosophical programme. Indeed it's not always clear that the verifica-tionist and falsificaverifica-tionist programmes can be cleanly sep-arated. Consider the following (admittedly not very general) case:
To test the hypothesis "there are exactly 10 thousand lilies in this 1-ha field", would I rather have data from a single random 1-m2 sample grid, or from 1000? Unless the field
were fully tiled with grids and I can count the lilies in every one, I cannot guarantee that I can definitively test the hypothesis. But under either programme I'm better-off with 1000 grids than with one: if the count exceeds 10 thousand (which, given the size of lilies, is more likely to happen in 1000 grids than in one) then the hypothesis is strongly falsified; and if not, I can use the number of lilies the 1000 grids do contain to assign a more-accurate prob-ability to the truth of the hypothesis. Either way, it's in my interest to have access to more grids.
Author response: I want to thank the reviewer for his very interesting comments. It seems to me that the sample perspec-tive is interesting. I will embrace this analogy in my answer, and I would argue (i) that falsificationism and verificationism approach can still be distinguished, and (ii) that the a priori hypothesis that there is a unique field to sample is coherentist and is not a free assumption, as it biases the meaning of the results of the multiple sample practices.
It is indeed very important to have a better estimate of what the field of 1ha contains (of what the tree of life is), if there is such thing as a 1ha field (such a thing as a tree of life). If there is no such thing, but several overlapping patches of grass, multiple fields in this 1 ha area, then our estimate based on multiple sample will certainly be accurate, but it will not be a relevant description of the distribution of lilies. In fact, the number of lil-ies in each patch could differ for the simple and good reason that there is no such thing as a unique homogenous 1ha field, and then why would be willing to go on and comment about how rich this field is? So if the background hypothesis is correct, we are better off with more estimates, but we should make sure that we test that the hypothesis is safe first. We can not only be verficationist.
However, in phylogenetic concatenations, if someone assumes that there is a tree, he is not prone to consider that different esti-mates could genuinely be different and that these differences should be tested to validate the concatenation approach itself.
Where the falsificationist and verificationist approaches could differ then is that while the verificationist would assign itself the goal to describe the field as well as he can, the falsification-ist would eventually be happy enough to reject 1. that there is a field, 2. that there is this number of lilies in this patch. The first one is coherentist (one field to count them all), the second one does not have to be so (as many differences as we can report could undermine the claim that there is one field to be discov-ered out there).
(2) In relationship-testing, would a falsificationist be "more likely [to] be interested by the rejection of impossi-ble groupings, underlining what can not be a natural group"? For Popper, the possibility of falsification demar-cated science from pseudo-science (see Conjectures and Refutations). One exposes a hypothesis (here, a proposed clade) to a risk (a test in which the proposed clade can be shown to be false); if the hypothesis survives, its scientific status is enhanced (if it fails, it might be rescued by ad hoc measures, but would come out with diminished scientific status). Falsification in this sense seems quite different from what the authors propose, which seems more a mat-ter of chipping away at the space of possible hypotheses. Do the authors imply that by refuting some dozens (or hundreds, or thousands) of clades, all remaining un-refuted ones (or the refutable ones among them) are increased in status?
Author response: No, we do not mean that. We stick to the deepest spirit of refutation, which is not about proving any-thing, but disproving some things.
increased status. Or (as in the Nanoarchaeum equitans example) must we happen to care about the individual clades that happen to be refuted?
Author response: No increase in status for us. What was not rejected remains unproven for us. We simply suggest that we should keep in mind what was rejected and make it visible. Then, if someones wishes to test the coherentist hypothesis that Nanoarchaeon is a X, we could at least tell him what are the many evidence that actually opposed to this claim.
(3) What does "falsificationist-lite" mean? In their "Impossible" analysis, have the authors not fallen into what Rieppel called the "semantic trick" of superficial fal-sificationism, where clades with little or no observed bootstrap support are considered refuted? Is this really fal-sification, in either a strong or weak sense? Do the authors recommend rejecting one pre-identified clade each time, or are they carrying out multiple tests?
Author response: Falsificationist-lite means falsificationist in spirit, more eager to disprove than to confirm, to stress the irre-ducibility of conflict than to hide it. We advocate this approach not because falsificationism sensu stricto would be a better approach than verificationism for phylogenetics (both could not actually be applied in their strong sense), but because this per-spective can complement the verificationism of phylogenetic methods too prone to look at what the majority signal is, and not to look at what the plurality signal is, and would reject. Here, in this modest approach, we intend to provide a tool for anyone who, once done with his individual phylogenies, wants to look at the data in a way that he could conclude easily enough about the falseness of some (could be multiple) pre-identified hypotheses of relationships. So, in our approach there is everything that is in the classical approach (a simple use of bootstrap support to reject some groupings, but a refusal to use it to affirm that a grouping is proved) and a little bit more (a complex use of multiple bipartitions together to deduce the degrees of impossibility of a given relationship). It means that this approach is not falsificationist in the strong sense and that there is room for improvement in this respect to make it even more complementary to traditional approaches. It would be val-uable for instance to evaluate what was never ever seen in any trees, for any gene, not even ever suggested to be a grouping, without resting on bipartitions, but maybe directly looking at the pattern not inferred for each site in an alignment.
(4) Is lateral genetic transfer really the "most pervasive problem" in large-scale phylogenetics? There is little evi-dence that LGT is a problem at all for many taxa that researchers care about (e.g. animals, green plants, fungi). A stronger case might be made for the problematic perva-siveness of model mis-specification, methodological inconsistency, lineage-specific biases, long-branch
attrac-tion, paralogy, or (for systematics) the grade-vs-clade issue.
Author response: Certainly, those are problem as well. Hence my claim deserves to be tested, but can not be tested with tools that suppose that there is a unique tree a priori, and hidding the conflicting signal instead of highlighting it. One reason for which few transfers are observed by phylogeneticists using clas-sical phylogenetic approaches is simply that they can not detect the vast majority of these lateral events. The recent works of Brochier et al. is an example of that: these authors (hello Celine and coworkers) simply check if concatenated trees agree with each other and from that compatibility conclude that there is no LGT in their whole dataset. However, by doing so they simply acknowledge that they manage to obtain a dominant signal, which has not to be identical in any of the genes they used for concatenation. All these genes could support phylogenies that differ locally in topology, for instance because of LGT. The rea-son why the reviewer mention some presumably safest groups (plants, fungi, etc.) could then be partly psychological. Because some people believe that there are mechanisms causing LGT that could be important in prokaryotes, they sometimes proceed to some further phylogenetic analyses, which generally suggest that phylogenetic markers are too weak to tell about the extent of LGT, or even show some conflicting signal. Yet, for eukaryo-tes, few people have such an a priori belief, so few test it. Hence, they can not see LGT, and not see it as a problem, and they would keep thinking that artefacts are a potentially larger issue in their dataset. But, should some of them start thinking that protists acquire genes laterally, as suggested by Andersson, then we might start seeing more reports of LGT in those safest groups too. I feel this is a limit of many of Philippe's et al. publications including protists in the analyses (hello Herve and coworkers). Because they use long concatenation, they get nicely resolved trees but those trees do not tell us anything direct about the true phylogenetic history of individual markers, and if some LGT were dismissed to got the emerging picture. So honestly, I would say it is an open question at large evolutionary scales (when protists and prokaryotes are involved), and to make our mind about it more correctly, we will need to keep our eyes open to the discoveries of microbiology and molecular mechanisms of LGT. Also, I meant more pervasive because LGT undermines the very existence of a tree of life, while artefact just make it harder to be discovered.
alter-natives, but for him, there can be other key tests that are not topological in nature.
Author response: You are certainly right. Tom Cavalier Smith proposes indeed grades and clades (and I personally approve of this way of looking at things for classification purposes). Also I would assume that in many cases he actually means clade by clade (even if his own favorite topology (classification frame-work) can change), hence these claims (and singularly this one) could sometimes be tested topologically (among other approaches).
(6) In what sense is comparison with other gene phyloge-nies different from total evidence, i.e. verificationism? In the third paragraph under Results & Discussion, the authors comment that weakness of phylogenetic markers (i.e. their lack of resolving power, illustrated here by rRNA sequence data) can hinder tests (including attempted fal-sification) of theories. If even robust results may be erro-neous, what is to be done? The authors recommend comparison with other gene phylogenies. This may not be total evidence, but it does involve recourse to additional information; in what way does this move beyond verifica-tionism?
Author response: The approach is different and so could be the results. Genes are analysed individually as well as collectively: so individual dissent can be identified, local congruences can be detected, so that the phylogenetic signal does not have to be coherent at the end of the analysis. It may well be the case that no common possible "groups within groups" struture emerges at the end of such an analysis, and that we end up observing mul-tiples patterns of rejection: coherent between some genes only and incoherent with any other gene, while this is impossible to report in a verificationist approach. So this differs from total evidence in the sense that the goal is not to maximise the degree of confirmation of a single syncretic hypothesis.
(7) Do concatenation trees represent the true genomic his-tory? The principle embodied in the quotation leading off the third paragraph of the section on Epistemological principles ("inductive support works symmetrically...") should, I believe, be credited to Kolmogorov. That aside, one does not have to be a falsificationist to ask when, and indeed if, datasets should be concatenated (the total evi-dence approach in sensu Kluge); this debate permeates the supertree literature. More fundamentally, Ford Doolittle has asked whether genomes necessarily have phylogenies (his analogy with city telephone directories). Reducing all of this to a battle between Carnap and Popper does injus-tice to the underlying complexities, both biological and algorithmic.
Author response: Indeed, yet I feel it gives a solid rationale to preach in favor of the diversification of methodologies and
scopes in phylogenetics, a fields that tend to be too much con-cerned by the question "what is the tree of life?" and not by the other most fundamental essential questions: "is there a tree of life?" and "what if there is no such Tree?"
(8) Are species relevant? In the section on Epistemological principles, paragraph 4, why do the authors relate tests of 'congruence' to an ontological conception of species, as opposed to an ontological conception of genome? We are talking about nucleotide (or protein) characters, not bear hairs. In what relevant ways might the two conceptions differ?
Author response: It is related I believe in many people's mind as the use of a single phylogeny to find the single true phyloge-netic position of a species is a coherentist approach. This means that some assume that they will somehow end up equating the genome histories with a single place and time along the tree of life structure (the species origin). This conception of a species is indeed not relevant to me, as I am more inclined to conceive species as emergent cohesive arrangements of micro-compo-nents with their own histories, which can themselves trace back to different "ancestral" systems at different times and different places in the past. I am thus more interested in trying to test how many genes can be proved to coevolve (to have a cohesive pattern of inheritance). If it happens that we have no evidence against the cohesion of all the markers under study (i.e. no dif-ferent impossible groupings derived based on these markers), then we could start wondering what their common tree is. Oth-erwise, we should prove that there is a common phylogeny for species to be inferred. In this respect, Impossible analyses is a good first step to test without a priori if a series of markers should be combined and which ones.
(9) What body of observation or theory might inform the user's choice among linear, multiplicative and exponen-tial weighting (particularly given the non-independence of nodes within a given tree)? Of bipartition support threshold?
Author response: Because the issue of significativity is not spe-cific to our software (who can tell what is the bootstrap value above which a group is significantly supported?), I can only think about being empirical. Here, we offer the user different optional settings so that he tests their possible influence, to use a metaphor to try to zoom in and zoom out the distances between taxa and figure if the dispersal on the PCA for instance is dramatically modified with some parameters choices, or remain stable. Then, the user should report that such and such groups where impossible given such and such tresholds.
Reviewer's report 2