ISSN: 2334-2382 (Print), 2334-2390 (Online) Copyright © The Author(s). 2014. All Rights Reserved. Published by American Research Institute for Policy Development DOI: 10.15640/jeds.v2n4a4 URL: http://dx.doi.org/10.15640/jeds.v2n4a4
Do the Quality of Institutions, War and Macroeconomic Factors Matter for Stock
Market Development? The Evidence from Sri Lanka
N.P. Ravindra Deyshappriya1
Abstract
This paper models the impacts of the quality of the institutions, war and macroeconomic factors on stock market development of Sri Lanka over the period of 1990 – 2012 using the co-integration analysis and error correction model. According to the both long run and short run models, war and institutional quality are the most influential negative and positive factors of stock market development respectively. In addition, macroeconomic factors such as capital formation, floating exchange rate regime, inflation, real interest rate, per capita GDP andforeign direct investment also ensure the stock market development in Sri Lanka. Therefore, the current study highly recommended to accommo date the appropriate policies to ensure the quality of the institutions and peaceful environment along with macroeconomic stability.
Keywords: Co-integration, Institutional Quality, Error Correction Model,
Macroeconomic Factors 1. Introduction
1.1. Background of the Study
Stock market is one of the key players of the financial system of the economy. Similarly, stock markets act as the engine of the economic growth by providing the long term capital requirement which essential for the long run investment. Despite, there are no consensus about causal relationship between financial development and economic growth; empirical studies by Levine (2003), Levine and Zervos (1998) Bencivenga and Smith (1991), Carporale et al (2005) and Christopoulos and Tsionas (2004) have already confirmed the finance-led growth hypothesis for both and developed and developing economies.
However, the stock exchanges in emerging and developing countries are less efficient and underdeveloped compared to those are in developed economies. In particular, the performances of the stock market in Sri Lanka is lagging behind compared to the other South Asian counterparts; though Sri Lanka has been maintaining higher and stable macroeconomic conditions compared to other South Asian economies. Consequently, it is important to examine whether the macroeconomic factors influence the stock market development of Sri Lanka. Further, the association between quality of the institutions, War and stock market development are also crucial to be modelled.
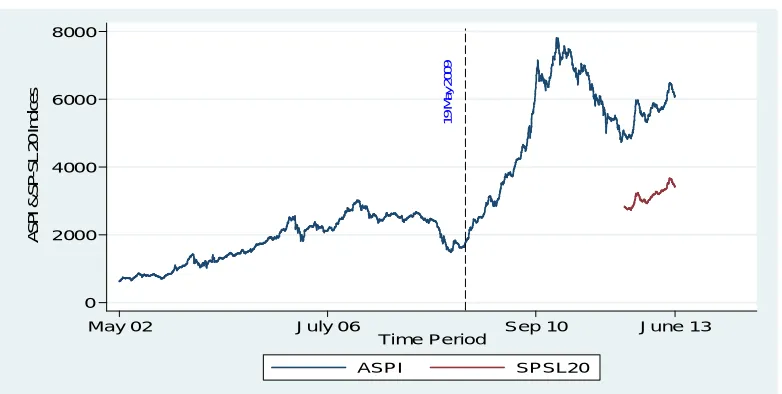
The figure 01 illustrates the daily behavior of All Share Price Index (ASPI) and S & P SL 20 index which was introduced in 2012 after canceling the Milanka Price Index. The vertical dotted line in figure 01 differentiates the war period and post-war period.
1
Therefore, the graph clearly depicts the impact of war on All Share Price Index of Colombo Stock Exchange in Sri Lanka. After finishing the war in 19th of May 2009, the price index has rocketed and reached a peak despite the world economic crisis happened.
Figure – 01: Behavior of All Share and S & P SL 20 Price Indices
Source: Created by Author based on Colombo Stock Exchange Data
The stock market performances of Sri Lanka is still at under-developed stage compared to the key markets in the region such as India, Pakistan and Bangladesh. The figure 02 compares the position of Sri Lanka among them in terms of Number of listed companies.
Figure – 02: Number of Listed Companies in Selected South Asian Economies and Sri Lanka
Source: Created by Author based on World Bank Data
It is quite obvious that India is an outlier among others, in term of number of listed companies. The main reason is, Indian stock market system consists of 22 major stock exchanges while Sri Lanka, Bangladesh and Pakistan have one, two and three respectively.Moreover, according to the 2012 statistics; the number of listed companies in Colombo Stock Exchange in Sri Lanka is 287 while Bangladesh, India and Pakistan is 229, 5191 and 573 respectively.
1 9 M a y 2 0 0 9 0 2000 4000 6000 8000 A S P I & S P -S L 2 0 I n d ic e s
July 06 Sep 10 June 13
May 02 Time Period ASPI SPSL20 0 2,000 4,000 6,000 0 2,000 4,000 6,000 2 0 0 3 2 0 0 4 2 0 0 5 2 0 0 6 2 0 0 7 2 0 0 8 2 0 0 9 2 0 1 0 2 0 1 1 2 0 1 2 2 0 0 3 2 0 0 4 2 0 0 5 2 0 0 6 2 0 0 7 2 0 0 8 2 0 0 9 2 0 1 0 2 0 1 1 2 0 1 2 2 0 0 3 2 0 0 4 2 0 0 5 2 0 0 6 2 0 0 7 2 0 0 8 2 0 0 9 2 0 1 0 2 0 1 1 2 0 1 2 2 0 0 3 2 0 0 4 2 0 0 5 2 0 0 6 2 0 0 7 2 0 0 8 2 0 0 9 2 0 1 0 2 0 1 1 2 0 1 2 Bangladesh India
Pakistan Sri Lanka
N u m b e r o f L is te d C o m p a n ie s
Even though, Sri Lanka has long been maintaining a smooth economic and social status compared to the other region counterparts, the listed number of companies in the stock exchange is obviously low.
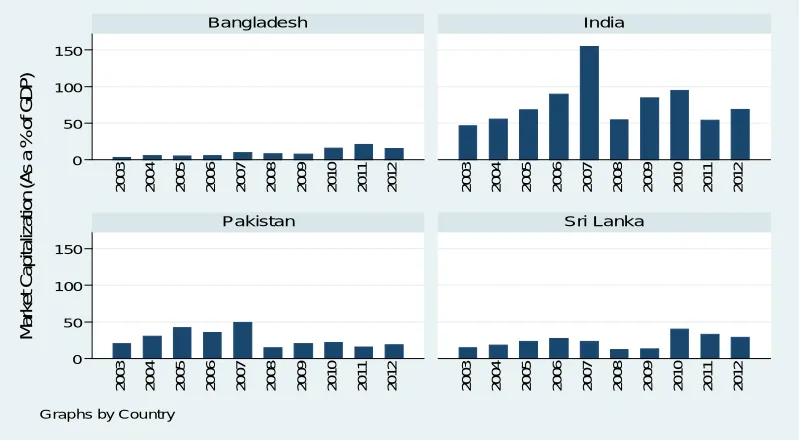
In addition to that, market capitalization as a percentage of GDP of Indian stock exchange also recorded highest values by beating other three markets. Specifically, the market capitalization as a percentage of GDP in India has exceeded 154% in 2007 while Sri Lanka was only 23.3%. In fact, the stock market of India is a collection of 22 stock exchanges and as a result of that; it has become the leading stock market in South Asian region in terms of market capitalization and trade volume. Apart from that, the value of market capitalization as a percentage of GDP of each country has been affected by global financial crisis happened in 2008 and it can be easily understood in the figure 03. As a result of the adverse effect of the financial crisis, the market capitalization of India as a percentage of GDP has sharply dropped down to 54.4% in 2008 from 154.6% in 2007 and to 12% from 23.4% in Sri Lanka.
Figure – 03 : Market Capitalization (As a % of GDP) of Selected South Asian Economies
Source: Created by Author based on World Bank Data
In overall, the number of listed companies and market capitalization of Colombo Stock Exchange are not sufficient in accordance with the country’s current economic and social development. Especially, the stock market development of Pakistan and Bangladesh even under the vulnerable economic and social conditionsfurther highlight the under-development of the stock market in Sri Lanka.
1.2. Problem Statement and Objective
It is a common fact that macroeconomic factors affect stock market development. Despite, Sri Lanka has been experiencing stable economic conditions and higher level of educational and social indicators; stock market activities are not well-developed. Therefore, it is timely important to examine whether the macroeconomic factors affect stock market development. In addition, determinants of the development of stock market with reference to the Colombo Stock Exchange in Sri Lanka have not been sufficiently addressed. Similarly, there is a miss-match between the empirical findings and the existing condition in Sri Lanka. Moreover, the impacts of the quality of the institutions and war on the stock market havenot beenexamined relevant to the stock market in Sri Lanka.
0 50 100 150 0 50 100 150 2 0 0 3 2 0 0 4 2 0 0 5 2 0 0 6 2 0 0 7 2 0 0 8 2 0 0 9 2 0 1 0 2 0 1 1 2 0 1 2 2 0 0 3 2 0 0 4 2 0 0 5 2 0 0 6 2 0 0 7 2 0 0 8 2 0 0 9 2 0 1 0 2 0 1 1 2 0 1 2 2 0 0 3 2 0 0 4 2 0 0 5 2 0 0 6 2 0 0 7 2 0 0 8 2 0 0 9 2 0 1 0 2 0 1 1 2 0 1 2 2 0 0 3 2 0 0 4 2 0 0 5 2 0 0 6 2 0 0 7 2 0 0 8 2 0 0 9 2 0 1 0 2 0 1 1 2 0 1 2 Bangladesh India
Pakistan Sri Lanka
M a rk e t C a p it a liz a ti o n ( A s a % o f G D P )
Therefore, the key research question that based on the current paper is whether the macroeconomic factors, the quality of the institutions and the war affect the stock market development in Sri Lanka?
The key objective of this paper is to examine the impacts of macroeconomic factors, quality of institutions and war on stock market development in Sri Lanka. Therefore, the study is based on a case study of Colombo Stock Exchange in Sri Lanka. Particularly, the long run and short run impacts of macroeconomic factors, quality of institutions and war on stock market development have been examined.
2. Literature Review
Most of the empirical studies have paid their attention on how the financial development or the stock market development affect the economic growth. Especially, scholars such as Beck and Levine (2003), Levine and Zervos (1998) Bencivenga and Smith (1991), Carporale et al (2005) and Christopoulos and Tsionas (2004) have highlighted the contribution of the finance sector on economic growth.
However, the empirical studies that addressed the determinant of stock market development are considerably rare in the literature. Further, there is no empirical study that examined the impact of macroeconomic and institutional factors on stock market development in the context of Sri Lanka. However, it is worth to review the available empirical works on determinants of stock market development. A study by Garcia and Liu (1999) have based on both developed and developing countries. They have selected 15 countries for their study over the period of 1980-1995. This study has examined the impact of macroeconomic factors on stock market development and they have observed that stock market liquidity, savings and income significantly influence the stock market development. Similarly, Garcia and Liu (1999) concluded that both banking sector and stock market development are complementary rather than substitution. Despite, Garcia and Liu (1999) found that political stability is not a significant factor of stock market development; Girma and Shortland (2008) have confirmed that democracy and political stability enhance the financial development. Their findings are based on the pooled analysis of both developed and developing countries over the period of 1975 – 2000. A Study based on the MENA countries by Naceuret al (2007) has highlighted contribution of economic stability, savings, financial intermediary and stock market liquidity on stock market development. They have analyzed the data from 12 MENA countries using the fixed and random effect panel data analysis. As Garcia and Liu (1999), they also confirmed that banking sector and stock market development are more complementary rather than substitution. Additionally, Demirguc-Kunt and Levine (1996) have stressed that banking sector development significantly affect the stock market development.
Further, Garcia and Liu (1999) have mentioned that both macroeconomic and institutional factors affect stock market development, despite they have considered only about the macroeconomic factors. Thus, IMF working paper by Yartey (2008) has taken the impact of both macroeconomic and institutional factors in to account. This study have applied dynamic panel data analysis based on GMM method for 42 emerging countries during 1990 – 2004. Especially, the political risk index has been used as a proxy for the quality of the institutions. According to the results of Yartey (2008), GDP, investment, stock market liquidity, capital inflow and banking sector development. Additionally, political risk and law and order also highly link with the stock market development.
In addition to them, La Porta et al (1997 and 1998) and Pistor et al (2000) have also emphasized the contribution of legal and institutional factors on stock market development in transition and emerging economies. However, unlike Yartey (2008) and Cherif and Gazdar (2010) this study has stressed that institutional factors are not quite important on stock market development.
Apart from them, Mansor (2011) has conducted a co-integration analysis based on VAR model in the context of the stock market development of the Thailand. He has analyzed the impact of the macroeconomic variables on stock market development. Mansor (2011) has stressed that real GDP, aggregate price level and the investment ratio as the key factors of the stock market development in Thailand. Further, this study has indicated that there is a bi-directional causality between stock market development and real GDP. A broad analysis on financial development economic growth has been done by Mishal (2011) for Jordan. However, this study also specify the development of stock market development as well. Accordingly, GDP growth and banking sector development positively affect the stock market development in Jordan. Another study on the stock market development in Jordan has been conducted by El-Nader &Alraimony (2013) over the period of 1990-2011. Their study have based on the VECM analysis in which the market capitalization was used as the stock market development. In fact, scholars such as Yartey (2008), Naceur (2007) and Garcia & Liu (1999) have also used the market capitalization as a proxy for the stock market development. According to El-Nader &Alraimony (2013), money supply, stock market liquidity, capital formation and credit to private sector are positively related with the stock market development in Jordan while GDP and the remittances are negatively.
An application of error correction model was done by Kemboi and Tarus (2012) in the context of quarterly data from Nairobi Stock Market in Kenya over the period of 2000 – 2009. According to the econometric analysis, banking sector development, stock market liquidity and income level positively linked with the stock market development. However, the macroeconomic stability was not a crucial factor of explaining the development of stock market in Nairobi, Kenya. Apart from them, the impact of macroeconomic variables on discount rate has been examined by Leroy and Porter (1981) while Fannery and Protopapadakis (2002) have confirmed the direct relationship between macroeconomic factors and stock returns. This link has been also evidenced by Patroet al. (2002).
3. Methodology
3.1. Data and Sample Period
The econometric model that quantified the determinants of the stock market development in Sri Lanka is based on the time series data over the period of 1990 – 2012. The data were collected from the World Bank Data series and the Political Risk Services International Country Risk Guide of International Country Risk Guide. The Table 01 provides a detailed explanation about the variable included in this study.
Table 01: Description of the Variables
Variable Code Variable Description Data Source
MC/GDP CF/GDP CRDT/GDP ERPOLICY INFL SAV/GDP RINTEREST WAR
INSQUL PERCAP FDI SMLIQ
The Ratio of Market Capitalization to GDP The Ratio of Capital Formation to GDP
The Ratio of Credit to the Privet Sector to GDP Exchange Rate Policy
Inflation
The Ratio of Saving to GDP The Real Interest Rate The Civil War
Quality of the Institutions Per Capita Income
Foreign Direct Investment Stock Market Liquidity
World Bank World Bank World Bank Dummy Variable World Bank World Bank World Bank Dummy Variable www.prsgroup.com World Bank
World Bank World Bank Source: Created by Author
3.2. Econometrics Procedures Unit Root Test
The study applied the Augmented Dickey Fuller (ADF) unit root test (Dickey and Fuller – 1981) which is more commonly used by many time series studies. The theoretical background of ADF test can explained as follows.
∆ = + + + ∆ + (1)
∆ = + + ∆ + (2)
In accordance with the above theoretical background, Yt refers to any time varying variable for time period
t. Further, Yt Yt Yt 1 and the t is the time trend term and α0i is the constant. P is the number of
lagged terms and et is the error term which is white noise. According to the above model, the hypothesis can
be expressed as follows.
Null Hypothesis H0: q1= 0
Alternative Hypothesis H1: q1< 0
According to the null hypothesis, the series is non-stationary or the there is a unit root problem. Conversely, the alternative hypothesis states the series is stationary and no unit root problem exists. According ADF test, if the null hypothesis is rejected; Yt is stationary and it is known as I(0) variable. Otherwise, the series is
non-stationary and then the series should be differenced and tested for higher integration. Co-integration Test
According to Engle and Granger (1987) Error Correction Model, if the variables are non-stationary but the linear combination of series is stationary; then the co-integration exists among the variables. The process of checking the co-integration based on Engle - Granger method can be explained as follows. Assume that there are two time series variables called Xt andYtthose are Non-Stationary and so calledI( 1) variables. First, the Ordinary Least Squared (OLS) regression should be run as follows.
= + + (3)
After running the OLS regression, the residual series of the OLS regression should be checked for the unit roots.
= − − (4)
Then, if residual series( ) is Stationary and so called I(0), Xt and Yt are co-integrated. It implies that there is a long run relationship between Xt and Yt.
After that, the long run (General Model) model should be constructed by getting the difference of the I(1) variables explained in the equation (3).
∆ = + + ∆ + + (5)
After estimating the long run model, the dynamic model (Short Run Model) should be estimated using the statistically significant variables in the long run model. The equation (6) indicates the short run dynamic model.
∆ = + +⋯+ ∆ + ∆ + ∆ +⋯+ ∆
+ + (6)
The coefficients in front of the variable called Residualt-1in both equation (5) and (6) are known as the error
correction term which explains the speed of adjustment process. In other words, the rate at which the disequilibrium of the previous time period is corrected towards the long run equilibrium.
3.3. Empirical Models
An application of Engle-Granger method incorporating the variables of this study also formulates both long run and short run dynamic models. The long run model which was estimated can be given as below.
∆ / =
+ / + ΔCF/GDP + ΔCRDT/GDP + ERPOLICY+ ΔINFL +
ΔSAV/GDP + ΔRINTEREST + WAR + ΔINSQUL + ΔPERCAPGDP +
ΔSMLIQ + ΔFDI + RESID(−1) + (7)
In addition to this long run model, the short run dynamic model was estimated based on the equation (8).
∆ / = + / + ΔCF/GDP + ΔCF/GDP + +
ΔINFL + ΔINFL + ΔRINTEREST + ΔRINTEREST + ΔSAV/GDP +
ΔSAV/GDP + WAR + ΔINSQUL + ΔINSQUL + ΔPERCAP +
ΔSMLIQ + ΔFDI + RESID(−1) + (8)
The above long run and short run models have been estimated using the OLS method.
4. Results and Discussion
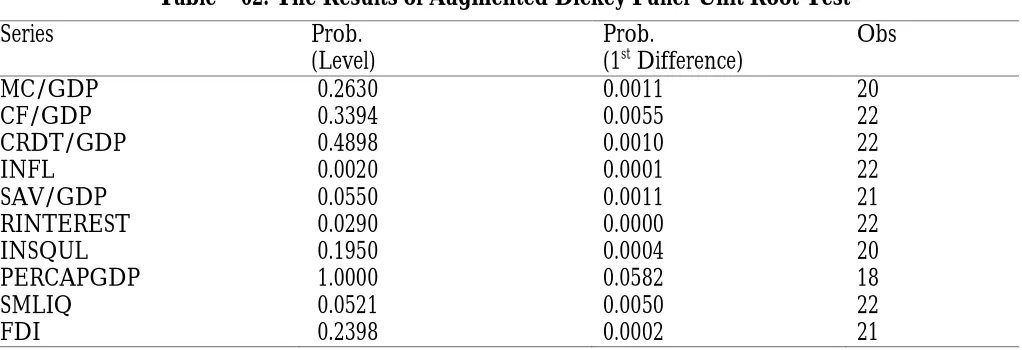
4.1. The Results of Augmented Dickey Fuller Unit Root Test
Table – 02: The Results of Augmented Dickey Fuller Unit Root Test
Series Prob.
(Level)
Prob.
(1st Difference)
Obs MC/GDP CF/GDP CRDT/GDP INFL SAV/GDP RINTEREST INSQUL PERCAPGDP SMLIQ FDI 0.2630 0.3394 0.4898 0.0020 0.0550 0.0290 0.1950 1.0000 0.0521 0.2398 0.0011 0.0055 0.0010 0.0001 0.0011 0.0000 0.0004 0.0582 0.0050 0.0002 20 22 22 22 21 22 20 18 22 21 Source: Computed by Author based on the World Bank Data
As the table 02 indicates all the variables are non-stationary at the level form; since the null-hypothesis of series are non-stationary cannot be rejected at the 5% significance level. Hence, the variables are called I(1) variables. However, the series are stationary at the first difference; since the null hypothesis of non-stationary can be rejected due to the significance probabilities.
4.2. Results of Engle-Granger Co-integration Test
Since, the data series are I(1); there is a possibility of having conintegration among the variables. The study employed the Engle-Granger Co-integration Test to capture the long run relationship among the variables. According to the method of Engle-Granger, first the OLS regression should be estimated using the non-stationary data. The following table 03shows the estimated OLS regression with I(1) variables. The main objective of this regression is to get the residual series of the regression. Hence, the further explanations of coefficient or the validity of the model are not needed to be highlighted.
Table – 03: Results of OLS Regression of Engle-Granger Co-integration Test
Dependent Variable: MC/GDP Sample (adjusted): 1990 - 2011 Method: Least Squares
Included observations: 21 after adjustments Variables C CF/GDP CRDT/GDP ERPOLICY INFL SAV/GDP RINTEREST WAR INSQUL PERCAPGDP SMLIQ FDI Coefficient -67.0064 2.5610 0.1983 11.0838 0.1571 -0.3646 0.0943 -29.2828 91.5400 -0.0217 2.9976 0.0178 Std. Error 91.6133 1.6920 0.4577 8.8010 0.5738 1.3212 0.5971 18.4645 113.7146 0.0156 1.1893 0.0167 t-Statistic -0.7314 1.5136 0.4333 1.2593 0.2739 -0.2759 0.1579 -1.5858 0.8049 -1.3928 2.5202 1.0689 Prob. 0.4831 0.1644 0.6750 0.2396 0.7903 0.7888 0.8780 0.1472 0.4416 0.1971 0.0328 0.3129 R-squared Adjusted R-squared S.E. of regression
The second step of the Engle – Granger method is related to the test of unit root of the residual of the estimated OLS regression. If the residual series is stationary at the level form, the variables are co-integrated. The order of integration of the residual series was tested using the Augmented Dickey Fuller (ADF) Test and the result is given in the table 04.
Table – 4: Results of ADF Test on Residual of OLS Regression of Engle-Granger Co-integration Test
Exogenous: Constant
Lag Length: 4 (Automatic based on SIC, MAXLAG=4)
t-Statistic Prob.* Augmented Dickey-Fuller test statistic
-3.4518 0.0324*
Test critical values:
1% level -4.2000 5% level -3.1753
10% level -2.7289
Source: Computed by Author based on the Residuals of OLS Regression in Table 03
According to the result of the ADF test, the residual series is stationary at the level form. Hence, the variables are co-integrated and thus there is a long run relationship between the dependent variables market capitalization and other independent variables.By following the Engle-Granger method, both long run general model and the short run dynamic process were constructed.
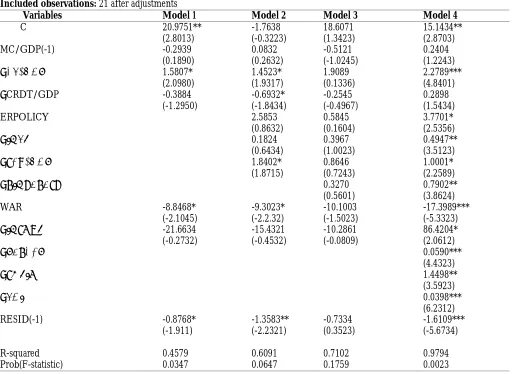
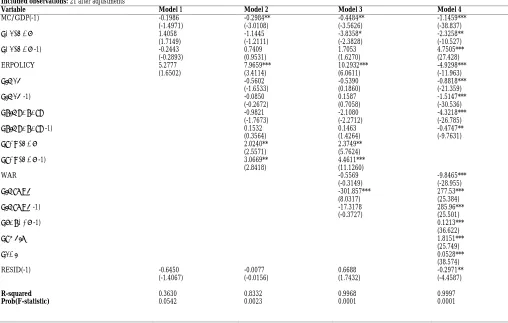
4.3. Results of the Long Run (General) Model
Table – 05: Results of the Long Run (General) Model Dependent Variable: ΔMCGDP
Sample (adjusted): 1991 - 2011 Method: Least Squares
Included observations: 21 after adjustments
Variables Model 1 Model 2 Model 3 Model 4
C MC/GDP(-1) ΔCF/GDP ΔCRDT/GDP ERPOLICY ΔINFL ΔSAV/GDP ΔRINTEREST WAR ΔINSQUL ΔPERCAP ΔSMLIQ ΔFDI RESID(-1) R-squared Prob(F-statistic) 20.9751** (2.8013) -0.2939 (0.1890) 1.5807* (2.0980) -0.3884 (-1.2950) -8.8468* (-2.1045) -21.6634 (-0.2732) -0.8768* (-1.911) 0.4579 0.0347 -1.7638 (-0.3223) 0.0832 (0.2632) 1.4523* (1.9317) -0.6932* (-1.8434) 2.5853 (0.8632) 0.1824 (0.6434) 1.8402* (1.8715) -9.3023* (-2.2.32) -15.4321 (-0.4532) -1.3583** (-2.2321) 0.6091 0.0647 18.6071 (1.3423) -0.5121 (-1.0245) 1.9089 (0.1336) -0.2545 (-0.4967) 0.5845 (0.1604) 0.3967 (1.0023) 0.8646 (0.7243) 0.3270 (0.5601) -10.1003 (-1.5023) -10.2861 (-0.0809) -0.7334 (0.3523) 0.7102 0.1759 15.1434** (2.8703) 0.2404 (1.2243) 2.2789*** (4.8401) 0.2898 (1.5434) 3.7701* (2.5356) 0.4947** (3.5123) 1.0001* (2.2589) 0.7902** (3.8624) -17.3989*** (-5.3323) 86.4204* (2.0612) 0.0590*** (4.4323) 1.4498** (3.5923) 0.0398*** (6.2312) -1.6109*** (-5.6734) 0.9794 0.0023
Source: Computed by Author based on the World Bank Data
According to the model 4 explained in the table 05, the ratio of capital formation to GDP, Floating Exchange Rate, Inflation, the ratio of savings to GDP, real interest rate, institutional quality, per capita GDP, stock market liquidity and foreign direct investment are positively related with stock market development in long run and statistically significant. In contrast, the war negatively affects to the long run stock market development with a higher statistically significant. Especially, the higher capital formation leads for the smooth running of the existing industries and also provides motivation for new industries to be established. In particular, the investments in the infrastructure essentially attracts the both international and local investors’ eyes in to the economy. Consequently, the higher level of capital formation lifts up the position of existing company expanding their network and ensuring the higher revenue in the long run. In addition, the attracted of the new industries may list in the stock market in the long run. The similar results were found by Yartey (2008) andEl-Nader &Alraimony (2013) as well.
It emphasizes that floating exchange rate introduced in 2001 positively influences the stock market development in the long run. In fact, Sri Lanka has been experiencing imperfect capital mobility where the capital account is not fully liberalized. According to the Mundell-Fleming model, the floating exchange rate is the appropriate exchange rate regime for the country where the capital account is not liberalized. The main reason is, the floating exchange rate sharpen the effectiveness of both monetary and fiscal policy when the capital mobility is imperfect. Apart from the floating exchange rate regime, the inflation rate also shows a positive relationship with stock market development. However, it does not mean that higher inflation rate ensure the higher level of stock market development. It is a common fact that both inflation and market capitalization are nominal variables and the increment of the general price level due to the inflation may be reflected by the market capitalization. Similarly, moderate level of inflation acts as a motivator for the business firms to growth; since the firms entertains the higher level of price for their products. Thus, there is a positive relationship between inflation and market capitalization in the long run.
The amount of the saving is one of the crucial determinant of stock market development in the long run. Saving is the prerequisite for the investment which is essential stock market to perform well. There are two main streams which the savings can expand the stock market activities. First, when the individuals’ savings increase; there is a potential of mobilizing the portion of savings from banking sector to stock markets as an investment. Secondly, the gross domestic savings also have a remarkable impact on stock market development since the domestic savings are essentially needed to build the new capital structures and compensate the depreciations of existing capital stock which ensure the smooth running of the economy. Garcia & Liu (1999) and Naceur (2007) have also confirmed the positive link between savings and stock market development. In addition to the Savings, the real interest rate is also positively related with stock market development in the long run. This is also mainly due to the mobilization of the savings from the banking sector to stock market in the long run. Especially, the investors can predict and foresee the risk attached to the stock market transaction in the long run. At the same time, they can access to the more reliable information in the long run which can be used to avoid the risk and uncertainty. Similarly, when the real interest rate is high; people can get higher level of interest earning for their savings as well. Ultimately, these is a higher possibility of transferring some sort of saving to purchase stocks as a diversification of investment. Apart from that, if the domestic interest rate is higher than that of foreign interest rate; there can be a capital inflow. Especially, the foreign investors respond to the interest changes in the long run compared to the short term interest changes. Hence, if the hike of real interest rate exists in the long run; they will invest on domestic assets ensuring the higher level of capital inflow to the economy. The most of these capital inflows come through the stock market transactions which is desirable for expansion of the stock market activities.
According to the estimated coefficient for the dummy variable of War in the model 4, the war has negatively affected to the stock market development in Sri Lanka. Especially, the magnitude of the estimated coefficient is the second highest and it is significant at 1% level. Sri Lanka had been suffering from 30 years long civil war which created enormous adverse impact on the economy. Especially, the lack of credibility about the economy caused to reduce the inflow of the capital which also restrict the development of the stock market. The negative impact of the War finished by 19th of May 2009 after wiping out the terrorism in the Northern and Eastern provinces of Sri Lanka.
Thereafter, the stock market indices have reached an all-time high by reflecting the impact of the peacefulness on the stock market. The figure 1 has provided a visual evidences on this regard.
However, Garcia & Liu (1999) have only focused about the macroeconomic determinants in their study. The Political Risk Index introduced by International Country Risk Guide was used as the proxy for the institutional quality. The estimated coefficient in the long run model stressed that the quality of the institutions play a crucial role in stock market development. Moreover, the estimated coefficient for the institutional quality is the highest positive coefficient compared to other estimated coefficients. Further, the Political Risk Index is a composite index which takes six sub fields in to account; such as Voice and Accountability, Political Stability and Absence of Violence, Government Effectiveness, Regulatory Quality, Rule of Law and Control of Corruptions. Hence, it is apparent that stock market activities is highly sensitive to the changes of each sub fields mentioned here. In fact, the quality of the institution is the key factor that highly links with the credibility of the economy and individual investors always keep in touch with the quality and effectiveness of the institutions since it reflects the effectiveness of the overall economy as well. Yartey (2008) has also employed the Political Risk Index to represent the quality of the intuitions and has obtained a positive relationship with the stock market development.
As the model 4 exhibits, per capita GDP is one of the factor that stimulates the stock market activities. On the one hand, when the economy is growing faster; there is a higher demand for financial assets through the demand for long term capital requirements. After finishing the war, currently there are several mammoth investment projects are being carried outin Sri Lanka. Similarly, the private sector is also booming remarkably. Thus, higher level of per capita income and economic growth ensure the stock market development as well. On the other hand, the increase of per capita GDP results to increase the income of the individuals as well. Consequently, individuals have a higher motivation to invest on stocks other than saving in the banking sector. The scholars such as Yartey (2008), Naceur (2007) and Garcia & Liu (1999) have also highlighted the positive relationship between per capita GDP and stock market development in relation to different economies.
However, sometimes individuals are hesitate to invest in the stock market due to the lack of liquidity of the markets. The previous studies by Garcia & Liu (1999) and El-Nader &Alraimony (2013) have also utilized the Total Value Traded as a proxy for the stock market liquidity. Stock market liquidity which was included in the model 4 is highly statistically significant with a positive coefficient. It implies that stock market performs well under the higher liquidity. When the stock markets have higher liquidity, the risk attached to the market is low and investors can transform the stocks in to money easily and quickly. Therefore, individuals prefer to invest on the stocks when there is a more liquid stock market.
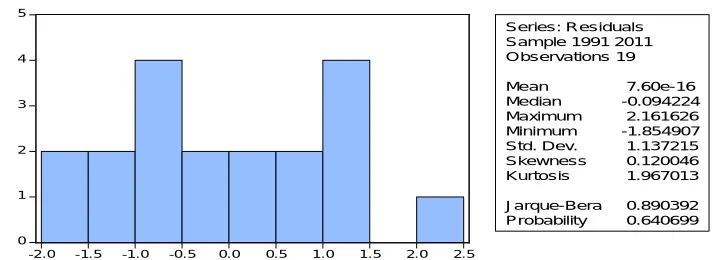
Moreover, several diagnostic tests were conducted to check whether the model is consistent with the OLS assumptions. Therefore, the normally distribution of the residuals were checked by applying the Histogram Normality Test. The result of the test is visible in the figure 04 below.The null hypothesis of the test is, the residuals are normally distributed.
According to the probability value attached to the Jarque – Bera Statistic, the null hypothesis is accepted. Therefore, the residuals of the long run model is normally distributed and hence the OLS assumption has not been violated.
Figure – 04: The Result of the Histogram Normality Test for the Long Run Model
Source: Created by Author based on the OLS regression in table 05
Serial correlation is a common problem when handling the time series data. Therefore, the Correlogram Q – Statistics Test was carried out to check whether the error term is serially correlated. The null hypothesis of the test is, residuals are not serially correlated. According to the result explained in the table 06, the null hypothesis cannot be rejected at any of the lag selected due to the insignificant probability value. Thus, the residuals of the long run model are not serially correlated. Consequently, the validity of the long run model is further confirmed.
Table – 06: The Result of the Serial Correlation Test
Correlogram Q - Statistics
Sample: 1991 2011
Included observations: 19
Autocorrelation Partial Correlation Lag AC PAC Q-Stat Prob
. |* . | ***| . | . *| . | . |* . | . | . | . *| . | . *| . | . *| . |
. |* . | ***| . | . | . | . | . | . | . | . *| . | . *| . | .**| . |
1 2 3 4 5 6 7 8
0.114 -0.380 -0.105 0.097 0.064 -0.178 -0.137 -0.079
0.114 -0.398 0.001 -0.045 0.015 -0.201 -0.070 -0.232
0.2879 3.6741 3.9501 4.1992 4.3145 5.2861 5.9094 6.1361
0.592 0.159 0.267 0.380 0.505 0.508 0.550 0.632
Source: Created by Author based on the OLS regression in table 05
4.4. Results of the Short Run (Dynamic) Model
Apart from the discussed long run model, the short run model for the stock market development was also estimated incorporating the significant variables of the long run model. The short run model clearly explain the short run dynamic process and the speed of adjustment towards the long run equilibrium. There are four models were constructed for the short run also by changing the independent variables.
0 1 2 3 4 5
-2.0 -1.5 -1.0 -0.5 0.0 0.5 1.0 1.5 2.0 2.5
Series: Residuals Sample 1991 2011 Observations 19
Mean 7.60e-16
Median -0.094224
Maximum 2.161626
Minimum -1.854907
Std. Dev. 1.137215
Skewness 0.120046
Kurtosis 1.967013
Jarque-Bera 0.890392
However, model 1, 2 and 3 are not precise according to the econometric theory due to the insignificant error correction term. Therefore, the explanation of the short run dynamic process is based on the model 4 which is highly a line with the econometric theory. The result of the short run model has been summarized in the table 07 below. According the estimated coefficient, the ratio of current level of capital formation to the GDP is negative and significantly related with the stock market development. Basically, increment of the current level is highly based on the current savings. Hence, when the current level of capital formation or investment increasing, the savings do not mobilize towards the stock market. Especially, the savings rate of Sri Lanka is considerably low compared to the other countries and sometimes it is not sufficient to maintain the even the predicted investment rate in the economy. However, if the capital formation of the previous year has increased; it positively affects to the stock market development. Capital formation includes both establishment of new business and the improvements of the infrastructure of the economy.
On the one hand, the businesses started up in the previous year may be listed in the stock market in the current period and it probably increase the market capitalization. On the other hand, the development of the economic infrastructure in the current year will absorb more foreign investment not in the current year but in the next year. The reason is, especially foreign investors take times to invest on the domestic assets, because they check the stability of the recent developments of the capital structures. Consequently, the estimated coefficient for the lag of capital formation is positive and statistically significant at 1% level.
Table – 07: Results of the Short Run (Dynamic) Model Dependent Variable: DMCGDP
Sample (adjusted): 1992 2011 Method: Least Squares
Included observations: 21 after adjustments
Variable Model 1 Model 2 Model 3 Model 4
MC/GDP(-1) ΔCF/GDP ΔCF/GDP(-1) ERPOLICY ΔINFL ΔINFL(-1) ΔRINTEREST ΔRINTEREST(-1) ΔSAV/GDP ΔSAV/GDP(-1) WAR ΔINSQUL ΔINSQUL(-1) ΔPERCAP(-1) ΔSMLIQ ΔFDI RESID(-1) R-squared Prob(F-statistic) -0.1986 (-1.4971) 1.4058 (1.7149) -0.2443 (-0.2893) 5.2777 (1.6502) -0.6450 (-1.4067) 0.3630 0.0542 -0.2984** (-3.0108) -1.1445 (-1.2111) 0.7409 (0.9531) 7.9659*** (3.4114) -0.5602 (-1.6533) -0.0850 (-0.2672) -0.9821 (-1.7673) 0.1532 (0.3564) 2.0240** (2.5571) 3.0669** (2.8418) -0.0077 (-0.0156) 0.8332 0.0023 -0.4484** (-3.5626) -3.8358* (-2.3828) 1.7053 (1.6270) 10.2932*** (6.0611) -0.5390 (0.1860) 0.1587 (0.7058) -2.1080 (-2.2712) 0.1463 (1.4264) 2.3749** (5.7624) 4.4611*** (11.1260) -0.5569 (-0.3149) -301.857*** (8.0317) -17.3178 (-0.3727) 0.6688 (1.7432) 0.9968 0.0001 -1.1459*** (-38.837) -2.3258** (-10.527) 4.7505*** (27.428) -4.9298*** (-11.963) -0.8818*** (-21.359) -1.5147*** (-30.536) -4.3218*** (-26.785) -0.4747** (-9.7631) -9.8465*** (-28.955) 277.53*** (25.384) 285.96*** (25.501) 0.1213*** (36.622) 1.8151*** (25.749) 0.0528*** (38.574) -0.2971** (-4.4587) 0.9997 0.0001
Even though, the flexible exchange rate policy enhances the stock market development in the long run; the estimated model for the short run dynamics provides an inverse relationship between floating exchange rate and stock market development. The estimated coefficient for the exchange rate policy variable by the dynamic model is negative and highly statistically significant. The Central Bank of Sri Lanka introduced the floating exchange rate in 23rd of January 2001. However, the economic indicators of Sri Lanka turned in to worse during the first two years after introducing the flexible exchange rate. Especially, the economic growth rate dropped down to lowest in the history and recorded a negative value of -1.5. Similarly, the exchange rate depreciated due to the lack of supply of foreign reserves. Under these critical economic structures in the economy happened in the short run, both local and international investors lost their credibility about the Sri Lanka economy. Hence, the stock market activities restricted and underperformed. However, the floating exchange rate was successful as a policy variable in the Sri Lanka economy few year after its arrival. Especially, the flexible exchange rate reasoned to increase the effectiveness of the monetary and fiscal policy under semi-liberalized capital account of Sri Lanka and it also caused to absorb the more foreign investments as well. Thus, the exchange rate policy variable negatively affected to the stock market development in the short run despite positively in the long run.
Inflation has become one of the adverse factors of stock market development. According to the short run dynamic model, both current and previous year inflations negatively associate with the stock market development of Sri Lanka in the short run. Especially, during the war period and 2008 there was a dramatic hike in the general price level due to the war expenditure and the World food price crisis. Consequently, the inflation of Sri Lanka reached an all-time high in 2008 recording 22.5% which was highly driven by the headline inflation. The dramatic increment of the general price level essentially damages the stability of the economy and it reduces the real value of the money followed by the lower purchasing power as well. Such kinds of consequences directly affect to the stock market transactions adversely. Similarly, the cost push inflation push the business firm bad to worse and hence they are unable to maintain their share prices as they expected. Thus, inflation is a critical factor of stock market development in the short run. The inverse relationship between stock market development and inflation is also investigated by Yartey (2008), Naceur (2007) and Menike (2006).
Further, the impact of the real interest rate in the short run was also examined using the short run dynamic model. According to the estimated coefficients, both current and previous year real interest rates negatively and significantly link with stock market development in Sri Lanka. When the interest rate is increasing, the individuals save money in the banking sector in order to have a higher and risk free interest rate in the short run. Therefore, stock market suffers from lack of funds for a short period when the interest rate is increasing. Similarly, individuals are not willing to mobilize their saving toward the stock market, since they can earn more stable and riskless interest rate payments from the banking sector compared to the risky stock price and dividends from the stock market. Additionally, the foreign capital inflow cannot be expected in the short run; despite the real interest rate has increased. The main reason is the foreign capital inflows always have time lag of responding to the domestic economic changes. Thus, the real interest rate is negatively affect to the stock market development in the short run; though it positively enhances the stock market activities in the long run by absorbing more capital inflows.
Moreover, there are many economic key points such as Central Bank of Sri Lanka, International Airport at Katunayaka, Galle Harbour and many other major places were attacked by the terrorists during the war period. Therefore, there is no doubt about the inverse relationship between war and stock market development. Apart from the War, the quality of the institutions have also been playing a major role in stock market development. According to the error correction model, both previous year institutional quality and the current year institutional quality coefficients are positive and those are the highest among all other estimated coefficients. Further, the both coefficients are highly statistically significant. It reflects that, the quality of the institutions is the key driver of stock market development in the short run. Similar results have been found by Yartey (2008) as well.
Similarly, the previous year per capita income, the current stock market liquidity and foreign direct investment also positively related with the stock market development.
Further, the coefficients of all them are statistically significant at 1% level. In fact, increase in per capita income, stock market liquidly and foreign direct investment provide more confident about the economy and will get in more capital inflows which essential for the stock market development. These findings have also been confirmed by the scholars such as Yartey (2008), Naceur (2007), El-Nader &Alraimony (2013) and Garcia & Liu (1999). As the error correction model indicates, the speed of adjustment in the short run is considerably lower than the long run. Specifically, the speed of adjustment of the disequilibrium of market capitalization is 29.71% annually. Moreover, the lower speed of adjustment in the short run is mainly due to the less confidence about the economic condition, unavailability of the appropriate information and the risk attached to the stock market in the short run. Apart from that, the negative sign and the statistical significance at the 5% level of the error correction term emphasize the validity of the model along with the higher R-Squared (0.9997) and statistically significant F- Statistics at 1% level.
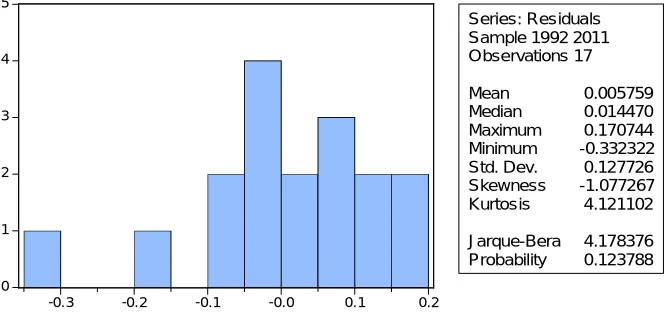
In order to check whether the error term is distributed normally, the Histogram Normality Test was carried out. The result of the test is visible in the figure 05 below.
Figure – 05: The Result of the Histogram Normality Test for the Short Run Model
Source: Created by Author based on the short run regression in table 07
The null hypothesis of the test is, the residuals are normally distributed. According to the probability value attached to the Jarque – Bera Statistic (0.1237), the null hypothesis is accepted. Therefore, the residuals of the long run model is normally distributed and hence the OLS assumption has not been violated.
0 1 2 3 4 5
-0.3 -0.2 -0.1 -0.0 0.1 0.2
Series: Residuals Sample 1992 2011 Observations 17
Mean 0.005759 Median 0.014470 Maximum 0.170744 Minimum -0.332322 Std. Dev. 0.127726 Skewness -1.077267 Kurtosis 4.121102
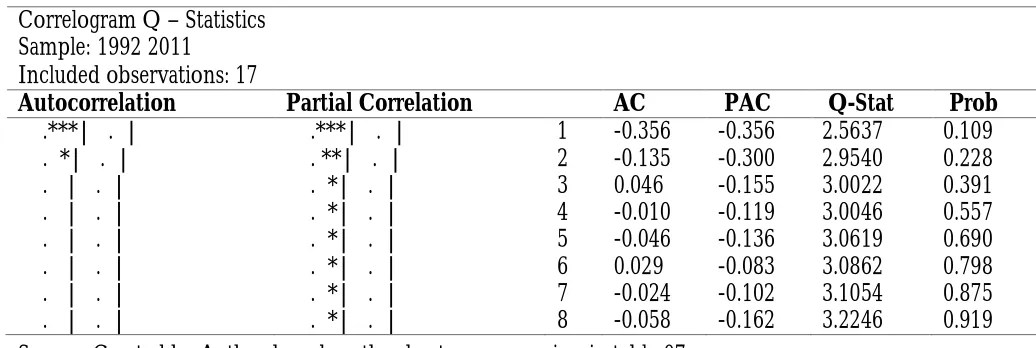
Table – 08: The Result of the Serial Correlation Testfor the Short Run Model
Correlogram Q – Statistics
Sample: 1992 2011
Included observations: 17
Autocorrelation Partial Correlation AC PAC Q-Stat Prob
.***| . | . *| . | . | . | . | . | . | . | . | . | . | . | . | . |
.***| . | . **| . | . *| . | . *| . | . *| . | . *| . | . *| . | . *| . |
1 2 3 4 5 6 7 8
-0.356 -0.135 0.046 -0.010 -0.046 0.029 -0.024 -0.058
-0.356 -0.300 -0.155 -0.119 -0.136 -0.083 -0.102 -0.162
2.5637 2.9540 3.0022 3.0046 3.0619 3.0862 3.1054 3.2246
0.109 0.228 0.391 0.557 0.690 0.798 0.875 0.919 Source: Created by Author based on the short run regression in table 07
The Correlogram Q – Statistics Test was carried out to check whether the error term is serially correlated, since the serial correlation is much more common among the time series data. The null hypothesis of the test is, residuals are not serially correlated. According to the result explained in the table 08, the null hypothesis cannot be rejected at any of the lag selected due to the insignificant probability value. Thus, the residuals of the long run model are not serially correlated. Consequently, the validity of the long run model is further confirmed.
5. Conclusions
The study applied the Engle-Granger Co-integration test to capture the long run relationship between stock market development and its determinants. According to the Engle – Granger Co-integration test there is a long run relationship between stock market development (Market Capitalization) and both macroeconomic factors and quality of the institutions.
References
Bencivenga, V. R., & Smith, B. D. (1991). Financial Intermediation and Endogenous Growth. Review of Economics Studies, 58(2), 195–209.
Carporale, G. M., Howello, P., &Soliman, A. M. (2005). Stock Market Development and Economic Growth: the Causal Linkage. Journal of Economic Development, 29(1).
Cherif, M., &Gazdar, K. (2010). Institutional and Macroeconomic Determinants of Stock Market Development in MENA Region: New Results from a Panel Data Analysis. The International Journal of Banking and Finance, 7(1), 139-159.
Christopoulos, D.K., &Tsionas, G. T.(2004).Financial Development and Economic Growth: Evidence from Panel Unit Root and Cointegration Tests, Journal of Development Economics, 73, 55-74.
Demirgüç, K.A., & Levine, R. (1996). Stock Markets Corporate Finance and Economic Growth: An Overview. World Bank Economic Review,10(2), 223-240.
Dicky, D.A, & Fuller, W.A. (1981). Likelihood Ratio Statistics for Autoregressive Time Series with a Unit Root. Econometrica, 49, 1057-1072.
El-Nader, M.H., &Alraimony, A.D. (2013). The Determinants of Stock Market Development in Jordan. International of Economics and Finance, 5(6), 91-103.
Engle, R.F., &Granger,C. W. J. (1987). Cointegration and Error Correction: Representation, Estimation and Testing. Econometrica, 55, 251-276.
Fannery M.J., &Protopapadakis A.A. (2002). Macroeconomic Factors Do Influence Aggregate Stock Returns. The Review of Financial Studies, 15,751-782.
Garcia , V.F., & Liu, L. (1999). Macroeconomic Determinants of Stock Market Development. Journal of Applied Economics, II (1), 29-59.
Girma, S., &Shortland, A. (2008). The political economy of financial development. Oxford Economic Papers, 60(4), 567-596
Gunasekarage, A., Pisedtasalasai, A., & Power, M. D. (2003). Macro-economic Influences on the Stock Market: Evidence from an Emerging Market in South Asia.
Kemboi, J.K., &Tarus, D.K. (2012). Macroeconomic Determinants of Stock Market Development in Emerging Markets: Evidence from Kenya. Research Journal of Finance and Accounting, 3(5), 57-68.
La Porta, R., Lopez-de-Silanes, F., Sheifer, A., &Vishny , R.W. (1997). Legal Determinants of External Finance. Journal of Finance, 53 (1), 1131-1155.
La Porta, R., Lopez-de-Silanes, F., Sheifer, A., &Vishny , R.W. (1998). Law and Finance Law and Finance. Journal of Political Economy, 106 (6), 1131-1150.
Levine, R. (2003). More on Finance and Growth: More Finance, More Growth? The Federal Reserve Bank of St. Louis. 31-45.
Levine, R., &Zervos, S. (1998). Stock Markets, Banks, and Economic Growth. The American Economic Review, 88(3), 537-558.
Mansor, H.I. (2011). Stock Market Development and Macroeconomic Performance in Thailand. Engineering Economics, 22(3), 230-240.
Menike, L.M.C.S. (2006). The Effect of Macroeconomic Variables on Stock Price in Emerging Sri Lankan Stock Market. Sabaragamuwa University Journal, 6(1), 50-67.
Mishal, Z. A. (2011). Financial Development and Economic Growth: Evidence from Jordan Economy. Journal of Business & Economic Studies, 17(2), 20-35.
Naceur, B. S., Ghazouani, S., &Omran, M. (2007). The Determinants of Stock Market Development in the Middle-Eastern and North African Region. Managerial Finance, 33(7), 447-489.
Patro, D.K., Wald, J.K., & Wu, Y., (2002). The Impact of Macroeconomic and Financial Variables on Market Risk: Evidence from International Equity Returns. European Financial Management, 8, 421-447.
Perotti, C. E., & Peter, V. O. (2001). Privatization, Political Risk and Stock Market Development in Emerging Economies. Journal of International Money and Finance,1, 43–69.