Pharmacophore
ISSN-2229-5402
Journal home page: http://www.pharmacophorejournal.com
Corresponding Author:Hamid Raza Dowlatkhah , MSC of Statistics, Department of Statistics, Jahrom University of Medical Sciences, Jahrom, Iran. MSC of Statistics, Department of Statistics, Payame Noor University, Shiraz Center, Shiraz, Iran. Email: [email protected]
PATTERNS OF HBA1C LEVEL IN DIABETIC PATIENTS USING TWO
METHODS OF REGRESSION- A CROSS-SECTIONAL STUDY
Narges Abasi1
1, Hamid Raza Dowlatkhah
2, 3*, Fatemeh shakeri
41. Associate Professor, Department of Statistics, Payame Noor University, Shiraz
Center, Shiraz, Iran.
2. MSC of Statistics, Department of Statistics, Jahrom University of Medical Sciences,
Jahrom, Iran.
3. MSC of Statistics, Department of Statistics, Payame Noor University, Shiraz Center,
Shiraz, Iran.
4. 4 MSc of Midwifery, Jahrom University of Medical Sciences, Jahrom, Iran.
A R T I C L E I N F O A B S T R A C T
Received: 24th Mar 2017
Received in revised form: 12th Jun 2017
Accepted: 21th Jun 2017 Available online: 14th Aug 2017
Keywords: Spline Regression, Linear Regression, Diabetes, HBA1C
Introduction: As a form of regression analysis, spline regression can be an appropriate method to show the relationship between predictor and response variables in nonlinear models. Spline regression is not usually used in medical sciences. This study aims to compare pattern of changes in HbA1c level among diabetic patients using two regression models together with a clustering technique. Methods: This study was done in 2013 and randomly included 834 patients who referred to Hamzeh clinic. 95 patients were involved to diabetic mellitus and entered to study. Data was collected based on demographic questionnaire and laboratory results. Data were clustered and then analyzed using simple linear regression and spline regression with and without clustering. Results: Although no significant statistical relationship was detected between HbA1C factor changes and age of diabetic patients by using Pearson correlation coefficient and linear regression, Regression spline showed statistical relationship between two factors. Conclusion: The results indicated that amount of HbA1C is indirect position with age of patients with HbA1C ≥ 14. Using a clustering technique as well as spline regression analysis to fit curves to data, changes in dependent variables can be explained better by independent variables, and a better estimate can be made compared with other linear models.
Copyright © 2013 - All Rights Reserved - Pharmacophore
To Cite This Article: Narges Abasi1, Hamid Raza Dowlatkhah Fatemeh shakeri, (2017), “Patterns Of HBA1C Level in Diabetic Patients Using Two Methods Of Regression- A Cross-Sectional Study”, Pharmacophore, 8(4), 90-94.
Introduction
analysis, which is used in many fields [6]. Gaining accurate knowledge of types of regression analysis and using them appropriately can lead to more useful and effective results. Combining clustering with spline regression, this study aims to help clinical researchers to use more powerful statistical methods instead of simple ones. On the other hand, the simulated data in this study are related to diabetes, which is known as a global public health issue.
International Diabetes Federation (IDF) estimated more than 100 million involved people suffer from this chronic disease and its annual costs is estimated $ 99 billion , increasing direct and indirect costs such as disability ,inability and premature death. Its Prevalence in the population over 30 years is 7.3% and there are nearly 3 to 4 million diabetic patients among total population of Iran [7].
Reduced metabolic ability of body is caused increasing in blood sugar level. Complications of diabetes will be appeared that can insert damages in urinary cardiovascular nerve and insight systems. Prevention of damage to body organs and reducing in concerns of patients caused by on time screening and early detection of hyperglycemia [8].HBA1C less than 7% indicate diabetes and blood sugar control [9].In fact, for effective management of diabetes, performing self-testing blood sugar and also HBA1C test regularly every 2-3 months, both are equally important [10].By measuring the level of HBA1C of patients, the doctor can make decisions about treatment goals and how to follow them. In the health systems, having information on the pattern of the disease in different age groups can help targeting the programs to control the diabetes.
Therefore, this study aims to compare pattern of changes in HbA1c level among diabetic patients using two regression models together with a clustering technique.
Materials and methods
This cross-sectional study aimed at investigating the relationship between predictor and dependent variables using simple linear regression and spline regression. HbA1c results of 834 patients referring to Hamza Clinic in Fasa were analyzed for the modeling the above-mentioned statistical methods.
Sampling was done randomly from the list of clinic. Inclusion criteria for this study were the people who referred to make up the blood sugar control using HBA1C assessment. Exclusion criteria also included the cases in which age, gender, and demographic information of patients were not fully available. The age range of the participants was 6 to 86 years of both sexes. Names of patients will remain confidential. In this study, demographic characteristics such as age, gender, marital status and place of residence and the HBA1C were obtained from the experimental results. The data was analyzed using descriptive parameters such as mean, frequency, direction compared to the HBA1C in both sexes using Mann-Whitney test. Also a suitable model and pattern of variations of HBA1C factor was provided at different ages using spline regression. All calculations were conducted using SPSS 14 statistical software and R, version 14.
Moreover, provision of an appropriate model, pattern of changes in HbA1c level at different ages, and data clustering were done using spline regression and "smooth.Spline" package in R software version 14. Calculations of the comparison between HbA1c level and demographic factors were done using SPSS 14. P values less than 0.05 was considered to be significant.
Results
The results reveal that among total number of subjects, 33.2% were male and 66.8% were female. The mean age of the sampled patients (healthy and diabetes) was 53.77 ± 13.49. 49.4% of subjects lived in the urban areas while the rest lived in the rural areas, 91.8% were also married. The prevalence of diabetes (11.4%) was obtained as 95. 42.1% of people with diabetes were male and 57.9 of them were female. The mean age of diabetic patients was 53.3±14.27. HBA1C factor had no significantly difference among diabetics in demographic factors of gender, marital status, and place of residence (P >0.05). But HBA1C factor mean was higher in diabetic men than women, in married people than single people, and in living in rural areas than urban areas [table 1].
Table 1: Comparison between demographic factors and HBA1C factor in diabetic patients using the Mann-Whitney test
Demographic factors N Mean SD z P
Gender men 40 11.95 7.47 -1.178 0.239
women 55 9.35 2.76
Marital status single 5 8.70 1.58 -0.017 0.978
married 90 10.54 5.52
place of residence rural areas 55 9.72 4.76 -0.306 0.760
urban areas 40 11.44 6.10
In Table 4 Pearson correlation coefficient and linear regression did not show a significant relationship between variations in people with diabetes HBA1C and age (r = 0.063, p-value = 0.544).
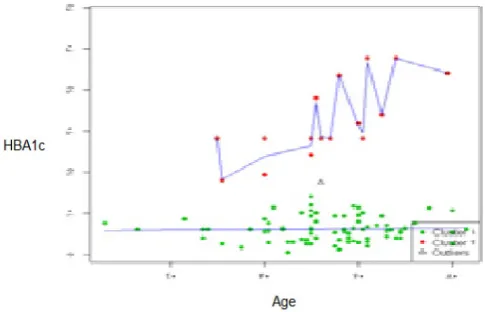
Linear regression test on the cluster1 did not show a correlation between age and HBA1C factor. In adults with HBA1C under 14, the model of HBA1C changes cannot be observed by age (P<0.001) [Figure 2). Also, linear regression models on cluster2 showed the linear relationship (P<0.001) [Figure 2). However, the linear model cannot be properly interpreted for information on cluster2. Results of R statistical software demonstrated that spline regression is a suitable replacement for nonlinear models and has accurate and scientific analytical ability required for communication between variables.
Regression Splines first automatically fit the model with degrees of freedom 14 on cluster2. It is fitted with a large swing [Figure 3].
Figure 1: Clustering Information of diabetics in terms of age and HBA1C Figure 2: linear Regression analysis in terms of age and HBA1C
Figure 3: Regression analysis between age and HBA1C on cluster1 and cluster2
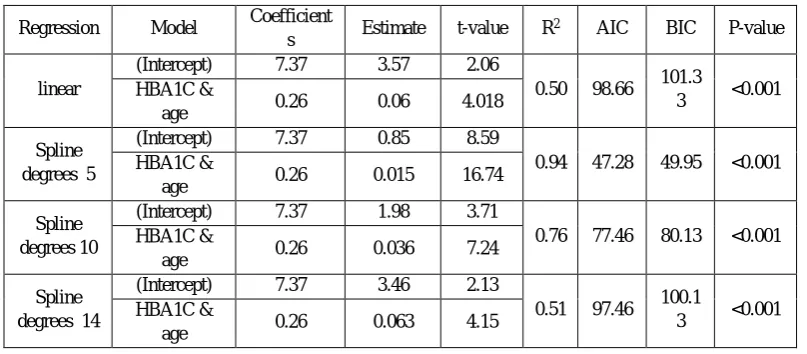
Spline regression can be calculated at various degrees of freedom (max = 14).Spline regression models with desired freedom degrees (5, 10 and 14) revealed a significant correlation between age and HBA1C factor (P<0.001) [Table 4].
The values of AIC and BIC in spline regression at lower degrees of freedom are less than in linear regression and spline regression at higher degrees of freedom. Lower degrees of freedom can show pattern of changes better. Therefore, the lower values of AIC and BIC in spline regression shows that this model is better than linear regression.
Spline regression models with 5, 10, and 14 degrees of freedom are more appropriate, respectively. Regression coefficients
(β0 and β1) were similar in all four models. Therefore, using spline regression pattern showed that the pattern of changes in
HbA1c level in diabetic patients with HbA1c levels higher than 14 progressively increases with age (diagram 4). The value of R2 in table 4 shows that spline regression model with lower degrees of freedom is more powerful than other models in explaining the relationship between predictor and response variables.
Table 4: analysis of variance model relationship between age and HBA1C factor in cluster2 based on regression spline
Figure 4: Linear spline regression line with freedom degree of 5, 10, and 14 in cluster 2 due to the variations of HBA1C and age
Discussion
This study shows HBA1C in people with diabetes by studying spline regression in the pattern of variations by age. According to the results of this study, Pearson correlation and linear regression relationship had no significant relationship between variations of HBA1C and age in people with diabetes. Using clustering techniques and dividing data into two clusters resulted in a significant relationship between age and HBA1C factor variations in diabetes in one of the clusters. This association was obtained with the use of linear regression and spline regression. This relationship suggests that people with diabetes that have HBA1C above 14, experience increase in their HBA1C by increasing age progressively. The result of this study was consistent with the results obtained by Mollashahi et al, Maracy et al [9, 12]. In the mentioned study, subjects were in age range of 30 to 79 years, and had also disabilities in changing the lifestyle and physical activities associated with the increase of their weight, depression, and job stresses [5, 8]. The age range in the present research was wider (30 to 79) and the severity of HBA1C factor in older people was progressive so that the increase in HbA1C greater than 8 was associated with mortality in patients with diabetes [13].
In the study of Ebrahimi et al, a positive and significant correlation was obtained between age and metabolic control and HBA1C also increased with increase in the age of patients which represents more poor metabolic control in older patients [17]. The result of the study conducted by Weiner and colleagues were contradicted. In their study, in healthy or diabetic groups, there was no significant relationship between age and HBA1C factor [8]. In some studies, Pearson correlation and linear regression tests were used while in some other spline regression was applied. The relationship between HBA1C and age was revealed using linear regression [16].
P-value BIC
AIC R2
t-value Estimate
Coefficient s Model
Regression
<0.001 101.3
3 98.66 0.50 2.06
3.57 7.37
(Intercept) linear
4.018 0.06
0.26 HBA1C &
age
<0.001 49.95
47.28 0.94 8.59
0.85 7.37
(Intercept) Spline
degrees 5 HBA1C & 0.26 0.015 16.74
age
<0.001 80.13
77.46 0.76 3.71
1.98 7.37
(Intercept) Spline
degrees 10 HBA1C & 0.26 0.036 7.24
age
<0.001 100.1
3 97.46 0.51 2.13
3.46 7.37
(Intercept) Spline
degrees 14 HBA1C & 0.26 0.063 4.15
The results of a study by Alimohammadi et al., which are consistent with the results of this study, showed that the smoothing spline fits a smooth curve to data better than polynomial regression for small samples and any standard deviation. However, polynomial regression is an easier and faster method for large samples [15]. Mostafa et al. showed that the results of spline regression are more reliable and efficient than simple regression in terms of model and least squares (2).
Conclusion
In the present study, linear and spline regression methods together with data clustering were used to analyze diabetes data. Using clustering technique and spline regression to fit curves to data led to the observation of a relationship between changes in HbA1c level and age among diabetic patients. This technique had not been used in previous studies. In studies in the field of medical sciences with large data, lack of relationship (without clustering) does not always mean lack of relationship in clusters. Using a clustering technique, changes in dependent variables can be explained better by independent variables, and a better estimate can be made in spline regression (with fixed regression coefficients) compared with other linear models. It is also noteworthy that spline regression has lower degrees of curve fitting than the best random regression model. Knowing the pattern of changes in HbA1c level with age, physicians and health policy makers can provide patients with better services. It is recommended that spline regression together with clustering technique should be used in the field of medical sciences and more studies in this area and about using nonparametric regression models, such as LOESS, should be carried out.
Acknowledgements:
The personnel of Hamzeh clinic in Fasa city who help us in this project are acknowledged.
References
1. Greenland, S. [1995] Dose-response and trend analysis in epidemiology: alternatives to categorical analysis.
Epidemiology, 6(4): 356-365.
2. Mustafa S, Rasheed S. [2013] A Comparison of Classical Linear Regression Approach with Spline procedure,
Middle-East Journal of Scientific Research, 17 (4): 495-499.
3. Marsh LC, Cormier DR. [2001] Spline regression models, Sage, Sep 14.
4. Vinceti M, Grioni S, Alber D, Consonni D, Malagoli C, Agnoli C, Malavolti M, Pala V, Krogh V, Sieri S. [2015]
Toenail selenium and risk of type 2 diabetes: the ORDET cohort study. Journal of Trace Elements in Medicine and Biology, 29:145-50.
5. Liang CC, Tsan KW, Ma SM, Chow SF, Wu CC. [2010] The Relationship between fasting glucose and HbA1c
among customers of health examination services. Formos J Endocrin Metab, 1(3):1-5.
6. Murphy, Kevin. [2012] Machine learning a probabilistic perspective. MIT Press, 2012. 875. ISBN 0262018020.
7. Ahmadi A, Hasanzadeh J, Rajaefard A. [2009] Metabolic control and care assessment in patients with type 2
diabetes In Chaharmahal & Bakhtiyari province 2008]. Iranian Journal of Endocrinology & Metabolism, 11(1):33-9. [Persian].
8. WinerK, Roberts N.B. [1999] Age Does Not Influence Levels of HBA1C in Normal Subject,Q jmed.;
2(2):169-173.
9. Molashahi L, Kadeh H, Saravani S, Dashipoor A.[2011] Level of Glycemic Control in Diabetic Patients Referring
to Zahedan Dental School (Iran) in 2005,J Mash Dent Sch., 35(3): 195-204.
10. Smeltzer SC, Bare BG. [2000] Brunner and Suddarth's Textbook of Medical-surgical Nursing, 9thed. Lippincott
Williams Wilkins, p. 541
11. [Rogers EA, Hessler DM. [2014] Bodenheimer TS, Ghorob A, Vittinghoff E, Thom DH. Diabetes Peer Coaching
Do “Better Patients” Make Better Coaches? The Diabetes Educator, 40(1):107-15.
12. MERACI, M., FEIZI, A. and BAGHER, N.M. [2012] Investigating the prevalence of high blood pressure, type 2
diabetes mellitus and related risk factors according to a large general study in Isfahan-using multivariate logistic regression model.
13. Skriver MV, Sandbæk A, Kristensen JK, Støvring H. [2015] Relationship of HbA1c variability, absolute changes
in HbA1c, and all-cause mortality in type 2 diabetes: a Danish population-based prospective observational study. BMJ open diabetes research & care, 3(1):e000060.
14. Rogers EA, Hessler DM, Bodenheimer TS, Ghorob A.[2014] Vittinghoff E, Thom DH. Diabetes Peer Coaching
Do “Better Patients” Make Better Coaches? The Diabetes Educator, 40(1):107-15.
15. Ali mohamadi R. [1998] Compare spline regression and polynomial regression and its application,Master's thesis,
Tarbiat Modarres University.
16. Eldeirawi K, Lipton R. [2003] Predictors of Hemoglobin A1c in a National Sample of Nondiabetic Children The
Third National Health and Nutrition Examination Survey, 1988–1994. American journal of epidemiology, 157(7):624-32.
17. ebrahimi H, sadeghi M, bagheri H. [2014] metabolic control and its related factors in diabetic patients. Nursing