GSJ: Volume 7, Issue 1,
January
2019, Online: ISSN
2320
-9186
www.globalscientificjournal.com
T
HE
E
FFECT OF
D
IFFERENT
P
ACKAGING
T
YPES ON THE
Q
UALITY OF
S
HREDDED
T
ILAPIA
D
URING
S
TORAGE AT
R
OOM
T
EMPERATURE
Muhamad Syarif Maulana
1, Iis Rostini
2, Eddy Afrianto
2, and Nia Kurniawati
21
Student in Faculty of Fishery and Marine Science Universitas Padjadjaran
2
Lecturer in Faculty of Fishery and Marine Science Universitas Padjadjaran Faculty of Fishery and Marine Science Universitas Padjadjaran
JL. Raya Jatinangor KM. 21 Sumedang
Correspondence e-mail : [email protected]
KeyWords
Shredded tilapia, HDPE, LDPE, alumunium foil, peroxide number, preference level
ABSTRACT
INTRODUCTION
Tilapia (Orechromis niloticus) is a freshwater fish that is widely cultivated in Indonesia and is a cultivated fish which is one of the export commodities. Tilapia is quite popular because the price is affordable, has high protein content, and the characteristics of the meat is savory taste, thick, delicious aroma, soft and coarse texture. With this in mind, many businesses start making processed fishery products with raw materials of tilapia. One of the tilapia-based food products that are being produced by the Indonesian people is shredded tilapia.
Shredded tilapia is one of the processed food products that has been known by the people of Indonesia and abroad. Shred-ded tilapia is a type of processed food made from tilapia which is processed through a steaming and frying process by adding various kinds of herbs and spices to obtain a distinctive taste that is delicious and has a longer shelf life (durable). By utilizing packaging, the shelf life of the shredded tilapia will be longer and not easily contaminated during the storage period.
During the storage period, shredded fish will continue to experience a decrease in quality due to physical, chemical, and bio-logical changes that occur in shredded meat during storage. As stated by Sudarmadji (2003) that during storage, food products con-taining fat or oil will usually experience a process of rancidity during the storage process. The speed of the rancidity process on shredded meat during the shelf life can be controlled by selecting the appropriate type of packaging.
The shelf life of a food product is influenced by the packaging and temperature of the environment. During the storage peri-od, the room temperature of the shredded tilapia product ranges from 25oC - 27oC. The function of a product packaging is to main-tain the freshness of food products, provide convenience in storage or distribution, suppress or inhibit the occurrence of contamina-tion from air, water, and its surroundings by microorganisms, and entice consumers (Sauvage 1996).
According to Jayadi (2016), one type of packaging that is often used by home industries in packaging shredded fish is poly-ethylene plastic packaging which has a thickness of 0,0001 to 0,01 inc, as a food packaging, because of its characteristics which are thermoplastic, polyethylene, which is easily made into bags with a good degree of density. Aluminum foil is also widely used by home industries because the characteristics of aluminum foil are hermestic, flexible, and not translucent. Therefore, to be able to maintain the quality of shredded fish, the type of packaging and storage temperature must receive special attention (Afrianto 2005). The use of the type of packaging material is of course adapted to the characteristics of the packaged material. Each types of packaging mate-rial will have a different effect on the packaged product (Makinde et al. 1976).
Based on the description above, the purpose of this research is to determine the different types of packaging for the quality of shredded tilapia during storage at room temperature. This research is expected to provide information to the public regarding the types of plastic packaging and aluminum foil that have the ability to maintain the quality of shredded tilapia product properly and optimally during the shelf life.
METHOD OF RESEARCH
Research on place and time
This research was conducted from April to May 2018 at the Fisheries Product Processing Laboratory of the Faculty of Fisheries and Marine Sciences Universitas Padjadjaran for the manufacture of shredded tilapia and organoleptic testing. Peroxide number testing was carried out at the Food Technology Laboratory, Faculty of Engineering Universitas Pasundan.
Research method
This research consists of four stages, namely handling fish, making shredded tilapia, packaging products, and storing products and observations. Observations were made on the level of preference which included appearance, aroma, texture, and taste by semi-trained panelists and analysis of peroxide figures on shredded tilapia.
Fish Handling: Fishes purchased at the Caringin Jatinangor market were then washed, weeded (separation of scales, fins, gills and skin) and calculated for the total weight of fish meat. Making shredded tilapia: Performs the formulation or calculation of
the weight of meat and seasonings used, and performs the procedure for making shredded tilapia according to the modified method Hardoko et al. (2015).
Packaging and Storage: Packaging is done at THP FPIK Laboratory UNPAD and uses three different types of packaging.
Shredded tilapia in three (3) different types of packaging were stored in an incubator at 25oC. Observations: Parameters observed
included peroxide number analysis at the Food Technology Laboratory, Faculty of Engineering Universitas Pasundan, and organoleptic tests (hedonic tests) at Fisheries Product Processing Laboratory of the Faculty of Fisheries and Marine Sciences Universitas Padjadjaran.
The method used in this study was an experimental method with 3 treatments and 20 panelists as replications. The treatments used are different types of packaging, namely:
1) Treatment A : Aluminium foil packaging. 2) Treatment B : HDPE plastic packaging. 3) Treatment C : LDPE plastic packaging.
Tools and Materials
The tools used in this research were mortar, knife, cutting board, press tool, pan, filter, spatula, basin, HDPE plastic, LDPE plastic, aluminium foil, test level questionnaire forms, stationery, plates, label paper, and cups. The materials used in this research were tilapia, tamarind, red onion, garlic, granulated sugar, salt, coriander, galangal, coconut milk, lime leaves, bay leaves, lemongrass, and cooking oil.
Peroxide Number
In conducting observation, the researcher used the storage time for 1 day, 10 days, 20 days, 30 days, and 40 days. The per-oxide number is the amount of milliequivalent perper-oxide in 1000 grams of fat. Perper-oxide numbers are the most important value for determining the degree of damage to oil or fat. Peroxide numbers indicate that fat or oil contained in shredded tilapia has been oxi-dized or not. Unsaturated fatty acids can bind oxygen to their double bonds to form peroxide.
The calculation of the formula in peroxide number analysis is as follow:
( )
Description :
meq/kg = levels of peroxide number
ml Na2S2O3 = titration volume of Na2S2O3
N. Na2S2O3 = normality of Na2S2O3 solution
Organoleptic Test
Observation of shredded tilapia product aims to determine the product characteristics using the five human senses for ap-pearance (eyes), aroma (nose), texture (touch) and taste (tongue). Assessment of organoleptic properties can be done by testing the questionnaire contained in the test of preference level. The organoleptic test used is the hedonic test which is a test of the level of preference for appearance, aroma, texture, and taste. This hedonic test will then be analyzed using the Friedman test.
The hedonic testing method, namely the panelists, assessed the condition of the quality of the organoleptic shredded tilap-ia by providing a predetermined value. The value of the questionnaire ranges from 1-9, which is 1 (very dislike), 3 (dislike), 5 (neutral / normal), 7 (likes), 9 (very like). The rejection limit for this product is ≤ 3, meaning that if the product tested gets a value equal to or smaller than 3 then the product is declared not accepted by the panelist (Soekarto 1985). The number of panelists used in the study was 20 semi-trained people. The Friedman test was conducted to find out the differences of more than two sample groups that are interconnected (Soekarto 1985).
The hedonic test results would be analyzed using the Friedman test to find out the differences of more than two sample groups that are interconnected (Soekarto 1985). The statistics used in the Friedman test are defined by the following formula:
( ) ∑( ) [( )( )]
Description :
Xr2 = Friedman test statistics
b = Number of replications
k = Number of treatments
Rj2 = Total rank for each treatments
If there is the same number, a correction factor (FK) is calculated using the following formula:
∑
( )
The significant value of the observation of X_c ^ 2 can be known using the Chi-square critical value table with db = k-1; α = 0.05. The rules of decision to test hypotheses are :
H0: Treatment does not give a significant difference at the level of α = 0.05.
H1: Treatment gives a significant difference at the level of α = 0.05.
If the value is X_r ^ 2 <X_ (r (k-1)) ^ 2 then H0 is accepted and H1 is rejected. Whereas if the value of X_r ^ 2> X_ (r (k-1)) ^ 2, H1 is accepted and H0 is rejected. If the H0 treatment provides a real difference, then it will be followed by a multiple comparison test. This test was conducted to determine the differences between treatments.
| | [
( )] √
( )
Description :
│Ri-Rj│ = Difference in average rank
Ri = Average rating of the i-th sample
Rj = Average rating of the j-th sample
a = Wise error experiment
b = Number of data or replication
k = Number of treatment
z = Value in table Z is for multiple comparison tests
The decision of the panelists' assessment of the preferred shredded tilapia product was carried out in a pairwise compari-son then Bayes method was used to determine the best treatment. Calculations when combining data for each criterion using the geometric average formula, is as follows:
√
Description :
XG = Geometric Average
π = Permutation
n = Number of total panelists
xi = Assessment by the i-th panelists
RESULT AND DISCUTION
Appearance
Based on the results of the analysis, the value of the appearance of shredded tilapia packed for 40 days is presented in Figure 1.
Figure 1. Appearance Value of shredded Tilapia
Based on the results of the hedonic test on the appearance of shredded tilapia, the median value of appearance ranged from 5 to 9. The highest median value was 9 on day 0 (organoleptic testing) in each treatments with a specific type of brown color, homogeneous fiber, and very bright colors. Meanwhile the lowest median value is 5 at the 40th day of shredded tilapia storage in each treatments with the appearance of brown color is not specific, the fiber is not homogeneous, and the color is less brilliant. The median value of appearance tends to decrease from day 0 to day 40 of storage. This is because the shredded tilapia has decreased in quality in each packaging treatments.
Based on the Friedman test, it is shown that all treatments were not significantly different, meaning that all packaging treatments of aluminium foil, HDPE, and LDPE did not have a significant effect on the appearance of shredded tilapia according to the panelists' assessment. The longer the storage time, the color of the product will usually be more dull with no specific type of brown. The appearance value of each treatments produced by shredded meat occurs because of the mailard reaction during frying. The mailard reaction occurs in materials that contain sugar and high protein which are warmed up, causing a brown color (Winarno 1997). The mailard reaction is a reaction between reducing sugars and a primary amine group that produces a brown color called melanoidin (Winarno 1997).
0 1 2 3 4 5 6 7 8 9 10
ke 0 ke 10 ke 20 ke 30 ke 40
Median
Storage Duration in Days
Appearance Value of Shredded Tilapia
A (Alumunium Foil) B (HDPE) C (LDPE)
Aroma
Based on the results of the analysis, the aroma value of packaged shredded tilapia for 40 days is shown in Figure 2 below.
Figure 2. Aroma Value of shredded Tilapia
Based on the hedonic test results on the aroma of shredded tilapia, the median aroma value ranged from 5 to 9. The highest median value was 9 on day 0 (organoleptic testing) in each treatments with a specific aroma of shredded tilapia which was very strong. Meanwhile the lowest median value is 5 at the storage of shredded tilapia on the 40th day in each treatments with a specific aroma which is less/not strong and starts to emit some rancid odor. The median value of aroma tends to decrease from day 0 to day 40 of storage. This is because the shredded tilapia has decreased in quality in each packaging treatments.
Based on the Friedman test, it is shown that all treatments were not significantly different, meaning that all treatments for packaging aluminium foil, HDPE, and LDPE did not have a significant effect on the aroma of shredded tilapia according to the panelists' assessment. The longer the storage time of shredded meat, the specific aroma of shredded fish will become more unspecific and start to smell rancid. According to Suryani (2007) shredded fish is a type of processed food fish that is given spices, processed by steaming and frying. The distinctive aroma of shredded fish is obtained because shredded tilapia is flavored with natural herbs such as onion, gar-lic, coriander powder, galangal, tamarind, sugar, salt, bay leaves, lemongrass, lime leaves, and liquid coconut milk. The aroma of fish
does not dominate because during the steaming process, the fish meat is steamed for 10 to 20 minutes at a temperature of 100oC, and
during the stirring process, bay leaves, lemongrass, and lime leaves that are known to mitigate the thick fishy smell of fish were added. The aroma that is favored by panelists is what is called the aroma of shredded tilapia.
Value differences can occur because the LDPE packaging material during storage is susceptible to being traversed by water and gas vapor. This makes it unable to maintain the aroma characteristics of Shredded tilapia as well as HDPE and aluminum foil packaging. The permeability of water and gas vapor, as well as the surface area of the packaging affect the amount of gas that is good and the small surface area causes a longer shelf life of the product. During the storage period, aluminium foil can maintain the aroma of shredded tilapia because it has hermitic properties/is not easily traversed by gas.
0 1 2 3 4 5 6 7 8 9 10
ke 0 ke 10 ke 20 ke 30 ke 40
Median
Storage Duration in Days
Aroma Value of Shredded Tilapia
A (Alumunium Foil) B (HDPE) C (LDPE)
0th 10th 20th 30th 40th
Texture
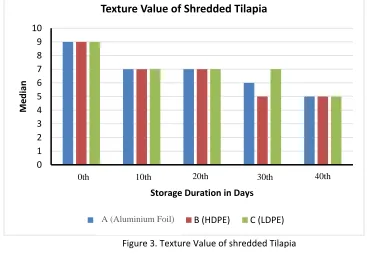
Based on the results of the analysis, the texture value of packaged shredded tilapia for 40 days is shown in Figure 3 below.
Figure 3. Texture Value of shredded Tilapia
Based on the hedonic test results on the texture of shredded tilapia, it has a median texture value ranging from 5 to 9. The highest median value was 9 on day 0 (organoleptic testing) in each treatments with dry and not clumping texture. Meanwhile the lowest median value was 5 at the 40th day of shredded tilapia storage in each treatments with dry but lumpy texture. The median value of tex-ture tends to decrease from day 0 to day 40 of storage. This is because the shredded tilapia has decreased in quality in each packaging treatment.
Based on the Friedman test, it is shown that all treatments were not significantly different, meaning that all treatments for packaging aluminium foil, HDPE, and LDPE did not have a significant effect on the texture of shredded tilapia according to the panelists' assessment. The longer the storage time of shredded tilapia, the dry, fibred, and non-clumping texture will become moist, less soft-fibred, and lumpy. The dry texture was obtained from the frying process of shredded tilapia using the technique of deep frying and has-tened through an oil pressing process contained in shredded tilapia. In this pressing process a fork was used as a shredded tilapia stirrer which had been separated from the oil. The stirred dough looked fibrous but when it was held it felt dry and soft-fibred.
Naturally, aluminium foil and HDPE and LDPE plastic affect the texture of shredded tilapia. In the observation of shredded tilap-ia which was packed on the 40th day, the shredded meat felt dry and tend to be moist and there was clumping of fibers, and the pres-ence of oil content was felt. The texture of shredded tilapia became lumpy due to the shredded tilapia being moist due to the prespres-ence of trapped air on each packages. The trapped air would enter into the shredded tilapia fiber and unite the shredded tilapia fiber con-tained in the oil. So that during organoleptic testing, it was found that some shredded fibers were fused/clumped but when held they felt oily and when frictioned the fibers became separated.
0 1 2 3 4 5 6 7 8 9 10
ke 0 ke 10 ke 20 ke 30 ke 40
Median
Storage Duration in Days
Texture Value of Shredded Tilapia
A (Alumunium Foil) B (HDPE) C (LDPE)
0th 10th 20th 30th 40th
Taste
Based on the results of the analysis, the taste value of packaged shredded tilapia for 40 days is shown in Figure 4 below.
Figure 4. Taste Value of shredded Tilapia
Based on the results of the hedonic test on the taste of shredded tilapia, it has a median taste value ranging from 5 to 9. The highest median value was 9 on day 0 (organoleptic testing) in each treatments with a specific taste of shredded fish was very pro-nounced. Meanwhile the lowest median value was 5 at the 40th day of shredded tilapia storage in each treatments with specific charac-teristics of shredded fish was less pronounced. The median value of taste tends to decrease from day 0 to day 40 of storage. This is be-cause the shredded tilapia has decreased in quality in each packaging treatments.
Based on the Friedman test, it is shown that all treatments were not significantly different, meaning that all treatments for packaging aluminum foil, HDPE, and LDPE did not have a significant effect on the taste of shredded tilapia according to the panelists' assessment. The longer the storage time of shredded tilapia, the specific taste of shredded fish is less pronounced. The taste possessed by shredded tilapia occurs because of the addition of natural spices at the time of sauttering of fish meat that had previously been steamed. In the presence of heat from a little oil, spices such as red onion, garlic, coriander powder, galangal, tamarind, sugar, salt, bay leaves, lemongrass stems, lime leaves, and liquid coconut milk could be absorbed in the fish meat, so that during the process the fishy smell of fish was not smelled. The use of sugar, salt, and liquid coconut milk as additives for shredded tilapia flavor was felt to have a deeper contribution in determining the characteristics of shredded flavor. The frying process carried out causes the sugar to be ab-sorbed and produce a specific brown color. The heated sugar will produce caramelization, so the shredded fish products would have a savory taste that tends to be sweet which is typical of shredded fish.
According to Meity (2016), the process of spreading heat quickly with high temperatures will help to accelerate the process of releasing volatile compounds so that the undesirable flavor of fresh fish such as the fishy smell of fish will decrease. This is in accord-ance with Herliani's statement (2008) that taste can be influenced by heating or processing that is carried out resulting in the degrada-tion of the preparadegrada-tion of taste and physical properties of food ingredients.
According to Ketaren (1986), the savory flavor of shredded fish is obtained because during the frying process, some of the oil enters into the food ingredients and fills in the empty space which was originally filled with water. As well as the shredded tilapia tested in this research, it is still suitable for consumption because it still tastes sweet, with savory tendency. In storing shredded fish with room
temperature (28oC), polyethylene packaging with water-resistant characteristics and has a good degree of density should be used
(Jaya-di 2016).
0 1 2 3 4 5 6 7 8 9 10
ke 0 ke 10 ke 20 ke 30 ke 40
Median
Storage Duration in Days
Taste Value of Shredded Tilapia
A (Alumunium Foil) B (HDPE) C (LDPE)
0th 10th 20th 30th 40th
A (Aluminium Foil)
Bayes Method
The calculation results on the weight of the appearance, aroma, texture, and taste criteria of shredded tilapia are presented in Table 1.
Table 1. Abon Nila Criteria Weight Score
Criteria Criteria Weight
Appearance 0,14
Aroma 0,20
Texture 0,12
Taste 0,54
Based on the calculation of the appearance, aroma, texture, and taste of shredded tilapia, the highest number of criteria weights was obtained in the taste parameter of 0.54, which means that the taste parameter is the most important assessment or as the main consideration according to the panelists in choosing shredded tilapia products. The second most important parameter is aroma followed by appearance and texture in a row with the weight values of criteria 0.20, 0.14, and 0.12. Since taste has the highest criterion of weight value, the panelists feel that if they dislike the shredded tilapia taste, it means the product will not be accepted or rejected by the panelists even though other judgments are good.
The calculation results in determining the best treatment using the Bayes method by considering the criteria for appearance, aroma, texture, and taste of shredded tilapia are presented in Table 2.
Table 2. Shredded Tilapia Assessment Decision Matrix with Bayes Method
Treatment Criteria Alternative
Value
Priority Value
Appearance Aroma Texture Taste
Alufo 5 5 5 5 5,00 0,33
HDPE 5 5 5 5 5,00 0,33
LDPE 5 5 5 5 5,00 0,33
Criteria
Weight 0,14 0,20 0,12 0,54 15,00 1,00
Based on the calculation of the Bayes method, it was found that shredded tilapia in each treatments was the treatment favored by panelists based on hedonic tests because it had an alternative value and the same priority values which were 5.00 and 0.33 in each organoleptic characteristics. This alternative value and priority value is calculated by sample on the 40th day data storage of shredded tilapia. Shredded tilapia which is stored for 40 days using aluminum foil, HDPE, and LDPE packaging is still preferred by panelists with a median value of 5 and the weighted criteria for taste criteria are 0.54.
Peroxide Number
The results of peroxide number analysis are presented in Table 3 and Figure 5 below.
Table 3. Results of Analysis of Peroxide Numbers in Shredded Tilapia
No. Storage Days Aluminium
Foil (meq/kg)
HDPE (meq/kg)
LDPE (meq/kg)
1. 0 0 0 0
2. 10 19,02 9,33 27,61
3. 20 23,57 13,95 32,54
4. 30 29,87 20,02 39,71
Figure 5. Results of Analysis of Shredded Tilapia Peroxide Numbers
The results showed that HDPE plastic produced the lowest peroxide number per week, i.e 9.33 meq/kg at 10th day storage, 13.95 meq/kg at 20th day storage, 20.02 meq/kg at 30th day storage and 24.39 meq/kg at 40th day storage in storage at room
tem-perature (25oC). This can occur due to HDPE plastic having a good degree of density, material properties that are stronger than other
polyethylene materials, thermoplastic or plastic types that can be recycled, opaque/very light translucent, resistant to chemicals and liquids, and resistant to high temperature compared to other polyethylene materials (Firman 2012).
The results of the analysis of shredded tilapia peroxide number with aluminium foil packaging materials generate peroxide figures of 19.02 meq/kg at 10th day storage, 23.57 meq/kg at 20th day storage, 29.87 meq/kg at 30th day storage and 34.11 meq/kg
of storage at 40th day at room temperature (25oC). According to Buckle et al (1985) aluminium foil packaging material has superior
properties than plastic, which is more airtight resistant to high temperatures, fat, water and acid, non-toxic and hygienic, does not absorb light but reflects light, slippery and easily formed. Syafrudin (2000) added that the effect of light in fat-containing foods can be eliminated by coating the outer part of the packaging material using tin foil or opaque materials. This is what underlies that alu-minum foil packaging material is still able to maintain shredded tilapia products for 40 days, because there are no indications of ran-cidity.
The results of the analysis of shredded tilapia peroxide number with LDPE plastic packaging material generated the largest peroxide number per week, namely 27.62 meq/kg at 10th day storage, 32.54 meq/kg at 20th day storage, 39.71 meq/kg at storage
of 30 days and 45.09 meq/kg of storage for 40 days at room temperature (25oC). This can happen because LDPE plastic has a slightly
translucent material, is easy to absorb water and air so it is not good to be used as an oily food packaging material, flexible with fatty
surfaces, softens at 70oC, easily scratched until damaged/easily torn (Word, 2012). The ability of LDPE plastic to maintain shredded
tilapia products at room temperature is considered to be less than the HDPE and aluminum foil plastic packaging materials when viewed from the results of peroxide number testing.
Good quality oil is an oil with a peroxid content of 5 meq/kg (RI Food and Drug Monitoring Agency 2011). According to Keta-ren (1986), if the amount of peroxide in food material is greater than 100 meq/kg, it will be very smelly and cannot be consumed. The high number of peroxides in the oil content in shredded tilapia is due to the oxidation process during the cooking or storage process, so that peroxide is formed. The reaction of peroxide formation in oil is caused by an oxidation reaction by oxygen with a number of unsaturated fatty acids. From the analysis of shredded tilapia peroxide numbers with various time deposits, it is known that the shredded tilapia in this research is still good for consumption because it has a low peroxide number (9.33 meq/kg-45 meq/kg) below the 100 meq/kg rancidity limit and does not show an indication of a rancid odor.
0 5 10 15 20 25 30 35 40 45 50
0 10 20 30 40
meq
/kg
Storage Duration in Days
Results of Analysis of Shredded Tilapia Peroxide Numbers
Alumunium FoilA (Aluminium Foil) HDPE LDPE
Conclusion
Based on the research results, all treatments are still favored by panelists, but the treatment of LDPE plastic packaging is the pre-ferred treatment by panelists. Peroxide number analysis results show that the treatment that has the smallest peroxide number eve-ry week is HDPE treatment, with a storage value of 10 days peroxide number 9.33 meq/kg, 20 days storage 13.95 meq/kg, 30 days storage 20.02 meq/kg and storage 40 days 24.39 meq/kg.
References
[1] Afrianto E,Liviawaty E. 2005. Pengawetan pangan dan Pengolahan Ikan. Kanisius. Yogyakarta.
[2] Buckle, A.R.A. Edwards. F.G. Feed and Wooton. 1985. Ilmu Pangan Terjemahan dari Parakasih. P.A UI Press. Jakarta.
[3] Departemen Kesehatan RI. 1998. Peraturan Menteri Kesehatan Republik Indonesia No.722/Menkes/Per/IX/88 Tentang Bahan Tambahan Makanan.
Dep.Kes.RI, Jakarta. 7 Hlm.
[4] Firman. 2012. Pengaruh Jenis Plastik Pembungkus Pada Penyimpanan Buah Rambutan (Nephelium lappaceum, Linn). Skripsi. Universitas
Has-sanudin. Makassar.
[5] Jayadi, Antri., Anwar, Badaruddin & Sukainah, Andi. 2016. Pengaruh Suhu Penyimpanan dan Jenis Kemasan Terhadap Mutu Abon Ikan Terbang.
Jurnal Pendidikan Teknologi Pertanian. FT UNM.
[6] Ketaren, S. 1986. Pengantar Teknologi Minyak dan Lemak Pangan. Universitas Indonesia Press, Jakarta.
[7] Makinde, M. A., Gilbert, S. G & Lacahce, P. 1976. Nutritional Implications of Packaging System Food Product. J. Food Packaging 9:112-123.
[8] Meity, M, Mus, S dan Buchari, D. 2016. The Effect Of The Temperature And Frying Time On The Quality Of Spice Shredded. Jurnal Online
Maha-siswa (JOM). Riau.
[9] Sauvage, F. 1996. The Marketing aspect Of Packaging. Dalam. Bureau, G & Multon, J.L (pnyt). Food Packaging Technology. Hlm. 33-41. Amerika : VCH
publishers inc.
[10] Soekarto. 1985. Penilaian Organoleptik Untuk Industri Pangan dan Hasil Pertanian. Bhatara Aksara. Jakarta.
[11] Suryani A., Erliza H. dan Encep H. 2007. Membuat Aneka Abon. Penebar Swadaya. Jakarta.
[12] Sudarmadji, S., B. Haryono dan Suhardi. 2003. Analisa Bahan Makanan dan Pertanian. Pusat Antar Universitas Gadjah Mada. Liberty. Yogyakarta
[13] Syafrudin, K. 2000. Teknologi Minyak dan Lemak. Fakultas Pertanian. UNAND.
[14] Winarno, F.G, dan S.Fardiaz .1980. Pengantar Teknologi Pangan. Gramedia. Jakarta.