Species Identification Using Part of DNA Sequence:
Evidence from Machine Learning Algorithms
Taha Alhersh
Telemedicine Multidisciplinary Research Platform Monash University Malaysia
[email protected]
Abdullah Alorainy
King Abdulaziz City for Science andTechnology
[email protected]
Brahim Belhaouari Samir
Department of MathematicsSharjah University
[email protected]
Hamada R. H. Al-Absi
Faculty of Engineering, Computingand Science
Swinburne University of Technology Sarawak Campus
[email protected]
Belloui Bouzid
University of Hafr Al Batin[email protected]
ABSTRACT
In biological studies, species identification is considered one of the most important issues. Several methods have been suggested to identify species using the whole DNA sequences. In this study, we present new insights for species identification using only part of the DNA sequence. The Clustering k-Nearest Neighbor (K-C-NN) and Support Vector Machine (SVM) classifiers were used to test and evaluate the improved statistical features extracted from DNA sequences for four species (Aquifex aeolicus, Bacillus subtilis, Aeropyrum pernix and Buchnera sp). The results show that part of DNA sequences can be used to identify species.
Categories and Subject Descriptors
I.5.1 [Pattern Recognition]: Models – Statistical.
I.5.2 [Pattern Recognition]: Design Methodology – Feature
evaluation and selection, Pattern analysis.
I.5.3 [Pattern Recognition]: Clustering – Similarity measures.
J.3 [Computer Applications]:Life and Medical Sciences –
Biology and genetics.
General Terms
Measurement, Design.
Keywords
Machine learning, Species identification, DNA sequences, Feature selection.
1.
INTRODUCTION
DNA sequences analysis helps in determining sequence functions which decode the roles played in the organisms, identifying unknown specimens via DNA barcoding, and in DNA taxonomy, where DNA sequences themselves serve as taxonomic reference system. Organisms’ identification considered to be a primary
problem in biological research. Morphological characters have traditionally played a primary role in species identification and classification. Nevertheless, DNA sequences are increasingly used to identify species [1], [2]. Identification of species using DNA sequences, considered similar to identification of trade products using Universal Product Codes, is commonly referred to as the ‘‘DNA barcoding’’ approach.
For instance, Whole-cell spectra produced by MALDI-TOF MS to have taxonomically characteristic features have been evaluated using two popular machine learning techniques for identification purposes: support vector machines (SVMs); and random forests (RFs) to differentiate bacteria at genus, species and subspecies levels [3]. In their work [4], Levy et al. have increased the efficiency of DNA sequences classification using log-ratio landscapes comparison by constructing directed, acyclic word graphs (DAWGs) of all sequences and databases.
DNA sequences vary in their lengths. Numerical characterization of the biological data could be the first step to analyze it, including suitable feature extraction and selection methods to reduce the length of the vector to minimize computational cost. For instance, DNA sequence has been characterized in twelve-dimensional vectors [5]. Based on frequency distribution characteristics of DNA sequences, the DNA sequences features could be drown out as a sixteen-dimensional vector of each DNA sequence which represent the sequence feature [6].
Feature extraction in DNA sequence could be influenced by various aspects and perspectives. Many feature extraction methods have been proposed. For example; DNA Sequence symmetry [7], Fourier transform based on the lengthen-shuffle [8], the frequency distribution of DNA double nucleic acids, locating the binding sites of promoter sequence [9], and dinucleotides compositions [10].
This study presents new insights for species identification using part of DNA sequences. Classification approaches have been applied on different parts of the DNA sequences. Statistical features have been extracted and tested on various parts of the DNA sequences. The Cluster k-Nearest Neighbor classifier [7,8,9] and Support Vector Machine [11], [12] classifiers were applied to classify the feature vectors extracted to obtain a species decision.
BICT 2015, December 03-05, New York City, United States Copyright © 2016 ICST
2.
MATERIALS AND METHODS
2.1
Dataset
The DNA sequences for this study have been adopted from [6] and have an average length of 288 nucleotides for four different types of species (Aquifex aeolicus, Bacillus subtilis, Aeropyrum pernix and Buchnera sp). The dataset can be downloaded from:
(ftp://ftp.ncbi.nih.gov/genbank/genomes/Bacteria/).
Figure 1. Phylogenetic tree of dataset
Table 1 illustrates more information about the dataset used in this study, while Figure 1 shows phylogenetic tree of the dataset. The total number of DNA sequences for the four different species are 317.
Table 1. Dataset description Description of the dataset Species Accession Number
of Sequences
Averaged length
Aquifex aeolicus
AE000657 51 256.0196
Bacillus subtilis AL009126 178 349.0112 Aeropyrum
pernix
BA000002 52 175.2885
Buchnera sp BA000003 36 201.9167
2.2
Feature extraction
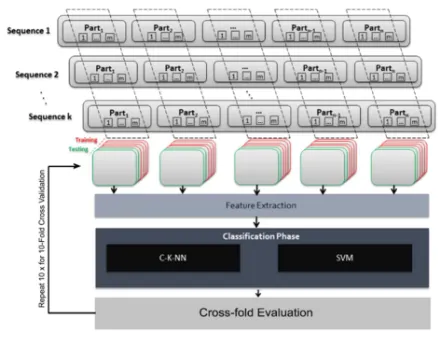
For each DNA sequence, features from statistical properties have been extracted. In order to formulate a statistical analysis for the DNA sequences, the distribution of A, T, C and G nucleotides has to be mathematically described. Figure 2 shows the classification model including sequence partitioning, feature extraction, classification and cross-fold evaluation steps.
Figure 2. DNA sequences classification model
The first step is dividing the DNA sequence into n parts, in order to examine each part of the DNA sequence. Each nth part is split into m parts, not matter how different the nth part of the original sequences is. Though, more information about the sequence could be constructed through the inter-variation of the mean (µ) and the standard deviation (σ). After that, for each part(i, j) where,
i ∈ n and j ∈ m. The total number of the nucleotides A, T, C, and G take place at the characterization vector as a second step. The third step is measuring the total distances of each nucleotide base to the first nucleotide. The distribution of each nucleotide along the DNA sequence will be calculated in the fourth step. More mathematical representation and information about steps two to four can be found in Liu et al. work [5].
The fifth step; for each nucleotide A, T, C, and G in each DNA sequence, the total distances between each two successive nucleotides has been summed as in equation (1). Also, it will be reflected on the distribution formula in equation (2). This attribute is a distinct characteristic for sequences. Supposing two sequences would have the same number of a specific a nucleotides, and assuming both of them have a relatively close distances from the first nucleotide; this characteristic will give more distinction between the two sequences. The total distances between any two successive nucleotides could be given as the following formulas:
Let , 1 1, , , !,
"# $%
#&
1
where, t( is the distance from the first nucleotide to the jth nucleotide i in the DNA sequence.
Then, the variance D( of distance for each nucleic base used to describe the distribution is defined as following:
* "+# , -1 $%
#&
2
where, denotes the number of nucleic bases A, T, C and G of the DNA sequence, and , defined as:
, " # $%/
#&
Hence, each DNA sequence will be represented by a 16×n×m-dimensional vector. In our experiment we have tried different combinations of n and m – as discussed in the results part. The best estimation of n and m is by assuming that n = 5 and m = 2. Each nth part of the corresponding feature vector will have 32-dimension. The similarity and the differences between DNA sequences parts will be measured using the corresponding numerical vectors. Consequently, a numerical dataset of all parts of the DNA sequences is constructed. The next step is to fetch the feature vectors into the classifiers.
2.3
Cluster-K-Nearest Neighbor (C-K-NN)
Cluster-K-Nearest Neighbor (C-K-NN) [13], [14] is a classifier that combines two algorithms; the K-means modified algorithm [15] and the K-Nearest neighbor. Data is clustered into classes and sub-classes with a centre point to represent each class using K-means. While K-Nearest Neighbor is used to classify new data by calculating the Euclidean distance between the centre point of each class and the new data. K-means clustering algorithm is applied for each class for clustering purposes, then, the number of subclasses for each class and the initial k-vectors will be defined, to initialize the K-means cluster algorithm. The previous two steps will allow the cluster analysis to identify a set of groups, which minimize the within-group variation and maximize the between-group variation.
2.4
Support Vector Machine (SVM)
Support Vector Machines (SVM’s) are learning method introduced by Vladimir Vapnik and colleagues. The earliest mention was in [16], but the first main paper seems to be [17]. It is used for binary classification when the data has exactly two classes. The basic idea is to find a hyperplane which separates the d-dimensional data perfectly into its two classes. The best hyperplane for an SVM means the one with the largest margin between the two classes. Margin means the maximal width of the slab parallel to the hyperplane that has no interior data points. However, since example data is often not linearly separable, SVM’s introduce the notion of a “kernel induced feature space” which casts the data into a higher dimensional space where the data is separable.
3.
RESULTS
Statistical information extracted from the DNA sequences in the previous feature extraction was used to report the results in this section. The evaluation of (feature selection and classification) carried out inside a 10-fold cross-validation on all species from the dataset to avoid the so-called selection bias. Accuracies from different parts of the DNA sequences of the dataset have been estimated in one-to-one species classifications. The results are presented as follows:
3.1
C-KNN
Despite the variation in the DNA sequences lengths, C-K-NN showed the ability to distinguish each two families by using only 20% of the DNA sequence. The classification accuracy achieved ranged from 73.72 % - 91.82% as shown in Figure 3. This experiment has provided clear evidence that part of the DNA sequence can be used for species identification.
Figure 3. Classification accuracies for different parts of the DNA sequences from one to one species evaluation experiment
using C-K-NN
3.2
SVM
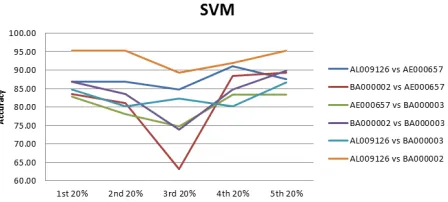
In this section, SVM classifier has been applied to identify specie vs specie combinations. Figure 4 shows the classification accuracies which range from 66.11% for the third 20% part between species with accession numbers (AL009126 vs BA000002) and 95.22% for the first 20% part of species with accession numbers (BA000002 vs AE000657).
Figure 4. Classification accuracies for different parts of the DNA sequences from one to one species evaluation experiment
using SVM
SVM also shows that part of DNA sequence can be used for species identification.
Figure 5. Averaged accuracy for species identification using different parts of DNA sequence (10%, 20% and 50%) using
SVM
Figure 6. Species identification elapsed time using 20%, 50% and 100% (whole sequence) of DNA sequence via SVM
classifier
On the other hand, using only part of the DNA sequence will reduce the overhead calculation time. Figure 6 illustrates the elapsed time needed to classify different parts of DNA sequence. Classification time ranged from 43.55 milliseconds by using only 20% up to 240.06 milliseconds by using the whole (100%) DNA sequences. Hence, using only 20% of DNA sequence will reduce the calculation time by 83%.
3.3
C-KNN vs. SVM
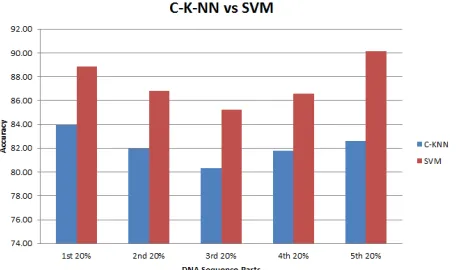
In this part we have included (one vs. all) experiment in addition to (one vs. one) specie identification explained in the previous part. Here, we made a comparison between two machine learning methods C-KNN and SVM. It’s clear from Figure 7 that SVM has obvious higher classification accuracy for (one vs. one) experiment than C-K-NN for all the DNA sequences parts except the third part which both of them share almost the same accuracy. The fifth 20% of the DNA sequence gives more accuracy results with SVM; hence, more information could be encoded in this part.
Figure 7. Averaged classification accuracy for each 20% part of the DNA sequences for one to one species evaluation
experiment using C-K-NN and SVM
Figure 8 shows the classification accuracies for (one vs all) species experiment. It’s clear here also that SVM classifier achieved higher accuracy results than C-K-NN. The fifth 20% part using SVM has higher accuracy result 90.14% compared to 82.63% for C-K-NN. For both experiments, it’s questionable the lower accuracy of the third 20% part.
Figure 8. Averaged classification accuracy for each 20% part of the DNA sequences for one vs all, species evaluation
experiment using C-K-NN and SVM
4.
CONCLUSIONS
Enhanced concept of DNA sequences feature extraction have been developed not matter how different the original sequences length are. This preliminary results show that part of DNA sequence can be used to identify DNA sequences species and make them cluster within their species using C-K-NN and SVM methods. Thus, it will reduce the overall calculations of using the whole DNA sequence and speeding up the process of classification. Also, provides a proof that part of the DNA sequence can be used for species identification.
5.
FUTURE WORK
Even though SVM has higher accuracy classification results than C-KNN, however, both of them proof that machine learning algorithms can be efficient in species identification. Feature extraction step plays a vital role in the classification process; the current design of the algorithm accepts various lengths of the DNA sequences. Hence, more DNA sequences have to be adopted and more feature aspects has to be developed as future extension of this work to improve the accuracy results. This work provides new insights for DNA barcoding and DNA taxonomy. Moreover, more investigations have to be performed to clarify accuracies variation in different parts of the DNA sequence and why the middle part of the DNA sequence (the third 20%) always has the lowest accuracy and what is the most significant part and size that should be used.
6.
REFERENCES
[2] D. Tautz, P. Arctander, A. Minelli, R. H. Thomas, and A. P. Vogler, “A plea for DNA taxonomy,” Trends Ecol.
Evol., vol. 18, no. 2, pp. 70–74, Feb. 2003.
[3] K. De Bruyne, B. Slabbinck, W. Waegeman, P. Vauterin, B. De Baets, and P. Vandamme, “Bacterial species identification from MALDI-TOF mass spectra through data analysis and machine learning.,” Syst. Appl.
Microbiol., vol. 34, no. 1, pp. 20–9, Feb. 2011.
[4] S. Levy and G. D. Stormo, “D N A Sequence Classification Using DAWGs,” in Structures in Logic
and Computer Science, J. Mycielski, G. Rozenberg, and
A. Salomaa, Eds. Springer Berlin Heidelberg, 1997, pp. 339 – 352.
[5] L. Liu, Y. Ho, and S. Yau, “Clustering DNA sequences by feature vectors.,” Mol. Phylogenet. Evol., vol. 41, no. 1, pp. 64–9, Oct. 2006.
[6] Q. Zhou, Q. Jiang, and D. Wei, “A new method for classification in DNA sequence,” 2011 6th Int. Conf.
Comput. Sci. Educ., no. Iccse, pp. 218–221, Aug. 2011.
[7] X. Song and W. Qiu, “DNA Sequences Classification and Computation Scheme Based on the Symmetry Principle,” 2009.
[8] B. Ma, Y. Zhu, and Y. Chen, “An Improved Fourier Method for DNA Sequence Classification,” 2009 3rd Int.
Conf. Bioinforma. Biomed. Eng., no. 1, pp. 1–4, Jun.
2009.
[9] J. T. L. Wang, D. Shasha, and C. H. Wu, “DNA sequence classification via an expectation maximization algorithm and neural networks: a case study,” IEEE Trans. Syst.
Man Cybern. Part C (Applications Rev., vol. 31, no. 4,
pp. 468–475, 2001.
[10] W. You, K. Wang, H. Li, Y. Jia, X. Wu, and Y. Du, “Classification of DNA Sequences Basing on the Dinucleotide Compositions,” 2009 Second Int. Symp.
Comput. Intell. Des., pp. 390–394, 2009.
[11] C. W. Morris, A. Autret, and L. Boddy, “Support vector machines for identifying organisms — a comparison with strongly partitioned radial basis function networks,”
Ecol. Modell., vol. 146, no. 1–3, pp. 57–67, Dec. 2001.
[12] T.-K. Seo, “Classification of nucleotide sequences using support vector machines.,” J. Mol. Evol., vol. 71, no. 4, pp. 250–67, Oct. 2010.
[13] H. R. H. Al-Absi, B. B. Samir, T. Alhersh, and S. Sulaiman, “On the combination of wavelet and curvelet for feature extraction to classify lung cancer on chest radiographs.,” Conf. Proc. IEEE Eng. Med. Biol. Soc., vol. 2013, pp. 3674–7, Jul. 2013.
[14] B. B. Samir, "Fast and Accuracy Control Chart Pattern Recognition using a New cluster-k-Nearest Neighbor,"
Journals of Wolrd Academy of Science, Engineering and Technology, 2009.
[15] S. Brahim-Belhouari, Modified k-means cluster. University technology of PETRONAS, 2008.
[16] V. Vapnik. Estimation of Dependences Based on Empirical Data [in Russian]. Nauka, Moscow, 1979. (English translation: Springer Verlag, New York, 1982).