Personalized neuroscience: User modeling of
cognitive function and brain activity in the cloud
Teresa A. Nick
BCI, DAQRI 1201 W. 5th Street Los Angeles, CA 90017
+1-213-375-8830
[email protected]
Laura M. Berman
BCI, DAQRI 1201 W. 5th Street Los Angeles, CA 90017+1-213-375-8830
[email protected]
Arye Z. Barnehama
BCI, DAQRI 1201 W. 5th Street Los Angeles, CA 90017+1-213-375-8830
[email protected]
ABSTRACT
Reliable detection and prediction of neural activity and behavior requires a user model of brain activity that dynamically adapts based on known time-dependent physiological processes, as well as unknown traits of the user. We have applied wireless electroencephalography (EEG) sensors, edge devices with feedback capability, and cloud-assisted data acquisition to real-time and longitudinal brain monitoring and alerting. Toward a user model of brain function, we collected neural and behavioral data from humans in the field. The data replicate previous findings that were obtained under tight laboratory control, suggesting that the methods that we describe will be useful for user modeling of human brain activity under more natural conditions. Specifically, we report that frontal cortex oscillations reorganized with age. Focusing on time-varying aspects of behavior, we then found that performance on memory-intensive cognitive tasks declined during the day. Next, we examined interactions between neural activity and behavioral performance. We report that neural activity and performance co-varied and that this co-variation depended on the cognitive task in ways that were, again, consistent with previous laboratory studies. Lastly, we report the foundations of an adaptive model based on this system that will enable dynamic personalization tailored to each user.
Categories and Subject Descriptors
C.2.1 [Computer-Communication Networks]: Network Architecture and Design - distributed networks, wireless communication; B.4.3 [Hardware]: Interconnections (Subsystems) - interfaces; G.3 [Mathematics of Computing]: Probability and Statistics - correlation and regression analysis, multivariate statistics, probabilistic algorithms, time series analysis H.2.8 [Information Systems]: Database Applications -
data mining, scientific databases, statistical databases; I.2.1
[Artificial intelligence]: Applications and Expert Systems -
medicine and science
General Terms
Algorithms, Measurement, Design, Experimentation, Human Factors
Keywords
cloud, wearable, electroencephalography, EEG, cognitive game
1.
INTRODUCTION
Accumulating evidence indicates that the adult brain remains somewhat plastic [1]-[4]. The adult brain also reliably expresses electrical activity patterns, enabling detection and prediction of specific states or events, such as drowsiness, seizure, and loss of focus [5], [6]. Development of a neurobehavioral user model that would enable the identification of deviations from typical patterns remains difficult due to the lack of a generic model upon which to base comparisons and build adaptive changes. In laboratory studies, large cyclic and non-cyclic changes in cognitive function and brain excitability occur reliably across time. Well-known neurobehavioral patterns are associated with age, as well as daily rhythms and other physiological cycles. For example, executive function declines with age [7] and frontal cortex brain waves in the alpha frequency band decrease with age [8], [9]. Circadian (daily) cycles and sleep pressure interact to dynamically regulate brain function [10], [11] and these changes are reflected in behavior. For example, short-term memory performance declines during the day [12]. Thus, any generic neurobehavioral user model will need to adaptively recalibrate based on these time-varying parameters.
Unfortunately, these laboratory phenomena have not been quantified in large, diverse populations with sensors that can be worn for extended time periods in a variety of environments. Further, humans in the laboratory may express different, atypical neural and behavioral patterns, suggesting that reports from laboratory studies should not be accepted at face value and, instead, will need to be retested under more natural conditions before incorporation into a user model. We have now built a system that enables minimally-obtrusive, longitudinal testing of neural and behavioral activities and compared results from this system to published laboratory-based studies.
The three main components of the system were: (1) dry electrode sensors; (2) an edge device (phone or tablet) that communicated with the sensors using Bluetooth Low Energy, engaged the user in cognitive games and other tasks, and sent data to the cloud; and (3) a cloud-based analytics and storage system that received data from the edge device, executed data-driven analytics, and presented the analyzed data back to the edge device accessible from a scalable NoSQL database. Here we report design features that enabled the integrated acquisition system and subsequent analyses.
This study evaluates the transferability of laboratory findings to the more natural conditions allowed by wearable devices.
BODYNETS 2015, September 28-30, Sydney, Australia Copyright © 2015 ICST
Building on the previous laboratory work, we collected data from 848 of our users in the field. Our study differed in several important respects from these prior studies: (1) On-demand access ensured that people using the system were motivated to use it. (2) Dry electrodes in a wireless headset ensured that people were not wet, restrained, and uncomfortable. (3) The scalability of the system enabled large numbers of recording sessions that exceeded those of most other studies by at least one order of magnitude. (4) Because the user was not in the laboratory, experimental control was limited. (5) Because we did not exclude users based on any static trait, such as race, gender, or medical condition, it is likely that our recording cohort was more diverse than those of laboratory studies. (6) The use of dry electrodes necessitated limiting recordings to the forehead, which lies over the frontal cortex of the brain. The frontal cortex orchestrates executive function and plays critical roles in learning, memory, attention, and behavioral inhibition.
We provide system details on the cloud data acquisition system. Specifically, we have solved several problems regarding the recruitment and retention of users, the secure transfer and analysis of large amounts of time-series data with relatively high sampling rates, and the combination of neural and behavioral data collection in a wearable system that users carry with them.
Other contributions of this study are the novel data showing replication of highly controlled laboratory studies in the field and the descriptions of the generic and user-specific modeling approaches. The overall design is based on iterative unsupervised machine learning (k-means clustering) to group similar users and to mold predictive capabilities to specific users.
This integrated system enables the application of high-resolution neural and behavioral feedback to encourage user interaction in real-time and to continuously monitor user physiology in near real time. It has enabled the acquisition of large amounts of neural data and the replication of findings previously reported only in the laboratory. The development of the user model enables alerting of the user and his/her network in the event of certain medical emergencies. In case of loss of focal attention, the user can be prompted to perform an activity that enhances focus, such as breathing deeply or taking a short break. Similar non-life-threatening events can be handled with other relevant prompts.
2.
SYSTEM ARCHITECTURE
2.1
Wearable EEG Hardware
Our EEG device (Figure 1, Left) is a commercially available headband with four gold-plated electrodes, 3 active and 1 passive. The headband communicates using Bluetooth Low Energy with an edge device. For the experiments described in this paper, differential recordings were made from two active electrodes placed on the left side and center of the forehead. The closest sites in the international 10-20 EEG positioning system are Fp1 and Fz, respectively. A Driven Right Leg (DRL) circuit was used to reduce common-mode interference [13]. The DRL electrode was passive. Data were sampled at 250 Hz.
The electrodes were positioned to best monitor activity of the frontal lobe of the brain, which has roles in executive function, personality, and social interactions. However, as with any EEG recording, there are other sources of voltage fluctuations that may have influenced the recordings, including brain activity in other areas, eye movements, eye blinks, and muscle activity. Movement-related artifacts were identified and removed during data processing (see below).
Figure 1. System architecture consisted of a wearable EEG headband (Left), an application running on an edge device (Middle), and a cloud platform built using AWS services and
custom code (Right). Main cloud applications were: Authentication with Cognito (top) and storage in S3 and
DynamoDB and analysis with R (bottom). Details are provided in the text.
2.2
Edge Device Application
An edge device application (Figure 1, Middle) running in iOS or Android communicated with the EEG headband. To connect to the headband, the user turned on the headband, opened the app, saw the prompt that indicated that the headband was available, and selected the headband for use. Once connected, the user could view progress on his/her "journey", play cognitive games, train focus using gaze fixation feedback, or view the filtered voltage in time or frequency domains.
Once the user selected any screen other than the journey screen, the app created an object in Amazon Web Services (AWS) S3 storage service, wrote the header in JSON, and began writing binary data from the headband. The header included various data, such as the timestamp, user identifier, the U.S. state-level location, and what screen the user was on. Moving to another screen or closing the app terminated the recording session. The file was then uploaded to S3.
For display, the time and frequency domain voltage screens relied on filtering with Infinite Impulse Response filters (1 - 50 Hz). A discrete Fourier transform was implemented to obtain power spectra for display as both meter indicators of neurally-significant frequency bands and also as a dynamic spectrogram.
Cognitive games consisted of one game that relied heavily on working memory (Pair Matching), one that relied more on focal attention (Object Mismatch), and three that relied strongly on both working memory and focal attention (Change Detection, Target Connect, and Pattern Recreation). Game scores were saved as percent correct. To encourage user retention, a journey screen was provided that allowed the user to use game achievements to earn badges and travel toward the Santa Monica Pier.
2.3
Cloud Applications
The S3 data bucket was monitored by a Simple Workflow that then passed any new data files out to waiting analysis servers. The delay between the user ending the recording session and the data finishing analysis was typically less than 5 min (see Data Transfer below for file size impacts).
Data files were processed and all analyses were executed using R. Files were discarded if the timestamp had an abnormal format, the file could not be opened, the file was larger than 4 MB, the file contained < 15 seconds of data, or there was a failure in the binary read.
After conversion from binary, raw data were filtered with a 1024-order FIR filter 1-125 Hz. The trace was median subtracted and then a threshold was computed independently for each channel as mean + 8*STD of the trace. To remove large artifacts, the longest duration recording between threshold crossings was extracted for further analysis. The Fast Discrete Fourier Transform (FFT) was computed on the extracted trace. In addition, the extracted cleaned trace was analyzed with algorithms for detecting eye blinks, left and right eye movements, and facial muscle contractions. Root Mean Square (RMS) was also calculated from the clean trace to assess overall power.
Cleaned data were automatically discarded if their duration was less than 6 seconds. ~20% of incoming data were automatically rejected due to insufficient duration or file corruption. Data were marked as best quality if the maximum voltage amplitude was less than an experimentally-determined threshold. All processed data were then saved to the database and only best quality data were included in the analyses below. ~38% of data remaining after the first screen were automatically marked as best quality (see below). The power spectrum of the cleaned data was segmented into neurally-relevant frequency bands and the power in these bands was summed. In the time domain, the autocorrelations and -covariances within traces and cross-correlations and --covariances between the two channel traces were computed. Peak amplitude and lag time features were obtained from these correlation measures.
Features calculated from the cleaned data were combined with all header variables that had been converted from JSON and loaded as a single row into a DynamoDB table, with each feature constituting a separate column. Primary keys were user ID and timestamp.
3.
LESSONS LEARNED
3.1
Data transfer
Given the relatively high sampling rates, we instituted a dual-buffering system. Data were stored on the device until the end of a session and then transferred to an intermediate store in S3. If the analytics pipeline backed up, the data simply sat in S3 until processing.
We found that some users recorded sessions exceeding 30 minutes, creating relatively large files that slowed down analytics because the Simple Workflow did not start a new run until all analyses from the last run were complete. To overcome this problem, we added data chunking on the edge device, such that files were closed and uploaded to S3 at faster rates. This resulted in files of standard sizes and increased analytics performance. This modification also allowed users to receive neural status updates while they were still recording.
3.2
Data quality
For our initial studies to characterize neural activity patterns, it was paramount that data be trusted. To achieve this, we marked data as best or acceptable quality and only analyzed the best quality data, with the expectation that acceptable quality data might be included once neural and behavioral patterns were identified. We have also built into the analysis system a function to keep track of the data quality from each user, so that users may be alerted to adjust their headband and/or change their recording habits when they consistently provide lower quality data.
3.3
Analysis
Due to the known contamination of neural EEG recordings with movement and muscle artifacts, we expected that we would discard large amounts of data. We found that detection of artifacts prior to filtering was not reliable, which required that we filter all incoming data. To accelerate FIR filtering and other analytics, we used AWS EC2 instances in the Compute Optimized family with high memory. Another approach would have been to use IIR filters, as we did on the edge device. However, this would have negatively impacted data quality.
4.
PROOF-OF-CONCEPT
We have found that field-deployed EEG wearables and mobile apps can produce significant neural and behavioral results that are in line with previous highly-controlled laboratory studies. These wearables and apps were provided to anyone that bought the headband and data were collected without regard to any static trait, such as age, gender, profession, or race. Remarkably, in spite of the inherent variability in the data and lack of control of user behavior, results were reliable and consistent with previous findings.
4.1
Neural Activity: Frontal Activity
Reorganizes With Age
Previous work indicated that brain oscillations vary with age [14]-[16]. To test the ability of the wearable EEG headband to record neural activity of humans in the field, we examined whether this phenomenon could be observed in our dataset. We had a limited number of users who had provided their age and gender, so this study was necessarily limited to those users (N = 66 users, 11 Females, 55 Males). Users younger than 20 years were compared to those 20 years and older.
The distribution of power in 5 neurally-relevant frequency bands across the two age groups were compared with a 2-way Analysis of Variance (ANOVA): delta (1 - <4 Hz), theta (4 - <7 Hz), alpha (8 - < 12 Hz), beta (15 - < 25 Hz), and gamma (30 - 125 Hz). There was a significant age x frequency band interaction, indicating that the power spectral density in these neurally-relevant bands shifts with age (Table I).
Table I. ANOVA results for power ~ age x frequency band
Df Sum Sq Mean Sq F-value Pr(>F)
Band 4 4.111 1.0277 534.094 < 2e-16
Age 1 0.000 0.0002 0.114 0.735419
Band x Age
4 0.046 0.0115 5.971 0.00011
Abbreviations: ANOVA: Analysis of Variance; Df: Degrees of Freedom; Sq: Squares
Figure 2. EEG power redistributes with age. Mean normalized power across subjects <=20 years (orange) or >20
years (cyan) is plotted relative to frequency. Frequencies in the alpha range are lower in the older subjects (arrow).
4.2
Cognitive Function: Working Memory
Declines During The Day
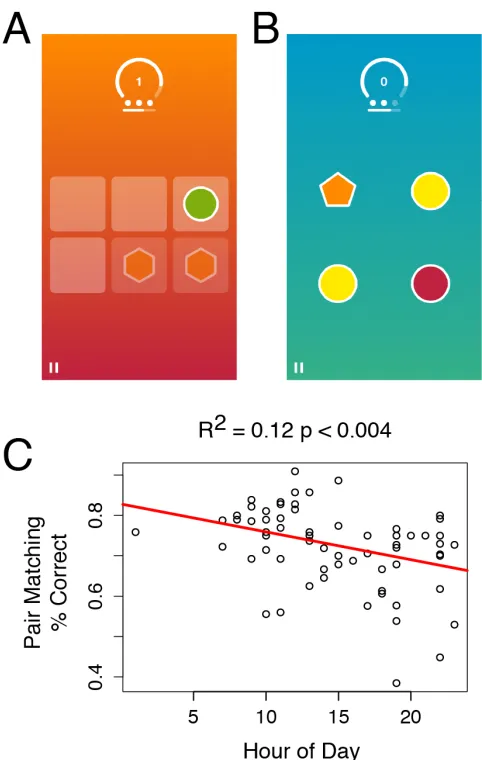
Previous laboratory work has indicated that short-term memory declines during the day [17]. We examined whether including cognitive tasks that require working memory in our app could enable measurement of this effect in the field. We analyzed sessions during which both cognitive game scores and neural recordings were available. We found that performance on a memory-intensive task, Pair Matching (Figure 3A), declined during the day (Figure 3C). The coefficient of determination (R2)
was small, but significant, which was striking given the lack of control in these experiments.
To examine whether performance on all games, regardless of memory, might decline during the day, we also examined an Object Mismatch game (Figure 3B), which requires focal attention and little working memory. In contrast to the memory-intensive task, performance on this task was stable during the day (R2 = 0.006, p = 0.50). For Pair Matching, we obtained 70 sessions from 48 unique users. For Object Mismatch, we obtained 75 sessions from 50 unique users.
Figure 3. Performance in a working memory game, but not a focal attention game, declined with time of day. (A) The working-memory intensive Pair Matching game required the user to turn over cards and match all pairs within a 3-sec time
window or a life was lost. The game ended when the user lost three lives. (B) The focal attention-intensive Object Mismatch game required the user to select the mismatched object within a 3-sec window. As with Pair Matching, the game ended when
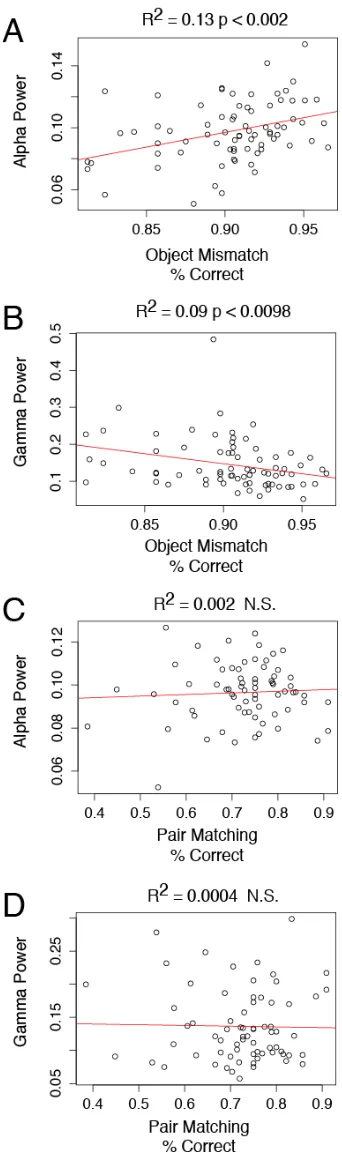
Figure 4. Alpha and gamma power varied with performance on a focal attention-intensive game, but not a memory-intensive game. (A) Alpha power increased with percent correct in the Object Mismatch game. (B) Gamma decreased
with performance on Object Mismatch. (C, D) Alpha and gamma were not correlated with performance on the Pair
Matching game.
4.3
Neural Activity Co-Varies With Cognitive
Task
In the previous sections we showed data that indicated that the wearable headband system can measure neural and behavioral activity. We next combined neural and behavioral data in order to assess EEG power spectral changes with cognitive task. We found that EEG alpha and gamma varied with performance on a focal attention-intensive task (Object Mismatch, Figure 4A-B), but not a memory-intensive task (Pair Matching, Figure 4C-D). This finding is consistent with laboratory reports that alpha power increases with attention [18], [19]. Beta, which lies between alpha and gamma, was not significantly modulated during either task (Object Mismatch: R2 = 0.02, p = 0.23; Pair Matching: R2 =
0.004, p = 0.57).
These data indicate that our system can record neural performance indicators during user activity and, in the case of at least one focal attention-intensive task, predict the user's performance on that task. The fact that the neural activity varies with cognitive load also suggests that the system may be able to determine relative focal attention demand of tasks in educational, medical, and industrial settings and make that information available to users.
5.
ADAPTIVE USER MODELING
Above, we present a series of small and significant findings from recordings of humans that have not been selected for any static trait. Their activity was monitored, not controlled. Using these and other data, reliable patterns in the field can be combined to learn a generic user model with a given set of static traits. Based on these traits, plus additional relevant information such as time of day, the brain activity of a given user can be predicted. Variations from this model can feed back to inform the user-specific model as well as the generic model. Alerts and triggers can then rely on deviations from the model.
5.1
A generic user modeling approach
Here we have presented data that indicate reliable patterns of brain activity and behavioral performance in terms of age, time of day, and task. However, there is much variability in the individual measures of brain activity and behavior. How does one construct a robust generic user model in spite of the variability? Below, we present an approach to forming a generic user model. We have not exhaustively tested the example model for predictive capacity, as this paper focuses on the feasibility and approach, not the model details.
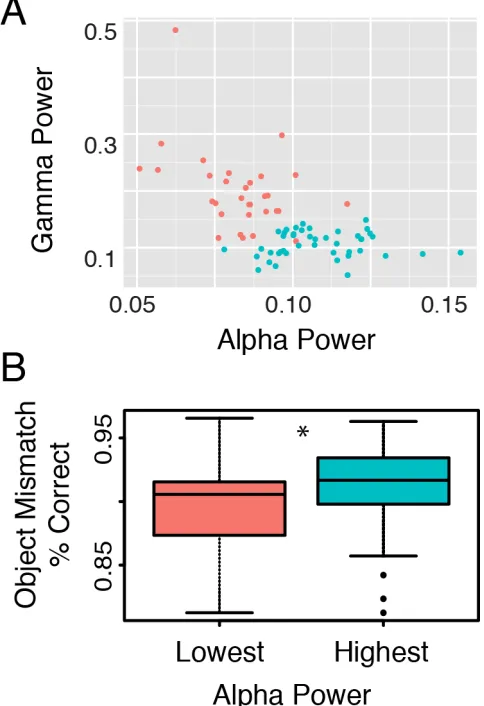
We have used unsupervised machine learning, k-means clustering, to begin to attack the problem of generic user modeling. For our example, we show data from the Object Mismatch game discussed in the previous section. Object Mismatch neural data in the 5 frequency bands discussed earlier (delta, theta, alpha, beta, and gamma) were k-means clustered with a maximum cluster count of 10. 10 clusters were produced and these were sorted based on alpha power and divided in half. Next, the Object Mismatch percent correct scores were compared between the high- and low-alpha cluster groups. We found that the 5 clusters with the lowest alpha power performed significantly lower on the Object Mismatch task than the 5 clusters with the highest scores (Figure 5).
combined clusters should be visually inspected at least in the dimension of recombination to ensure that combined clusters remain reasonably separated (Figure 5A). Features that are not used in the clustering may be analyzed to make inferences about results one might expect in future experiments, thus forming a generic user model for neural-neural and/or neural-behavioral relationships (Figure 5B; t-test, p < 0.043, lowest alpha, N=31; highest alpha, N=44). Lastly, the prediction accuracy of the model should be tested regularly using post-hoc comparisons of predicted and actual data.
Figure 5. Unsupervised clustering of data based on neural activity results in clusters with significant differences in cognitive performance. k-means clustering resulted in 10 clusters that were divided in half based on mean alpha power.
(A) The top (cyan) and bottom (orange) clusters visually separated in gamma and alpha dimensions. (B) The scores on
Object Mismatch for the two clusters were significantly different.
5.2
A user-specific modeling approach
Once generic user models are formed, the position of specific user traits and data can be localized in multi-dimensional space. Upon initial data acquisition from a user, the generic model will provide most predictions of user behavior based on static trait alignment with existing generic clusters. As data acquisition for a given user
proceeds, the generic model can be refined through an iterative approach of feeding user data into machine learning algorithms and obtaining new and/or shifting clusters. As more data from the user are acquired, the user-specific model, also created through iterative machine learning, prediction, and accuracy comparison, can begin to stand alone, becoming more and more molded to that specific user and better able to detect divergent neural or behavioral activity.
Building on this model, we have used multiple linear regression to determine the relationships (temporal and otherwise) between neural activity and behavior in each cluster, evaluated model quality based on the coefficient of determination, and calculated a user model error factor from the Mahalanobis distance of their feature vector from the center of their group's cluster. A routinely updated user model with the error factor can be automatically downloaded to the edge device to enable detection of user divergence from their own neural and behavioral baselines. The decision to alert the user upon divergence is weighted by the error factor. With large divergence, user features will likely fall into another generic cluster, potentially resulting in shifting of predictions and, subsequently, better fits.
6.
CONCLUSIONS
Functional deployment of wearables for health and wellness alerting and triggering fundamentally requires dynamic user models that can provide generic multidimensional predictions of neural activity and behavior. Further, dynamic user models can enable sculpting of predictions to specific users. This requires employment of hard-core neuroscience combined with scalable recording and devices that users want to use.
We have built a scalable solution that has collected, analyzed, and stored data from over 10,000 recording sessions. Here we show analyses of these data, revealing replication of findings that have previously been observed only under highly controlled laboratory conditions. In addition, we describe a novel approach to generic and user-specific modeling utilizing iterative k-means clustering, quality checking, and adjustment. This system provides a mechanism for scalable personalized user neural feedback, health research, and real-time monitoring. Potential applications for this technology include a system to alert users when they are stressed based on brain hemispheric asymmetry, a system to assess the cognitive engagement of post-stroke patients in therapeutic games for rehabilitation, and a system to monitor neural correlates of focal attention of students in a classroom.
7.
ACKNOWLEDGMENTS
We thank Jono Freeman and Eric Lundquist for technical assistance.
8.
REFERENCES
[1] M. Merzenich, T. M. Van Vleet, and M. Nahum, “Brain Plasticity-Based Therapeutics,” Frontiers in Human …, vol. 8, pp. 1–16, 2014.
[2] J. Mayas, F. B. R. Parmentier, P. Andrés, and S. Ballesteros, “Plasticity of attentional functions in older adults after non-action video game training: a randomized controlled trial.,” PLoS ONE, vol. 9, no. 3, p. e92269, 2014.
[3] J. F. Bergan, P. Ro, D. Ro, and E. I. Knudsen, “Hunting increases adaptive auditory map plasticity in adult barn owls,” J. Neurosci., vol. 25, no. 42, pp. 9816–9820, 2005.
Al-Hashimi, F. Faraji, J. Janowich, E. Kong, Y. Larraburo, C. Rolle, E. Johnston, and A. Gazzaley, “Video game training enhances cognitive control in older adults.,” Nature, vol. 501, no. 7465, pp. 97–101, Sep. 2013.
[5] G. R. Minasyan, J. B. Chatten, M. J. Chatten, and R. N. Harner, “Patient-Specific Early Seizure Detection From Scalp Electroencephalogram,”
Journal of Clinical Neurophysiology, vol. 27, no. 3, pp. 163–178, Jun. 2010.
[6] R. R. Johnson, D. P. Popovic, R. E. Olmstead, M. Stikic, D. J. Levendowski, and C. Berka, “Drowsiness/alertness algorithm development and validation using synchronized EEG and cognitive performance to individualize a generalized model,” Biological Psychology, vol. 87, no. 2, pp. 241–250, May 2011.
[7] L. Nyberg, M. Lovden, K. Riklund, U.
Lindenberger, and L. Backman, “Memory aging and brain maintenance,” Trends Cogn Sci, vol. 16, pp. 292–305, May 2012.
[8] C. Richard Clark, M. D. Veltmeyer, R. J. Hamilton, E. Simms, R. Paul, D. Hermens, and E. Gordon, “Spontaneous alpha peak frequency predicts working memory performance across the age span.,” Int J Psychophysiol, vol. 53, no. 1, pp. 1–9, Jun. 2004.
[9] W. Klimesch, “EEG alpha and theta oscillations reflect cognitive and memory performance: a review and analysis.,” Brain Res. Brain Res. Rev., vol. 29, no. 2, pp. 169–195, Apr. 1999. [10] A. A. Borbély, “A two process model of sleep
regulation,” Hum Neurobiol., vol. 1, no. 3, pp. 195–204, May 1982.
[11] L. Cummings, A. Dane, J. Rhodes, P. Lynch, and A. M. Hughes, “Diurnal variation in the
quantitative EEG in healthy adult volunteers.,” Br
J Clin Pharmacol, vol. 50, no. 1, pp. 21–26, Jul. 2000.
[12] C. Schmidt, F. Collette, C. Cajochen, and P. Peigneux, “A time to think: circadian rhythms in human cognition.,” Cogn Neuropsychol, vol. 24, no. 7, pp. 755–789, Oct. 2007.
[13] B. B. Winter and J. G. Webster, “Driven-right-leg circuit design,” IEEE Trans. Biomed. Eng., no. 1, pp. 62–66, 1983.
[14] T. D. R. Cummins and S. Finnigan, “Theta power is reduced in healthy cognitive aging,”
International Journal of Psychophysiology, vol. 66, no. 1, pp. 10–17, Oct. 2007.
[15] T. Kuo, J.-Y. Li, S. S. Hsieh, J.-J. Chen, C.-Y. Tsai, and C. Yang, “Effect of aging on treadmill exercise induced theta power in the rat,” Age, vol. 32, no. 3, p. 297, Sep. 2010.
[16] E. L. Vlahou, F. Thurm, I.-T. Kolassa, and W. Schlee, “Resting-state slow wave power, healthy aging and cognitive performance,” Sci. Rep., vol. 4, pp. –, Jan. 2000.
[17] C. Schmidt, F. Collette, C. Cajochen, and P. Peigneux, “A time to think: circadian rhythms in human cognition.,” Cogn Neuropsychol, vol. 24, no. 7, pp. 755–789, Oct. 2007.
[18] N. R. Cooper, A. P. Burgess, R. J. Croft, and J. H. Gruzelier, “Investigating evoked and induced electroencephalogram activity in task-related alpha power increases during an internally directed attention task.,” Neuroreport, vol. 17, no. 2, pp. 205–208, Feb. 2006.