and Data
Mohammad Javad Amiri1, Saeed Parsa2, and Amir Mohammadzade Lajevardi3
1 Ph.D. Student, Department of Computer Science, University of California Santa Barbara, Santa Barbara, CA, 93106
Associate Professor, Software Engineering Group, Iran University of Science and Technology, School of Computer Engineering
Ph.D. Student, Software Engineering Group, Sharif University of Technology, School of Computer Engineering
Abstract. Service Identification is one of the most important phases in service-oriented development methodologies. Although several service identification meth-ods tried to identify services automatically or semi-automatically, various aspects of business domain are not taken into account simultaneously. To overcome this is-sue, three strategies from three different aspects of business domain are combined for semi-automated identification of services in this article. At first, the tasks inter-connections within the business processes are considered. Then, based on the com-mon supporting requirements, another tasks dependency has been determined and finally, regarding the significant impact of data in business domain, the last tasks re-lations are specified. To combine these three strategies, task-task matrices are used as a common language and eventually services are identified by clustering the final task-task matrix.
Keywords:Service Identification, Business Process Model, Goals Model, Task-Task Matrix, Clustering.
1.
Introduction
Service Identification is the process of finding and extracting services from business re-quirements [1]. In recent decade several methods are presented to identify services. Al-though these methods use different strategies, approaches and techniques [2], the task of identifying services from various inputs has not yet been sufficiently solved [3]. Moreover, the lack of a systematic method that examines business from multiple perspectives and considers service quality attributes, causes service identification still remain a challenge to organizations [4]. Several researches have suggested service-modeling approaches that can identify and specify service components [5,6,7]. However, since they only provide descriptive guidelines to define services, it is less obvious and objective to apply those approaches, and even then, it is more dependent on experience and intuition [8].
provides cohesive right-grained functionalities, is proposed by some methods [10]. In these methods services are identified based on the connections between tasks within the business processes. A major benefit of this approach is that the identified services satisfy functional needs [11]. Also the simplicity of understanding and modeling the business processes and workflows persuades researchers to use this strategy. However, a large gap between business process and applications as well as non-reusable services may result if services are only modeled according to business process specifications and without tak-ing requirements and data into account. Furthermore, business process-driven approaches mainly focus on structural relations between tasks and ignore the conceptual ones. Actu-ally, tasks can be related through their supporting requirements. Based on this idea several methods have been proposed to identify services using goals and requirements [12,13,14]. These methods are introduced based on the accepted principle that the functionality of a system should be traceable to business goals and requirements [15], because business goals can be lost in technical architecture of systems if systems are developed without considering the relationship between the requirements and the identified services [14]. In other words, to identify appropriate services, business requirements should be analyzed to meet the business objectives, agility and reusability [16,13]. The great benefit of goal-driven approaches is that their resulting services are reusable and have guaranteed fit with the organizations goals [13], but the lack of consideration of tasks inter-relations within workflows may result in a large number of calls between resulted services. In addition, goal-driven approaches do not consider level of goals and their relations.
Data indicates the main stable domain abstraction of an enterprise [17]. Recently data-awareness is taken into consideration in several domains of business process management and service computing. Even more researchers believe that process and data are two sides of the same coin [18]. In fact, since each task in a business process may have access to one or several business objects, data in terms of object or entity plays a major role in service identification. In addition, data-aware service Identification can resolve several challenges of process-oriented approaches [19].
services, we only consider the most important ones that every system needs to deal with.
On the other side of the coin Semantic Web paradigm, which is a very hot subject and is growing very fast in resent years, can be used to identify services. The Semantic Web is a vision of a Web of meaningful contents and services, which can be interpreted by computer programs [20] in order to achieve process automation and service orchestration and choreography.
Ontology is a key concept in Semantic Web paradigm. Ontology typically provides a vocabulary that describes a domain of interest and a specification of terms meaning used in the vocabulary [21]. Ontologies have been developed within the Knowledge Modeling research community [22] in order to facilitate knowledge sharing and reuse. The service ontology essentially is integrated at the knowledge-level the information which has been defined by Web services standards, such as UDDI and WSDL with related domain knowl-edge. The first essential step for an efficient interoperability is the definition of a domain ontology [23]. OWL-S [24] is based upon the Web Ontology Language (OWL). More pre-cisely it is a specific OWL ontology, which is structured for describing service attributes. A number of capability matching algorithms have been proposed for OWL-S [25] to per-form matching between requirements, resources and tasks using reasoning techniques. In addition, ontology matching is a solution to the semantic heterogeneity problem. It finds correspondences between semantically related entities of ontologies [21].
Although Semantic Web can be used to identify services, researchers are most inter-ested to use this strategy to discover, describe and compose services [26]. On the other hand, although services can be identified using ontology, finding an ontology, which is acceptable by everyone, is a hard task. But some matching algorithms, such as those de-scribed in [27] and [28], assume the availability of ontologies of functionalities to express capabilities. To overcome this problem some methods such as linked open model [29] try to reduce the rule of ontologies. Linked open model, links different models using meta-models. It can be used to transfer model structure and contents between different compat-ible notations. Linked open model strategy can be used to identify services semantically, but the computational aspect is completely missing.
In the method proposed in this paper, three task-task matrices resulting from tasks dependency based on business processes, requirements and data are composed to detect appropriate functionalities as candidate services. Services are identified as cohesive, inde-pendent and reusable components using clustering techniques and a genetic algorithm. In this way, being cohesive does not necessarily mean being composed of highly interacting components. A service may be composed of a set of tasks that are inter-related through shared access to data object or supporting the same requirements.
2.
Related Works
In last decade a large number of methods are presented to identify services. Identifying appropriate services can help to fill the gap between business and service domains [30]. A comparison of more than 30 known methods from the points of view of approach, strategy, technique, input and output is provided in [2] . Also [31,32,33,34,35,4] present different surveys on service identification methods form various aspects. Because of diversity and multiplicity of these methods, in this section only well-known methods that use business processes, goals or data as their inputs or identification strategies are studied. Furthermore automated methods are reviewed as well as semi-automated methods.
2.1. Business Process-driven Methods
Business process decomposition is a common strategy in service identification domain. Based on the study on the input of more than 60 service identification methods in [36], business process is the most popular input to identify services. These methods usually de-compose business processes, cluster tasks and finally introduce each cluster as a service. A formal method is introduced in [8] to identify services by analyzing business processes and using graph clustering technique. This method uses hierarchical clustering algorithm to identify services with the maximum cohesion and minimum coupling. Ignoring other aspects of tasks dependency except tasks inter-connections to identify services is the main challenge of this method. Heuristics are applied by semantic analysis of business elements such as business rules and business requirements, and syntax analysis of process model is used as service identification strategy by [37]. This method neither provides detailed information about its heuristics, nor presents any automatic way to identify services. Also [38] provides a complete version of [37] and introduces 28 various heuristics to iden-tify services. Most of these heuristics are based on business processes, however data and requirements are mentioned in a few of them. The fine-grained granularity of services and lack of automation are the most important problems of this method [39]. Method in [40] decomposes business processes in order to identify services, but there is no further information provided about identification metrics. Also this method was not applied to any case study and did not use any modeling standard such as BPMN or UML. Although [41] introduces its method using a comprehensive case study and considers business ar-chitecture to cover requirements, ignoring cohesion and lack of providing details are the shortcomings of this method. Creating a matrix to analyze dependency between business process and business entity and classifying business processes accessing similar entities is presented by [42]. This method does not investigate the connections between tasks within business processes. As a result, lack of considering other aspects of business, not provid-ing detailed information, and lack of an automatic way to identify services are the main difficulties of most of these methods.
2.2. Goal-driven Methods
based on the relation between goals and roles. In this method goals are determined based only on roles. In [6] service identification starts with goal-service modeling. Goals are decomposed in several levels to identify services in the last level of model. Also [15] traces business goals in supporting services by creating a goal graph. In this method to satisfy each goal, several services are needed. A multi perspective method based on busi-ness processes, use-cases, legacy systems, and goal-service modeling introduced in [13] does not clarify details about its identification process. Using a pair of goal and scenario is introduced by [14]. The purposes of this method are explaining how to transform busi-ness process to service and presenting service interactions to obtain busibusi-ness agility and business goals. Services are defined in analysis phase considering business change and business goal. A flexible process design followed by service identification for product life cycle management application is presented in [44]. Similar to [6], this service identifica-tion method considers both business process and goal, but does not provide any detailed information about their steps. As a result it can be said that most goal-driven service identification methods identify services manually and also do not consider goals levels.
2.3. Data-driven Methods
Various methods consider data in terms of object or entity to identify services. Business entities are classified based on their lifetime, handled by organization units [39]. Each resulting class is then considered as a candidate service. An entity shared among business activities is also used as a means for identifying the activities as a service [45]. However, there are certain situations in which the activities are commonly applied to relate a number of entities [17]. In the approach proposed in [46], relationships among entities are consid-ered by relating entities that are accessed by the same operation. However, the strengths of relationships are not examined in this approach. Measuring the cohesiveness of a ser-vice through entities, entity-entity and entity-activity matrices is proposed in [17], but this metric can be measured only after identifying services and is not helpful to identify ser-vices. An artifact-centric approach based on master data life cycle, rather than process is introduced in [19] . In this method a UML class diagram is modeled to represent master data and finally each master data is considered as an entity service. Although data plays a major role in service identification, the lack of consideration of process aspect is obvious in that method. Moreover service reuse is not taken into account.
2.4. Automated and Semi-Automated Methods
and identifies services automatically using multi-objective genetic algorithm. Although this method focuses on design metrics, the reuse metric is ignored. Finally [50] provides a semi-automated method for inter-organizational service identification supporting busi-ness process and data. This method focuses on data flow and calculates task dependency based on data. Also it refines identified services. Nonetheless authors do not investigate tasks inter-connection.
3.
Service Identification Method
The method proposed in this article identifies services using business processes models, goals model and data model. The method consists of four main steps. In step 1, the busi-ness processes for the target system are modeled and based on tasks inter-connections within models, a task-task matrix for all business processes of system is extracted. It should be noted that each workflow system comprises several business processes. To iden-tify services, these business processes are considered at once, because repeated tasks can be found in different processes. So, regarding all business processes simultaneously, these repeated tasks and their connections are taken into account. In step 2, using goals mod-eling technique, requirements of the system are extracted and then by considering con-nections between requirements and goals, and also dependencies between requirements and their supporting tasks, another task-task matrix is created. In the third step, the data model, which shows objects, roles and their associations, is built. Then, considering the access types of tasks to objects and roles that perform tasks, the third task-task matrix is constructed. Finally and in step 4, these task-task matrices are combined and services are identified using genetic algorithm and Turbo-MQ fitness function.
3.1. Modeling Business Processes
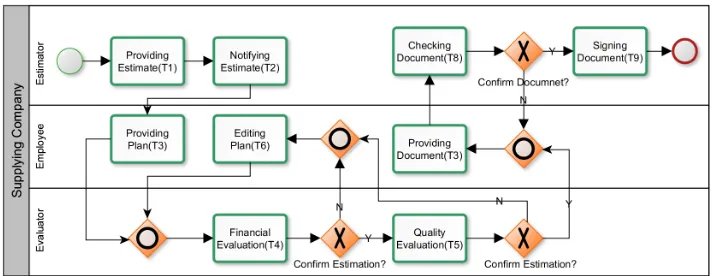
In the first step, business processes, which show the workflows of a system, are modeled. Each business process comprises a set of tasks, connections between tasks, gateways, events and roles that perform tasks. To describe the proposed method, a supplier system is considered as a motivation example. This system has several processes, however in this article only the process of ”Plan Approval” is taken into account. Plan Approval process is explained as follow.
Motivation Example:Supplier system needs yearly estimations for purchasing re-quired parts. Estimations are written by estimator and notified to employees. Each time, based on the estimation, employee provides a plan and sends it to the evaluator. The eval-uator checks the compatibility of plan with estimation from financial point. If the plan is not compatible to estimation or if it is not acceptable, the plan is returned to the employee for editing, else the evaluator evaluates the quality of the plan. Again, if its quality is not sufficient, the plan returns to the employee for editing, otherwise, the evaluator asks the employee to prepare a document. After preparing the document, the estimator checks it, if he confirms the document, he signs it and the process ends, otherwise the document including his comments is returned to the employee to be edited.
Fig. 1.Business Process Model for Plan Approval Process
Using business process models, a task-task matrix can be automatically extracted. Each row and column of this matrix addresses a separate task in the business process models. The task-task matrix is called TT1. The element [T T1]i,j is a positive integer
representing the number of outgoing edges from taskTi toTj within business process
models. Because all business processes are considered at once, it is possible that two tasks have several connections in different models, so the total number of connections should be considered. Furthermore, it should be noted that gateways and events are not considered, e.g., if there are only events or gateways between two tasks, these two tasks are considered as inter-connected tasks.
Using Algorithm 1 the first task-task matrix for Plan Approval Process can be built as Table 1.
Table 1.First Task-Task Matrix for Plan Approval Process T1 T2 T3 T4 T5 T6 T7 T8 T9
T1 0 1 0 0 0 0 0 0 0
T2 0 0 1 0 0 0 0 0 0
T3 0 0 0 1 0 0 0 0 0
T4 0 0 0 0 1 1 0 0 0
T5 0 0 0 0 0 1 1 0 0
T6 0 0 0 1 0 0 0 0 0
T7 0 0 0 0 0 0 0 1 0
T8 0 0 0 0 0 0 1 0 1
Algorithm 1Creating First Task-Task Matrix
Input:Business Process Models comprise set of taks T, set of events E, set of gateway G, set of edges E
Output:TT1 Matrix
for allEvente(eis not the start event,e /∈end events) with predecessor nodepeand successor
nodesedo
removee add edge(pe,se)
end for
for allgateway g with predecessor nodesp1, p2, ..., pnand successor nodess1, s2, ..., smdo
removeg fori←1tondo
forj←1tomdo add edge(pi,sj)
end for end for end for
for allTasks pairti,tjdo
[T T1]i,j= number of edge(ti,tj)
end for
3.2. Modeling Goals and Requirements
In the second step, considering the dependencies of tasks and requirements the second task-task matrix is built. In order to fulfill the given goal, requirements are extracted first using goals modeling technique. Then the relations between requirements are val-ued based on their levels. Finally using these values and dependencies between tasks and requirements, which are determined in task-requirements matrix, the second task-task matrix is specified.
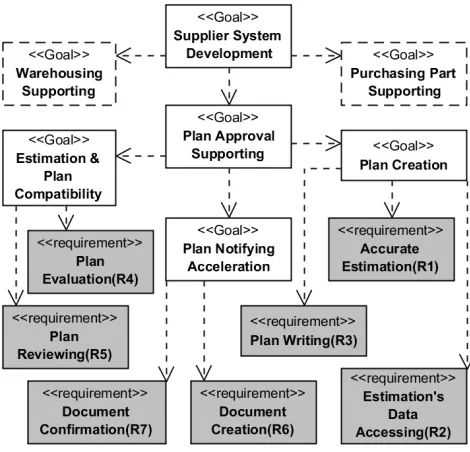
Goals model represents goals, objectives and requirements of the system. A goal is a purpose to be achieved by the system under consideration [52]. Goals modeling is one of the requirements elicitation techniques that helps system analyst to recognize all require-ments to be fulfilled by software product. In a goals model high-level goals are decom-posed to sub-goals until requirements are extracted. Creating goals model is a difficult task and needs cooperation of representatives of developers, business workers and even users.
In this paper the goals model is created in a simple way and goals are shown without any property. As it can be seen in Figure 2, the high-level goal of the motivation example is Creating Supplier System. This goal can be obtained by Warehousing Supporting, Plan Approval Supporting and Purchasing Part Support sub-goals. While the first and the last are out of the studied process, Plan Approval Supporting is decomposed in several steps and finally requirements are extracted as the leaves of the model.
Using goals model, the relations between requirements can be valued. The relation between any pair of requirementsRiandRjis determined via computing the maximum
Fig. 2.Goals Model for Creating Supplier System
model. In Algorithm 2,LCAreturns the lower common ancestor of two nodes and Dis-tancecalculates level differences between two nodes.
Algorithm 2Creating RR Matrix
Input:Goals Model comprises set of Goals G, set of Requirements R Output:RR Matrix
for allRequirements pairri,rjdo
Glca←LCA(rirj)
X←max(DISTANCE(ri, Glca),DISTANCE(rj, Glca))
[RR]i,j←21X
end for
Table 2 demonstrates the requirement-requirement (RR) matrix for Plan Approval process.
Displaying dependencies between requirements and tasks is the main purpose of task-requirement matrix. In this matrix, columns indicate tasks and rows show task-requirements. Accordingly, for each relevant task and requirement, which means a task supports a re-quirement,Xsign is put in corresponding element in the matrix.
Table 3 shows the task-requirement (TR) Matrix for Plan Approval process.
Table 2.Requirement-Requirement Matrix for Plan Approval Process R1 R2 R3 R4 R5 R6 R7 R1 1 0.5 0.5 0.25 0.25 0.25 0.25 R2 0.5 1 0.5 0.25 0.25 0.25 0.25 R3 0.5 0.5 1 0.25 0.25 0.25 0.25 R4 0.25 0.25 0.25 1 0.5 0.25 0.25 R5 0.25 0.25 0.25 0.5 1 0.25 0.25 R6 0.25 0.25 0.25 0.25 0.25 1 0.5 R7 0.25 0.25 0.25 0.25 0.25 0.5 1
Table 3.Task-Requirement Matrix for Plan Approval Process R1 R2 R3 R4 R5 R6 R7
T1 X - - -
-T2 - X - - - -
-T3 - - X - - -
-T4 - - - X - -
-T5 - - - X - -
-T6 - - - - X -
-T7 - - - X
-T8 - - - X
T9 - - - X
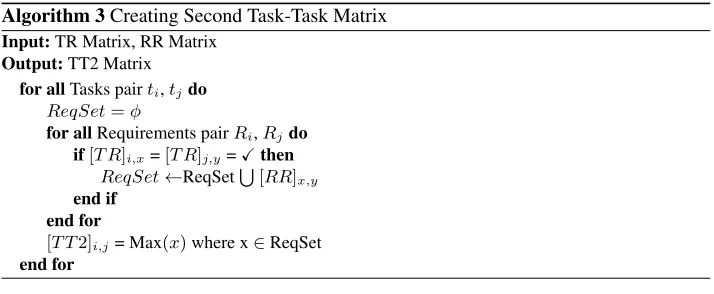
requirements or different requirements with a same ancestor, they are conceptually inter-related. To determine this type of tasks inter-relations for each two tasks,TiandTj, using
TR matrix, all their related requirements are determined at first, e.g., Gx and Gy are
related to Ti andGw andGz are related toTj, respectively. Then, all different related
elements of these requirements in RR matrix ([RR]x,w,[RR]x,z,[RR]y,w and[RR]y,z)
are considered and the element with the highest value is selected as the[T T2]i,jusing the
Algorithm 3.
Algorithm 3Creating Second Task-Task Matrix Input:TR Matrix, RR Matrix
Output:TT2 Matrix for allTasks pairti,tjdo
ReqSet=φ
for allRequirements pairRi,Rjdo
if[T R]i,x=[T R]j,y=Xthen
ReqSet←ReqSetS
[RR]x,y
end if end for
[T T2]i,j= Max(x)where x∈ReqSet
end for
Table 4.Second Task-Task Matrix for Plan Approval Process T1 T2 T3 T4 T5 T6 T7 T8 T9 T1 0 0.5 0.5 0.25 0.25 0.25 0.25 0.25 0.25 T2 0.5 0 0.5 0.25 0.25 0.25 0.25 0.25 0.25 T3 0.5 0.5 0 0.25 0.25 0.25 0.25 0.25 0.25 T4 0.25 0.25 0.25 0 1 0.5 0.25 0.25 0.25 T5 0.25 0.25 0.25 1 0 0.5 0.25 0.25 0.25 T6 0.25 0.25 0.25 0.5 0.5 0 0.25 0.25 0.25 T7 0.25 0.25 0.25 0.25 0.25 0.25 0 0.5 0.5 T8 0.25 0.25 0.25 0.25 0.25 0.25 0.5 0 1 T9 0.25 0.25 0.25 0.25 0.25 0.25 0.5 1 0
3.3. Modeling Data
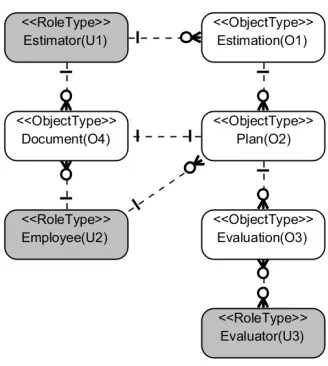
Data is the third criterion for service identification. Here, data means objects, which are related to tasks within business processes models. In this step, first, data model is created. This model shows object-types and roles as role-type. Also their associations are spec-ified. Then, based on relations between objects and tasks and also the permission type of roles on tasks, the task-object (TO) matrix is constructed. Finally, using this matrix and considering accessing to same objects or being accessed by the same role, the third task-task matrix is built.
Figure 3 demonstrates data model for Plan Approval process. As mentioned before for each Estimation, several plans are required and for each plan several evaluations are writ-ten. Also plan and document has a one-to-one relation. On the other hand, each estimator has been estimating several estimations and signing several documents. Employees write several plans and documents. The relation between evaluation and evaluator is many-to-many.
Relations between object-types and role-types can be seen in Table 5. In this table ’W’ means that the corresponding role has write permission on the related object and ’R’ stands for read permission.
Table 5.Role-Object Matrix for Plan Approval Process O1 O2 O3 O4
U1 W R R W
U2 R W R W U3 R R W
-Having this matrix and the business process models, task-object matrix can be created easily. In task-object matrix, each row shows a separate task and each column indicates an object-type or role-types. As it can be seen in Table 6, the access types of relevant objects and role which performed the task are specified for each task .
Fig. 3.Data Model for Plan Approval Process
Table 6.Task-Object Matrix for Plan Approval Process O1 O2 O3 O4 U1 U2 U3
T1 W - - - X -
-T2 W - - - X -
-T3 R W - - - X
-T4 R R W - - - X
T5 R R W - - - X
T6 R W R - - X
-T7 - - - W - X
-T8 - - - W X -
-T9 - - - W X -
-of these tasks are computed. The value -of Write and Read is considered as 1 and 0.5 respectively, because for each write two accesses to object are needed. Also if these two tasks are performed by one role, the value of one is summed with the last value and placed in the relevant element of the third task-task matrix according to the Algorithm 4.
Table 7 shows the third task-task matrix for Plan Approval process.
3.4. Identifying Services
In order to determine the degree of relations between tasks, the three task-task matrices, obtained in the last three steps are combined using Eq 1.
[T T]i,j=α[T T1]i,j+β[T T2]i,j+γ[T T3]i,j (1)
Input:TO Matrix Output:TT3 Matrix
for allObject o, Role u, Task i, Task j inTO Matrix do SU M←0
if[T O]i,o∈ {R,W} & [T O]j,o∈{R,W}then
SU M ←(VALUE(i,o) +VALUE(j,o))/2 if[T O]i,u=[T O]j,u=Xthen
SU M ←SU M+ 1 end if
end if
[T T3]i,j=[T T3]j,i= SUM
end for
procedureVALUE(x, y) if[T O]x,y= Wthen
return1 else
if[T O]x,y= Rthen
return0.5 end if end if end procedure
tasksTiandTjvalue ”1” in the first task-task matrix means an outgoing edge formTito
Tj. In second task-task matrix this value meansTiandTjsupport the same requirement
and in third task-task matrix it meansTi andTjhave write permission to the same data
object or are performed by the same role. Furthermore the second and the third matrices are symmetric matrices and each value is repeated in symmetrical element.
To determine these values, at first, ten domain experts are asked to say their opinions. Actually the value ofαis assumed constant and equal to 1 and the values ofβandγare asked. Table 8 shows their opinions about the values ofβandγ.
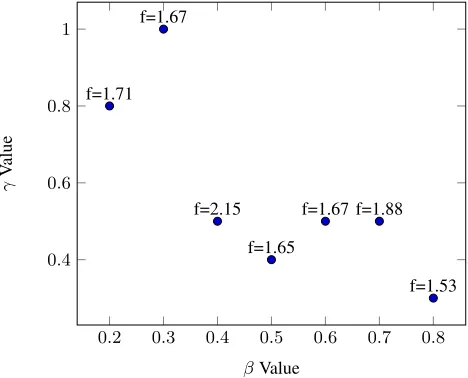
In addition to experts’ opinions, a training set, which contains 20 various processes from various domains, is used. For each process of this training set, while considering cohesion, loose coupling, reusability, and granularity criteria, domain experts identify ser-vices. For all these processes the proposed method is applied and by solving correspond-ing equations for each process, different values ofβandγare calculated. As mentioned before, the value ofαis assumed constant and equal to 1. Also the ranges ofβandγare limited to the ranges of experts’ opinions for these two parameters:β ∈[0.2, 0.8] andγ
∈[0.2, 1]. The bounds are rounded to the nearest tenth. The answer of each equation is the point that identified services correctly and also has the highest fitness function value between the correct answers.
Table 7.Third Task-Task Matrix for Plan Approval Process T1 T2 T3 T4 T5 T6 T7 T8 T9 T1 0 2 0.5 0.5 0.5 0.5 0 1 1 T2 2 0 0.5 0.5 0.5 0.5 0 1 1 T3 0.5 0.5 0 1 1 2.5 1 0 0 T4 0.5 0.5 1 0 3 1.5 0 0 0 T5 0.5 0.5 1 3 0 1.5 0 0 0 T6 0.5 0.5 2.5 1.5 1.5 0 1 0 0
T7 0 0 1 0 0 1 0 1 1
T8 1 1 0 0 0 0 1 0 2
T9 1 1 0 0 0 0 1 2 0
Table 8.Experts’ Opinions about metrics weights
Expertα β γ Expertα β γ E1 1 0.2 0.5 E6 1 0.25 0.33 E2 1 0.75 0.75 E7 1 0.25 0.5 E3 1 0.25 0.5 E8 1 0.5 0.66 E4 1 0.33 0.33 E9 1 0.25 0.5 E5 1 0.33 0.66 E10 1 0.33 0.66
is selected as the answer. As it can be seen in point of [0.4, 0.5] this process has its maximum value for fitness function, soβ = 0.4 andγ= 0.5 are the answers of equation for this sample process.
In Table 9 the best values for all training set processes are calculated.
Table 9.α,βandγValues for Processes of the Training Set
α β γ α β γ
P1 1 0.4 0.5 P11 1 0.3 0.7 P2 1 0.2 0.5 P12 1 0.4 0.4 P3 1 0.3 0.4 P13 1 0.4 0.5 P4 1 0.3 0.5 P14 1 0.2 0.2 P5 1 0.4 0.6 P15 1 0.3 0.4 P6 1 0.5 0.4 P16 1 0.3 0.5 P7 1 0.2 0.6 P17 1 0.2 0.6 P8 1 0.2 0.5 P18 1 0.2 0.5 P9 1 0.3 0.6 P19 1 0.2 0.4 P10 1 0.3 0.5 P20 1 0.3 0.6
0.2 0.3 0.4 0.5 0.6 0.7 0.8 0.4
0.6 0.8 1
f=1.71
f=2.15 f=1.65
f=1.67 f=1.88
f=1.53
βValue
γ
V
alue
Fig. 4.βandγvalues for a sample process
Table 10.Final Task-Task Matrix for Plan Approval Process
T1 T2 T3 T4 T5 T6 T7 T8 T9
T1 0 2.15 0.4 0.325 0.325 0.325 0.075 0.575 0.575 T2 1.15 0 1.4 0.325 0.325 0.325 0.075 0.575 0.575 T3 0.4 0.4 0 1.575 0.575 1.325 0.575 0.075 0.075 T4 0.325 0.325 0.575 0 2.8 1.9 0.075 0.075 0.075 T5 0.325 0.325 0.575 1.8 0 1.9 1.075 0.075 0.075 T6 0.325 0.325 1.325 1.9 0.9 0 0.575 0.075 0.075 T7 0.075 0.075 0.575 0.075 0.075 0.575 0 1.65 0.65 T8 0.575 0.575 0.075 0.075 0.075 0.075 1.65 0 2.3 T9 0.575 0.575 0.075 0.075 0.075 0.075 0.65 1.3 0
To identify services, final task-task matrix is clustered using a genetic algorithm and turbo-MQ [53] as fitness function. Each cluster is considered as a service. To do this, each task is assumed as a node and tasks that are highly cohesive and loosely coupled are considered as a cluster. In other words using turbo-MQ fitness function, cluster inter- and intra- connectivities are calculated. Eq 2 represents the Turbo-MQ fitness function.
T urbo−M Q= k
X
i=1
CFi
CFi=
(
0 µ= 0
2µi
2µi+Pki=1,i=j6 (δi,j+δj,i) otherwise
In this relation,CFiindicates the cluster numberi,µiindicates the number of
intra-relations between tasks within the clusteriandδi,jrepresents the number of inter-relations
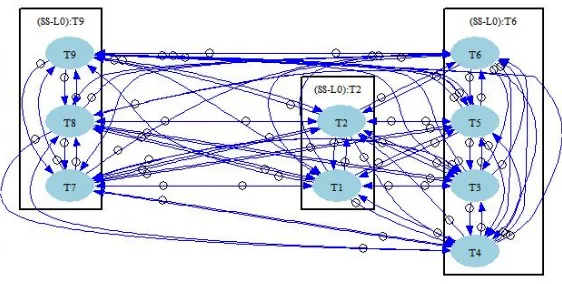
between tasks in clusteriand clusterj. The turbo-MQ function is used as the fitness func-tion for a genetic clustering algorithm [53]. The genetic algorithm is applied to an initial population of 90 randomly selected clustering for 900 generations while the crossover and mutation probabilities are 0.6 and 0.02, respectively. Figure 5 shows the resulted clusters. In this figure each oval is a task and each rectangle represents a cluster.
Fig. 5.Identified Services
4.
Evaluation
In this section the proposed method is evaluated from quantitative and qualitative aspects. To evaluate the correctness of identified services, five users are asked to identify services from six different processes, Then the average of their results accuracy are compared to the accuracy of the proposed method. In this context accuracy means the number of tasks that are clustered in the correct service to the total number of tasks. Figure 6 shows the results. As it can be seen, the accuracy of the proposed method has significant superiority over the users in all cases.
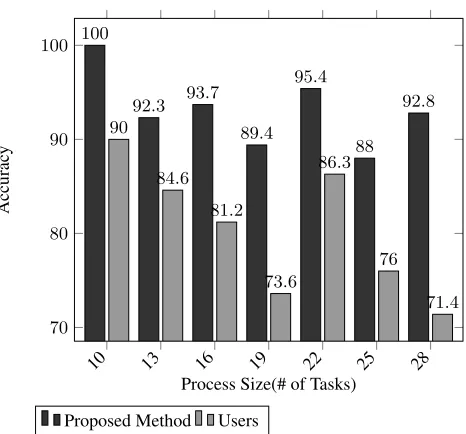
The structure of process affects the accuracy of service identification method. Struc-ture of a process can be defined as the size or the complexity of the process [50]. To measure the accuracy of the proposed method, at first, several users were asked to iden-tify services from seven processes with different sizes. The number of tasks are assumed as the size of process. As it can be seen in Figure 7 the accuracy of the proposed method is almost independent of the size of process.
Process1 Process2 Process3 Process4 Process5 Process6 75
80 85 90 95 100
92 93
100
86.5 93.5
87.8
77.4 91.8
89.2
82.4 84.3
76.9
Accurac
y
Proposed Method Users Fig. 6.Accuracy Comparison using several processes
10 13 16 19 22 25 28
70 80 90 100 100
92.3 93.7
89.4 95.4
88 92.8 90
84.6
81.2
73.6 86.3
76
71.4
Process Size(# of Tasks)
Accurac
y
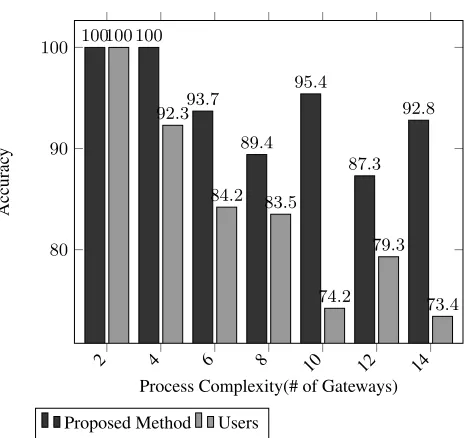
2 4 6 8 10 12 14 80
90
100 100 100
93.7
89.4 95.4
87.3 92.8 100
92.3
84.2 83.5
74.2 79.3
73.4
Process Complexity(# of Gateways)
Accurac
y
Proposed Method Users
Fig. 8.Relation Between Accuracy and Process Complexity
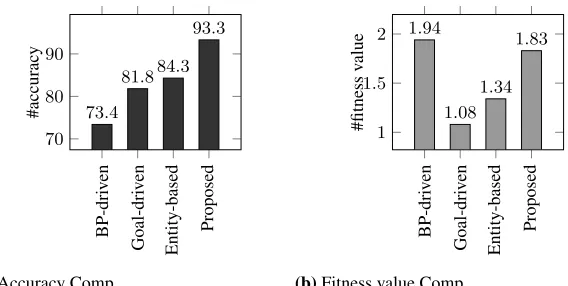
In the last quantitative evaluation, the proposed method is compared to several other methods from accuracy and fitness value points of view . To this end business process-driven, goal-process-driven, and entity-based service identification methods are selected and ap-plied to ten different processes. Finally the average of their results are compared to the results of the proposed method. Figure 9(a) and Figure 9(b) represent the accuracy and fitness value results.
As it can be seen in Figure 9, the accuracy of the proposed method is higher than other methods, but in case of fitness function, business process-driven method has the highest fitness value. Since Turbo-MQ only takes the structural relations between tasks into account, the number of clusters inter-relations are decreased and eventually the fitness value is increased. Nonetheless, since this method does not consider reuse metric, its accuracy is low.
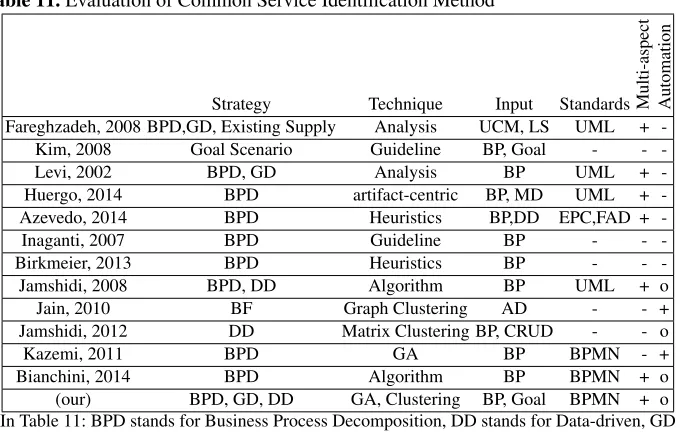
Cohesion, loose coupling, reusability and granularity are four major metrics that are applied to measure the quality of service identification methods [54]. These metrics have been applied to compare the proposed method with some other well-known service identi-fication methods. Furthermore automation is another metric that could be used to compare service identification methods. As shown in Table 11, the proposed method supports all these four metrics and in addition it is automated and has multi-aspect strategy to identify services.
5.
Conclusion and Future Work
BP-dri v en Goal-dri v en Entity-based Proposed 70 80 90
73.4
81.884.3
#accurac
y
(a)Accuracy Comp.
BP-dri v en Goal-dri v en Entity-based Proposed 1 1.5 2
1.08 1.34
1.83
#fitness
v
alue
(b)Fitness value Comp. Fig. 9.Comparison with Related Work
measured not only regarding inter-connections between tasks in business process models, but also considering tasks dependency in terms of supporting the same requirements as well as accessing to same data. Taking these various aspects into account needs the defi-nition of a common language that task-task matrix plays this role in the proposed method. Since the connections between tasks show a control flow between them, these connec-tions must be considered to identify loosely coupled services. In other words placing two inter-connected tasks in two separated services means a call dependency between these two services. On the other hand, reusability is an important property of qualified services. Considering the reuse of services needs attention to conceptual relations between tasks, therefore tasks that support a same requirement or sub-goals of a same goal are considered as inter-related tasks. While goals and requirements of a business are repeated in different business processes and systems, if tasks supporting a same goal form a service, by repeat-ing this goal in any other systems, the produced service can be used there. Furthermore if the goal or requirement is changed, the least number of services needs to be change. Finally considering common data objects between tasks can increase the reuse of services and decrease the services coupling. Combination of these three aspects needs the accu-rate computation to determine the weight of each one in the final equation. To fulfill this, several domain experts and a training dataset, which consists of some business processes, are used. By determining these weights the final task-task matrix is extracted and tasks are clustered using a genetic algorithm and Turbo-MQ fitness function. It should be noted that these weights can be changed depending on the the domain. The resulted services are evaluated from different points of view and the results show a significant excellence in comparison with other methods.
Table 11.Evaluation of Common Service Identification Method
Strategy Technique Input Standards Multi-aspect Automation Fareghzadeh, 2008 BPD,GD, Existing Supply Analysis UCM, LS UML +
-Kim, 2008 Goal Scenario Guideline BP, Goal -
-Levi, 2002 BPD, GD Analysis BP UML +
-Huergo, 2014 BPD artifact-centric BP, MD UML +
-Azevedo, 2014 BPD Heuristics BP,DD EPC,FAD +
-Inaganti, 2007 BPD Guideline BP -
-Birkmeier, 2013 BPD Heuristics BP -
-Jamshidi, 2008 BPD, DD Algorithm BP UML + o
Jain, 2010 BF Graph Clustering AD - - +
Jamshidi, 2012 DD Matrix Clustering BP, CRUD - - o
Kazemi, 2011 BPD GA BP BPMN - +
Bianchini, 2014 BPD Algorithm BP BPMN + o
(our) BPD, GD, DD GA, Clustering BP, Goal BPMN + o In Table 11: BPD stands for Business Process Decomposition, DD stands for Data-driven, GD stands for Goal-driven, BF stands for Business Function, BP stands for Business Process, GA stands for Genetic Algorithm, LS stands for Legacy System, and finally AD stands for Application
Domain. Also o in automation columns means semi-automated.
and different relations can have different weights. Also we may need another matrix that shows the relation between resources, if there is any. Finally based on these two matrices the task-task matrix for the process can be created. Different task-task matrices have dif-ferent weights in final matrix obtained using training data or expert opinion. As a result it can be claimed that the proposed method is extendable and could be easily generalized to include any number of aspects. Therefore constructing a framework that can support all different aspects to identify services could be a possible future work. In that frame-work, required aspects should be selected by user and then based on those aspects, the framework generates task-task matrices and cluster tasks to identify services.
As mentioned before Semantic Web services play a significant role in today’s service-oriented paradigm. The method that is proposed in this paper identifies services semi-automatically, but using Semantic Web, services can be identified automatically. Semantic Web can help us extract the relation between tasks and requirements and also tasks and data. Proposing an automated multifaceted method to identify services using Semantic Web could be another possible direction for future work.
References
1. Cai, Simin, Yan Liu, and Xiaoping Wang (2011) A Survey of Service Identification Strate-gies. In Services Computing Conference (APSCC), 2011 IEEE Asia-Pacific. pp. 464-470 2. Gu, Qing, and Patricia Lago (2010) Service identification methods: A systematic literature
plorative Evaluation of Recent Methods. In 47th Hawaii International Conference on System Sciences (HICSS). pp. 1285-1295
4. Huergo, Rosane S., Paulo F. Pires, Flavia C. Delicato, Bruno Costa, Everton Cavalcante, and Thais Batista (2014) A systematic survey of service identification methods. Service Oriented Computing and Applications 8, no. 3. pp. 199-219
5. Rosen, Michael, Boris Lublinsky, Kevin T. Smith, and Marc J. Balcer (2008) Applied SOA: service-oriented architecture and design strategies. Wiley
6. Arsanjani, Ali, Shuvanker Ghosh, Abdul Allam, Tina Abdollah, Sella Ganapathy, and Kerrie Holley (2008) SOMA: A method for developing service-oriented solutions. IBM systems Journal 47, no. 3. pp. 377-396
7. Fensel, Dieter, and Christoph Bussler (2002) The web service modeling framework WSMF. Electronic Commerce Research and Applications 1, no. 2. pp. 113-137
8. Kim, Yukyong, and Kyung-Goo Doh (2009) Formal identification of right-grained ser-vices for service-oriented modeling. In Web Information Systems Engineering-WISE 2009, Springer Berlin Heidelberg. pp. 261-273
9. Weske, M (2007) BPM Concepts, Languages, Architectures. Springer, ISBN 978-3-540-73521-2
10. Mani, Senthil, Vibha S. Sinha, Noi Sukaviriya, and Thejaswini Ramachandra (2008) Us-ing user interface design to enhance service identification. In ICWS’08, IEEE International Conference on Web Services. pp. 78-87
11. Hubbers, Jan-willem, Art Ligthart, and Linda Terlouw (2007) Ten ways to identify services. The SOA Magazine 13. pp. 1-7
12. Chaari, Sodki, Frdrique Biennier, Jol Favrel, and Chokri Benamar (2007) Towards a service-oriented enterprise based on business components identification. Enterprise Interoperability II. pp. 495-506
13. Fareghzadeh, Nafise (2008) Service identification approach to SOA development. In Pro-ceedings of World Academy of Science, Engineering and Technology, vol. 35, pp. 258-266 14. Kim, Suntae, Minseong Kim, and Sooyong Park (2008) Service identification using goal and scenario in service oriented architecture” In APSEC’08, Software Engineering Conference, 15th Asia-Pacific. pp. 419-426
15. Levi, Keith, and Ali Arsanjani (2002) A goal-driven approach to enterprise component iden-tification and specification. Communications of the ACM 45, no. 10. pp. 45-52
16. Iocola, P.:When Legacy Meets SOA (2007) Achieving Business Agility by Integrating New Technology with Existing Software Asset. In 1st Annual IEEE Systems Conference. pp. 1-8 17. Daghaghzadeh, Mohammad, Ahmad Baraani Dastjerdi, and Hossein Daghaghzadeh (2011) A Metric for Measuring Degree of Service Cohesion in Service-oriented Designs. Interna-tional Journal of Computer Science, Vol. 8, Issue 5, No 2, pp.83-89
18. Reichert, Manfred (2012) Process and Data: Two Sides of the Same Coin?. In On the Move to Meaningful Internet Systems: OTM 2012, Springer Berlin Heidelberg. pp. 2-19
19. Huergo, Rosane S., Paulo F. Pires, and Flavia C. Delicato (2014) A method to identify services using master data and artifact-centric modeling approach. In Proceedings of the 29th Annual ACM Symposium on Applied Computing. pp. 1225-1230
20. Cabral, L., Domingue, J., Motta, E., Payne, T., & Hakimpour, F. (2004). Approaches to semantic web services: an overview and comparisons. In The semantic web: Research and applications. pp. 225-239
21. Shvaiko, P., & Euzenat, J. (2013). Ontology matching: state of the art and future challenges. IEEE Transactions on Knowledge and Data Engineering 25, no 1, pp. 158-176.
23. Masuch, N., Brock, P., & Albayrak, S. (2013). Semi-automated generation of semantic ser-vice descriptions. In Trends in Practical Applications of Agents and Multiagent Systems. pp. 155-162
24. Martin, D., Burstein, M., Hobbs, J., Lassila, O., McDermott, D., McIlraith, S., Narayanan, S., Paolucci, M., Parsia, B., Payne, T. and Sirin, E., (2004). OWL-S: Semantic markup for web services. W3C member submission, 22, 2007-04
25. Martin, David, Massimo Paolucci, Sheila McIlraith, Mark Burstein, Drew McDermott, Deb-orah McGuinness, Bijan Parsia et al. (2004). Bringing semantics to web services: The OWL-S approach. In OWL-Semantic Web OWL-Services and Web Process Composition. pp. 26-42
26. Amiri, Mohammad Javad, Khayati, A., Minaei-Bidgoli, B., & Kangavari, M. R. (2014). Development of the E-Commerce Dialogues using Dynamic Context-aware Web Services Composition. Turkish Journal of Engineering, 1, pp. 55-62
27. Lei Li and Ian Horrocks (2003) A Software Framework for Matchmaking Based on Se-mantic Web Technology. In Proc. of the Twelfth International World Wide Web Conference (WWW 2003), pp. 331-339
28. T. W. Malone, K. Crowston, B. P. Jintae Lee, C. Dellarocas, G. Wyner, J. Quimby, C. S. Osborn, A. Bernstein, G. Herman, M. Klein, and E. O’Donnell (1997) Tools for Inventing Organizations: Toward a Handbook of Organizational Processes. Management Science 45, no. 3. pp. 425-443
29. Karagiannis, D., & Buchmann, R. A. (2016). Linked Open Models: Extending Linked Open Data with conceptual model information. Information Systems, 56, pp. 174-197.
30. Ebrahimifard, A., Amiri, M. J., Arani, M. K., & Parsa, S. (2016) Mapping BPMN 2.0 Chore-ography to WS-CDL: A Systematic Method. Journal of E-Technology 7, no 1. pp. 1-23 31. Kohlborn, Thomas, Axel Korthaus, Taizan Chan, and Michael Rosemann (2009)
Identifica-tion and analysis of business and software services-a consolidated approach. IEEE Transac-tions on Services Computing, 2, no. 1. pp. 50-64
32. Boerner R, Goeken M (2009) Service identification in SOA governance literature review and implications for a new method. In Proceedings of the 3rd IEEE international conference on digital ecosystems and technologies (DEST09). IEEE Computer Society, USA. pp. 588-593 33. Birkmeier D, Klckner S, Overhage S (2009) A survey of service identification approaches: classification framework, state of the art, and comparison. Enterp Model Inf Syst Archit 4(2). pp. 20-36
34. Kohlborn T, Korthaus A, Chan T, Rosemann M (2009) Service analysis-a critical assess-ment of the state of the art. In Proceedings of the 17th European conference on information systems (ECIS 2009). pp. 1583-1594
35. Vale T, Figueiredo GB, Almeida ES, Meira SLR (2012) A study on service identification methods for software product lines. In Proceedings of the 16th international software prod-uct line conference (SPLC 2012), vol 2. ACM, New York. pp. 156-163
36. Taei Zadeh, Ali, Muriati Mukhtar, Shahnorbanun Sahran, and M. R. Khabbazi (2012) A Systematic Input Selection for Service Identification. in SMEs, Journal of Applied Sciences 12, no. 12. pp. 1232-1244
37. Azevedo, Leonardo Guerreiro, Flvia Santoro, Fernanda Baio, Jairo Souza, Kate Revoredo, Vincios Pereira, and Isolda Herlain (2009) A method for service identification from business process models in a SOA approach. Enterprise, Business-Process and Information Systems Modeling. pp. 99-112
38. Azevedo, Leonardo Guerreiro, Flvia Santoro, Fernanda Baio, Thaissa Diirr, Alexandre Souza, Jairo Francisco de Souza, and Henrique Prado Sousa (2014) A Method for Bridging the Gap between Business Process Models and Services. iSys-Revista Brasileira de Sistemas de Informao 6. pp. 62-98
handshake. BPTrends 3. pp. 1-12
41. Birkmeier, Dominik Q., Andreas Gehlert, Sven Overhage, and Sebastian Schlauderer (2013) Alignment of business and it architectures in the german federal government: A systematic method to identify services from business processes. In 46th Hawaii International Confer-ence on System SciConfer-ences (HICSS). pp. 3848-3857
42. Jamshidi, Pooyan, Mohsen Sharifi, and Saeed Mansour (2008) To establish enterprise ser-vice model from enterprise business model. In SCC’08 IEEE International Conference on Services Computing. vol. 1, pp. 93-100
43. Grandry, Eric, Eric Dubois, Michel Picard, and Andr Rifaut (2008) Managing the alignment between business and software services requirements from a capability model perspective. In Towards a Service-Based Internet, Springer Berlin Heidelberg. pp. 171-182
44. Hachani, Safa, Lilia Gzara, and Herv Verjus (2013) A service-oriented approach for flexible process support within enterprises: application on PLM systems. Enterprise Information Systems 7, no. 1. pp. 79-99
45. Rostampour, A., A. Kazemi, F. Shams, A. Zamiri, and P. Jamshidi (2010) A metric for measuring the degree of entity-centric service cohesion. In IEEE International Conference on Service-oriented Computing and Applications (SOCA). pp. 1-5
46. Fan-Chao, Meng, Zhan Den-Chen, and Xu Xiao-Fei (2005) Business component identifi-cation of enterprise information system: a hierarchical clustering method. In ICEBE 2005, IEEE International Conference on e-Business Engineering. pp. 473-480
47. Jain, Hemant, Huimin Zhao, and Nageswara R. Chinta (2004) A spanning tree based ap-proach to identifying web services. International Journal of Web Services Research (IJWSR) 1, no. 1. pp. 1-20
48. Jamshidi, P., S. Mansour, K. Sedighiani, S. Jamshidi, and F. Shams (2012) An Automated Service Identification Method. Technical Report, TR-ASER-2012-01. Automated Software Engineering Research Group, Shahid Beheshti University
49. Kazemi, Ali, Ali Rostampour, Pooyan Jamshidi, Eslam Nazemi, Fereidoon Shams, and Ali Nasirzadeh Azizkandi (2011) A Genetic Algorithm Based Approach to Service Identifica-tion. In 2011 IEEE World Congress on Services (SERVICES). pp. 339-346
50. Bianchini D, Cappiello C, De Antonellis V, Pernici B (2013) Service identification in in-terorganizational process design. IEEE Trans Serv Comput 7, no. 2. pp. 265-278
51. Chinosi, Michele, and Alberto Trombetta (2012) BPMN: An introduction to the standard. Computer Standards and Interfaces 34, no. 1. pp. 124-134
52. Van Lamsweerde, Axel (2001) Goal-oriented requirements engineering: A guided tour. In Fifth IEEE International Symposium on Requirements Engineering, Proceedings. pp. 249-262
53. Mitchell, Brian, Martin Traverso, and Spiros Mancoridis (2001) An architecture for dis-tributing the computation of software clustering algorithms. In Working IEEE/IFIP Confer-ence on Software Architecture. pp. 181-190
54. Papazoglou, Michael P., and Willem-Jan Van Den Heuvel (2006) Service-oriented design and development methodology. International Journal of Web Engineering and Technology 2, no. 4. pp. 412-442
Saeed Parsareceived his BSc in mathematics and computer science from Sharif Uni-versity of Technology, Iran, his MS degree in computer science from the UniUni-versity of Salford in England, and his PhD in computer science from the University of Salford, England. He is an associate professor of computer science at Iran University of Science and Technology. His research interests include software engineering, soft computing and algorithms.
Amir Mohammazade Lajevardireceived his BS degree from Arak University, Iran, and his MS degree from Iran University of Science and Technology, in 2011 and 2013, respec-tively, both in Computer Engineering. He is currently studying his PhD in the Department of Computer Engineering, Sharif University of Technology. His research interests are in the areas of software engineering, software security and software reengineering.