1 JOURNAL OF SPATIAL INFORMATION SCIENCE
Exploring the utility of path analytics to
make inferences about dynamic
interactions between pairs of moving
objects
Jennifer A. Miller
Department of Geography and the Environment, The University of Texas at Austin, Austin, Texas 78712
Abstract: In animal movement ecology, ‘dynamic interactions’ are interactions defined by proximity in both space and time and are important for understanding spatial behaviours such as mating, predation, and territoriality as well as phenomena resulting from these behaviours such as disease spread. The two main approaches of quantifying dynamic interactions consider the locations as discrete points or as paths that are inferred as trajectories between subsequent points.
Point-based metrics consider proximity or distance between individuals explicitly, but their calculation is dependent upon subjective values such as a distance threshold or home range estimation. Path-based metrics compare derived movement parameters such as step length and azimuth. They require fewer subjective inputs but are inherently aspatial, as they are based on movement similarity irrespective of relative location.
This research explores the utility of quantifying interactions by combining spatiotemporal point proximity with analysis of path parameters to infer interaction. The movement parameters measured one or more of speed, direction, or change of speed/direction. This hybrid method was tested using data for fifteen black-backed jackal (Canis mesomelus) dyads comprised of twelve different individuals in Etosha National Park, Namibia.
2
parameters between individuals in a dyad were not always correlated, which suggests that path-based dynamic interaction metrics should allow for asymmetry.
3
1 Introduction
Interactions between and among moving objects occur across widely varying spatial and temporal scales and are a requisite for processes ranging from reproduction to disease spread to information flow and technology diffusion. Behaviours and processes related to interactions are extremely important across many different types of moving objects, scales, and contexts, but they are generally difficult to quantify for reasons such as semantic
uncertainty (what is an ‘interaction’?) and analytical tractability (how should interactions be measured and subsequently interpreted?). While moving objects that interact can range from micro-scale (e.g., gas particles) to macro-scale (e.g., continental plates), the two most frequently studied types of objects are related to human and animal movement (see Miller et al for overview). In spite of the importance of studying interactions, they have not been a main research focus in either computational movement analysis (GIScience) or
movement ecology.
1.1 Measuring dynamic interactions
Modeling interactions among animals has progressed from the use of ‘static’ or purely
spatial metrics (e.g., relative amount of overlapping home ranges) to ‘dynamic’ interaction
metrics that incorporate temporal information additionally [6]. Dynamic interactions are more appropriate for studying interactions stemming from social behaviors related to attraction or avoidance. The basic unit for studying animal interactions is typically two individuals, or a dyad, although social network analysis may be more appropriate for studying animal species with strong group dynamics such as primates [13].
Measuring dynamic interactions between animals is not straightforward, and depending on the objective of the study, what is considered an ‘interaction’ can consist of direct contact, sharing resources, or mere awareness of each other. Most studies focused on dynamic interactions are primarily concerned with positive interaction (as in the examples previously described), and negative interaction such as avoidance may be more problematic to identify and subsequently quantify. While there have been
impressive technological advancements in the ability to capture or record ancillary
information on interactions, such as animal-borne video cameras [11, 14], this equipment is not widely available or broadly applicable therefore interactions are typically inferred by assuming spatial association to be equivalent to social association (the ‘gambit of the group’
([29]). In addition to the uncertainty associated with this assumption, studies that compared dynamic interaction metrics have shown a disconcerting lack of congruence in the ability to quantify interactions [18, 20, 21, 24, 25]. Research in which simulated data have been used have helped to clarify some of the differences among dynamic interaction metrics [10, 18, 19, 24], but more applications comparing dynamic interactions using real animal movement data are needed.
1.2 Point- and path-based dynamic interaction metrics
4
trajectories between subsequent points; each of these approaches has attendant strengths and limitations. For point-based metrics, interaction is defined either as a function of distance (e.g., the mean distance of all pairs or the number of times a pair is within a critical distance) or the relative frequency with which two individuals are recorded in some shared area (e.g., the overlapping portion of their home range) at the same time. Consequently, these metrics rely on subjective parameters such as home range estimation or a distance threshold. The former parameter has been the subject of extensive debate for decades (see [27] for overview of a recent special issue on home range estimation) while the latter parameter should be determined by the animal’s movement properties and the type of interaction of interest but in practice is also influenced by the spatial and temporal resolution of the location data.
Path-based interaction metrics use movement trajectories as the basic unit of analysis and compare similarity in derived movement parameters such as speed, direction, and step length for two individuals. Although the derivation of movement parameters is sensitive to temporal resolution [17], path-based metrics involve fewer subjective decisions and may be more reflective of interaction behaviors compared to point-based metrics. However, since path-based metrics measure correlation of movement parameters for two individuals at the same time, they can only be used to detect a narrow set of interaction behaviors (e.g., positive interaction must be symmetric). Path metrics also do not consider the distance between the two individuals or their location relative to designated spaces such as home range overlap, therefore proximity is either implicit in the study (e.g. football players) or is addressed separately.
While often viewed as equally appropriate for measuring dynamic interactions, the significant conceptual (as well as practical) differences between point- and path-based metrics warrant deeper consideration about which method is more appropriate for measuring different types of interactions.
Non-independent movement in animals generally results from either similar responses to external influences (sharing a water-hole, avoiding a fence) or actual interaction with another individual, such as chasing or escaping [2]. Since point-based metrics consider proximity, they may be more appropriate for studying positive interactions such as direct contact related to mating or disease spread, while the movement coherence quantified by path-based metrics may make them more appropriate for studying both positive and negative interactions of longer duration related to, ex., shared resources or predator-prey dynamics.
Of the few studies that have compared multiple dynamic interaction metrics, when both point- and path-based metrics were used they were generally found to be complementary rather than redundant [10, 18, 19]. Nevertheless, there have been few attempts to combine point- and path-based metrics in order to harness their respective strengths while reducing their respective limitations (but see [12, 30].
As noted previously, while derived movement parameters can better reflect movement behaviors associated with interactions, the current path-based metrics in which they are used to analyze interactions are limited in their ability to robustly detect dynamic
5
proximity is the basis of the most commonly used path-based dynamic interaction metrics [21, 28]. Other approaches that measure relative motion of individuals in groups incorporate proximity as well as movement parameters that may be more characteristic of interactions such as increased speed or change in direction [1, 16, 23, 30]. However these frameworks require interaction patterns such as “pursuit and escape” to be algorithmically defined a
priori and are therefore not as useful for studies in which this information is not well known.
1.3 Path segmentation
One animal movement application area in which path-based analysis has been rapidly growing is path segmentation, which involves subdividing or segmenting trajectories based on similarities in movement parameters. The resulting discrete path segments are associated with different movement behaviors or states. Applications involving path analytics have been steadily expanding as better location data have become more widely available. Path segmentation relies on movement parameters used to detect significant change-points between types of movement that can be inferred as changes in movement behavior (e.g., resting vs. foraging). A clustering or classification algorithm is used to discriminate path segments based on similar movement parameters and the segments can then be associated with a particular movement behavior [7]. In addition to commonly derived movement parameters such as speed, step length, and azimuth, increasingly sophisticated movement parameters that might be more sensitive to behavioral changes and which are robust to varying temporal resolution of fixes have been introduced. In a paper that introduced behavioural change point analysis, Gurarie et al. [8] note the importance of describing three primary descriptive features of movement-- speed, directional persistence, and
variability/change— for identifying behavior-related movement.
In this research I present results that illustrate how path analytics can be combined with proximity to more robustly measure dynamic interactions. I use black-backed jackals (Canis mesomelas) in Etosha National Park to illustrate these methods. Black-backed jackals are monogamous and territorial and their social structure is comprised of solitary residents, transients, and pair/pack members. The individuals whose locations were tracked in this dataset show a range of different spatial interactions and make an excellent case study for these methods.
2 Methods
The dataset used here contains approximately hourly GPS locations for 22 jackals; I analysed fifteen dyads comprised of twelve individuals for which there was at least one
spatio-temporal ‘contact’ at 100 meters (Figure 1). Individuals are identified as “cm” followed by a
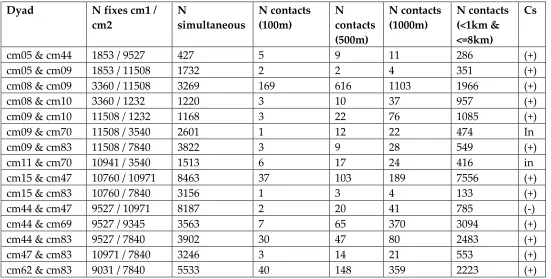
unique number, however no information on their age or sex was available. Table 1 lists the dyads and the constituent individuals, the number of fixes for each individual (after duplicates were removed), the number of simultaneous fixes (recorded at the same time), and the number of times the two individuals were within a temporal and distance threshold
(considered a ‘contact’). The temporal threshold used to define simultaneous and all contacts was 4200 seconds (most fixes were hourly, but the recorded time usually varied a few
minutes before or after). Four distance thresholds were used: 100, 500, 1000, and 8000
6
Figure 1: GPS trajectories of the twelve black-backed jackal (Canis mesomelus) in Etosha National Park.
7
between all non-simultaneous fixes. The Cs values indicated that twelve dyads had
statistically significant positive interaction; two dyads had insignificant interaction; and one dyad had statistically significant negative interaction (Table 1).
Table 1: Description of dyads and jackal individuals used here
Dyad N fixes cm1 /
cm2 N simultaneous N contacts (100m) N contacts (500m) N contacts (1000m) N contacts (<1km & <=8km) Cs
cm05 & cm44 1853 / 9527 427 5 9 11 286 (+)
cm05 & cm09 1853 / 11508 1732 2 2 4 351 (+)
cm08 & cm09 3360 / 11508 3269 169 616 1103 1966 (+)
cm08 & cm10 3360 / 1232 1220 3 10 37 957 (+)
cm09 & cm10 11508 / 1232 1168 3 22 76 1085 (+)
cm09 & cm70 11508 / 3540 2601 1 12 22 474 In
cm09 & cm83 11508 / 7840 3822 3 9 28 549 (+)
cm11 & cm70 10941 / 3540 1513 6 17 24 416 in
cm15 & cm47 10760 / 10971 8463 37 103 189 7556 (+)
cm15 & cm83 10760 / 7840 3156 1 3 4 133 (+)
cm44 & cm47 9527 / 10971 8187 2 20 41 785 (-)
cm44 & cm69 9527 / 9345 3563 7 65 370 3094 (+)
cm44 & cm83 9527 / 7840 3902 30 47 80 2483 (+)
cm47 & cm83 10971 / 7840 3246 3 14 21 553 (+)
cm62 & cm83 9031 / 7840 5533 40 148 359 2223 (+)
Number of fixes (GPS locations with duplicates removed) for each jackal individual; simultaneous fixes are the number of GPS locations for which both individuals were
recorded at the same time (within 4200 seconds); the number of contacts show the number of simultaneous fixes that both individuals were within the specified distance; the coefficient of sociality (Cs) indicates the result of a distance-based dynamic interaction metric (positive interaction, negative interaction, or statistically insignificant).
2.1 Movement parameters
The movement parameters or path characteristics used here were selected because they have been used in dynamic interaction and path segmentation studies previously and can be calculated ‘locally’ for each step (excepting relative angle and its derivatives for the first and last step and absolute angle, speed and its derivatives for the last step). The objective of this study was to explore the feasibility of using movement parameters to distinguish between contact-related movement and ‘other’ movement, and the results are intended to be general
8
capability of representing speed, direction, and change are listed in Table 2 and briefly described below.
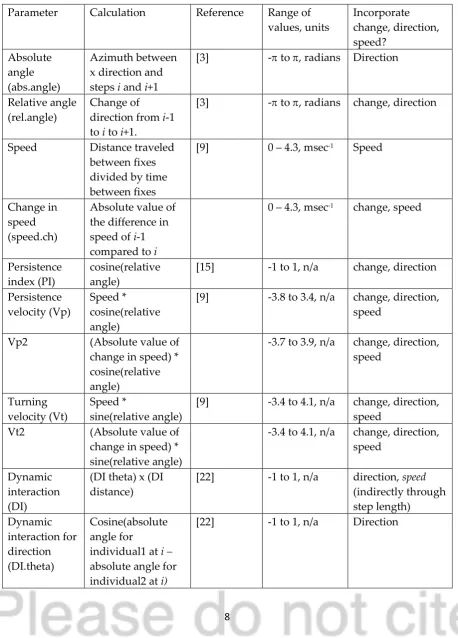
Table 2: Path analytic or movement parameters used here. Description of movement parameters used here as well as an indication of whether they represent change, direction, and/or speed.
Parameter Calculation Reference Range of values, units Incorporate change, direction, speed? Absolute angle (abs.angle) Azimuth between x direction and steps i and i+1
[3] - to , radians Direction
Relative angle (rel.angle)
Change of
direction from i-1 to i to i+1.
[3] - to , radians change, direction
Speed Distance traveled between fixes divided by time between fixes
[9] 0 – 4.3, msec-1 Speed
Change in speed (speed.ch)
Absolute value of the difference in speed of i-1 compared to i
0 – 4.3, msec-1 change, speed
Persistence index (PI)
cosine(relative angle)
[15] -1 to 1, n/a change, direction
Persistence velocity (Vp)
Speed *
cosine(relative angle)
[9] -3.8 to 3.4, n/a change, direction, speed
Vp2 (Absolute value of change in speed) * cosine(relative angle)
-3.7 to 3.9, n/a change, direction, speed
Turning velocity (Vt)
Speed *
sine(relative angle)
[9] -3.4 to 4.1, n/a change, direction, speed
Vt2 (Absolute value of change in speed) * sine(relative angle)
-3.4 to 4.1, n/a change, direction, speed
Dynamic interaction (DI)
(DI theta) x (DI distance)
[22] -1 to 1, n/a direction, speed (indirectly through step length) Dynamic interaction for direction (DI.theta) Cosine(absolute angle for
individual1 at i –
absolute angle for individual2 at i)
9 Dynamic
interaction for displacement (DI.dist)
1 – ((absolute value of difference between step lengths for two individuals at i)/(sum of the step lengths for two individuals at i))
[22] 0 to 1, n/a speed (indirectly through step length)
The two measures of direction used here are absolute angle and relative angle and they were calculated using AdehabitatLT [4]. Absolute angle measures the azimuth relative to the x direction and may be related to interactions when they involve movement toward or away from fixed resources (water holes, roads or paths). Relative angle measures the turning angle and therefore can represent change in direction. Speed is redundant with step length when the fixes are at uniform time intervals but is more robust than step length when intervals are variable. The absolute value of the change in speed from the previous step is introduced here as a way of representing both change and speed. The absolute value is used as both increase and decrease of speed may be associated with interactions. Persistence index (PI) is the cosine of the relative angle and measures how directed movement is; values close to 1 represent the most direct movement (i.e. small turning angles), a PI close to 0 shows uncorrelated movement (i.e. turning angles close to 90°), and a PI approaching -1 would indicate oscillating movements (Laidre et al. 2013). Persistence velocity (Vp) is the product of speed and PI, and therefore the interpretation for PI remains roughly the same except higher speed translates to more direct movements and high speed with oscillating direction results in smaller negative values (and is less likely to occur) [8, 9]. I introduce Vp2 here, a slight modification of Vp that is the product of PI and the absolute value of the change in speed. Vp2 can be interpreted similarly to Vp, except the higher values are now associated with large changes in speed instead of just high speed. The turning velocity (Vt) is the
product of speed and sine of the relative angle so can be interpreted as the tendency to move in a perpendicular direction [8]. It is modified by substituting the absolute value of the change in speed for speed to calculate Vt2.
Finally, three dynamic interaction metrics are calculated for simultaneous fixes for each dyad using WildlifeDI [18]: DI.theta measures the correlation between the individuals’
absolute angle or azimuth; DI.dist measures the correlation in step lengths; and the product of those two values describes correlation in both direction and distance (DI). For all three of these metrics, a value close to 1 indicates that the direction, distance, or both are very similar, respectively.
2.2
‘
Contact
’
-
related movement versus ‘other’
For each individual in a dyad, parameters describing movement when the other individual is spatio-temporally proximal (considered a ‘contact) were compared to those describing movement when the individuals are far apart. Three distance thresholds were used to
10
scales (e.g., direct contact or shared fine-scaled resources such as carcasses; indirect interaction such as awareness, territoriality or shared coarse-scaled resources such as watering holes): 100 m., 500 m., and 1000 m. In addition to detecting different types of interaction, using a range of distances (particularly 1000 m.) helps compensate for the hourly temporal resolution and potential missed contacts that are not detected empirically due to
‘step bias’ [5]. Contacts that occurred at distances between 1000 m. and 8000 m. were used here as a null model: hypothetically there should not be statistically significant differences in movement parameters between contacts that occurred within 8000 m. and ‘other’. However, significant differences could result from ‘scatter bias’ [5], or interaction with uncollared individuals. In order to reduce the potential scatter bias, when determining the ‘other’ value for any individual in a dyad, the fixes for which it was within 1000 m. of one of the twelve individuals outside of the dyad were removed. However, scatter bias resulting from other uncollared inter- or intra-specific individuals, as well as step bias beyond 1000 m. could still result in movements indicative of interaction at a dyad distance of 8000 m.
Each distance threshold resulted in two sets of fixes for each individual in a dyad: ‘contacts’,
which included the step before, during, and after a contact; and non-contact related fixes
(‘other’) which included all of the other fixes (with contact-related fixes calculated with other individuals removed, as described above). Significance of differences was tested used
Wilcoxon rank signed tests and Watson tests (for absolute and relative angle) using a p-level of 0.1 to account for the small sample sizes of ‘contacts’ at 100 m and 500 m., although the likelihood of increasing type I errors, particularly for the 8000 m. distance where sample sizes are highest, is acknowledged. Differences between parameters for contact- and other- related movement were tested; additionally, the direction of the differences was tested for speed and change of speed using separate one-sided tests (e.g., alternative hypotheses that contact parameters was higher or lower than other parameters).
3 Results
3.1 Movement parameter comparison
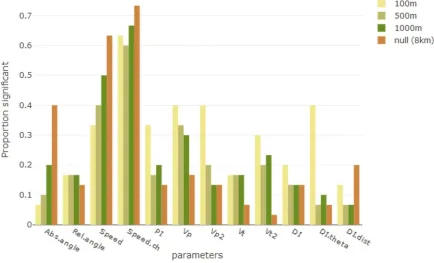
The proportion of times the differences between ‘contact’ and ‘other’ for each of the twelve
movement parameters was statistically significant for each of the four distance thresholds are shown in Figure 2. For the nine movement parameters that describe individual
movement, this proportion was out of 30 (15 dyads * 2 individuals per dyad), while the proportion for the three DI metrics was out of 15 (the number of dyads). In general, a parameter would be considered potentially useful for distinguishing contact-related
movement if the proportions that were statistically significant for the three shorter distance thresholds representing meaningful interaction were greater than the proportion significant at 8000 m., although as noted above, movement at this distance apart could reflect
11
Figure 2: The proportion of times in which the movement parameter listed was difference
for contacts compared to ‘other’. The contacts are defined by the distance thresholds listed; the null model is represented by a distance threshold of 8 km., as movement by individuals within that distance should not be different from movement beyond that distance. The proportions are out of 30 for the first nine parameters and out of 15 for the three DI parameters.
DI.theta had the biggest difference between proportions at the smallest distance compared to the largest (0.4 at 100m; 0.07 at 8000m.), followed by Vp2 (100m: 0.4, 8000m: 0.13) and Vt2 (100m: 0.3; 8000m: 0.03). Speed, change in speed, and absolute angle were the least able to differentiate contact-related movement as they all showed increasing proportions that were significant as the distance threshold increased. Absolute angle had the lowest proportion significant for 100 m (0.06) and only a slightly higher proportion for 500 m. (0.1). The
proportion significant for the change in speed parameter was the highest at all four distance thresholds, with the highest proportion of all for 8 km (0.73) and 100 m. was also higher than almost any other metric at any distance (0.63). Based on the two-sided tests, both speed and the change in speed for contact-related movement were greater than those associated with
‘other’ for most of the significant results, with the exception of the cm08 & cm09 dyad, which had the highest number of contacts at any distance.
3.2 Individual-dyad comparison
12
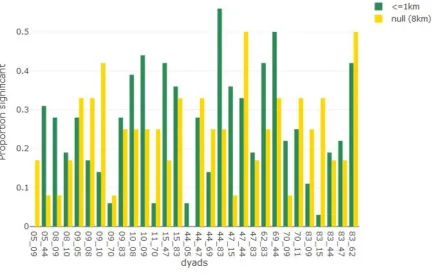
Figure 3: The proportion of significant differences for contact-related movement and ‘other’
for each dyad-specific individual. All three meaningful distances are summed
(proportion is out of 36) and the null model is represented by 8 km distance threshold (proportion is out of 12).
interaction behaviors reflected in their movement, dyad-specific individuals were considered separately here. This resulted in 30 dyad-specific individuals for which the proportion of significant results for all distances less than or equal to 1000 m. (potential
‘meaningful’ interaction) were combined and compared to the proportion of significant results at 8 km. apart (the null expectation). For each of the 30 (dyad-specific) individuals,
the proportion of significant results at ‘meaningful’ distances was out of 36 (12 parameters *
3 distance thresholds), while the proportion for the null distance was out of 12. The dynamic interaction results were counted for both individuals in a dyad.
13
for cm44 with cm47: 0.28 meaningful and 0.33 null). Cm83 paired with cm15 had the biggest difference between null (0.33) and meaningful (0.03) proportions for which null was highest. Cm83 was part of four other dyads; two for which the null proportion was higher than the meaningful proportion (with cm09 and cm62) and two dyads for which the meaningful proportion exceeded the null proportion (with cm44 and cm47). In general, when an individual was part of multiple dyads, the differences between the meaningful and null proportions were quite different, with the exception of cm10, for which the proportion of meaningful and null distances was similar when paired with cm09 (0.39 and 0.25,
respectively) and cm10 (0.44 and 0.25, respectively).
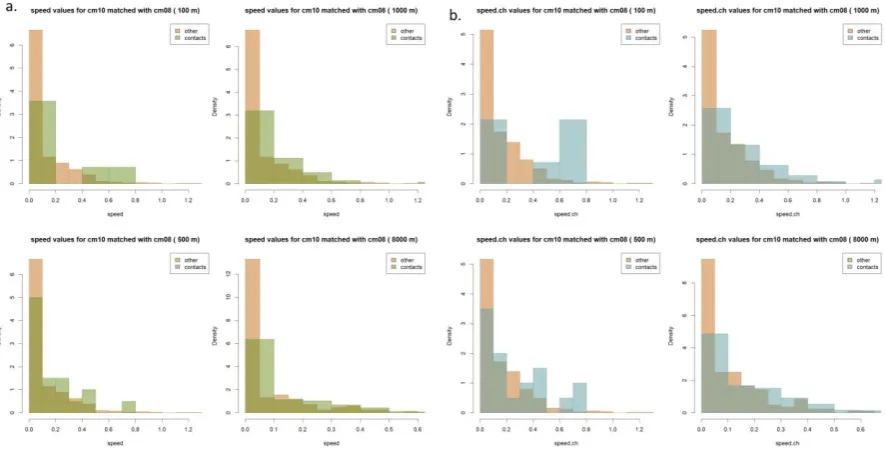
3.3 Contact-related movement differences
In path segmentation, basic movement behaviors can be inferred from trajectory sections in which specific movement parameters are relatively uniform. For example, foraging would be associated with high relative angles and low speed. There are many different kinds of interactions that can occur between animals, which makes empirically identifying
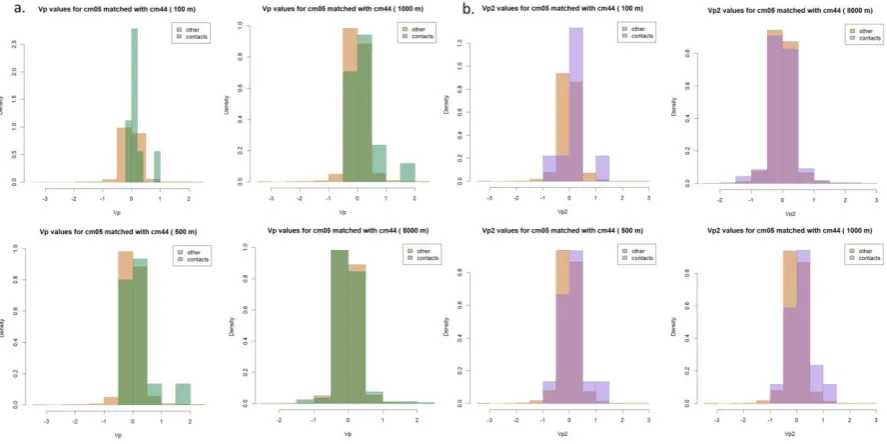
interactions more problematic than other (individual) movement behaviors. The objective of this study was to explore whether contact-related movement could be detected empirically rather than to determine specific movement parameter values associated with interactions, but there were some consistencies, highlighted in the following examples. In general, speed and change in speed were higher for contacts than ‘other’. Figure 4 shows both parameters for cm10 when part of a dyad with cm08. PI values close to -1 (oscillating movement) occurred more often in ‘other’, although values close to 1 (more direct movement) and 0 (uncorrelated movement) occurred fairly evenly for both contacts and other. This is illustrated in the values for cm05 and cm44 in Figure 5, and also shows differences in movement between the individuals: in this example cm05 exhibited more direct movement associated with contacts than cm44 did.
14
Figure 5: Distribution of PI values for cm05 matched with cm44 for all distance thresholds (a) and distribution of PI values for cm44 matched with cm05 (b).
Vp, Vp2, Vt, and Vt2 all had high occurrences of zero values, more often resulting from zero speed (or no change in speed in the case of Vp2 and Vt2) than zero values for either the cosine of turning angles (Vp, Vp2) or sine of the turning angles (Vt, Vt2). In general, contact-related movement more frequently had Vp values close to zero, but this was somewhat confounded by the tendency of non-contact-related movement to be associated with resting (speed = 0), while contact-related movement more often had PI values close to zero. For both Vp and Vp2, contact-related movement had higher values, indicating a higher magnitude of persistent movement (as shown in Figure 6 for cm05 with cm44).
15
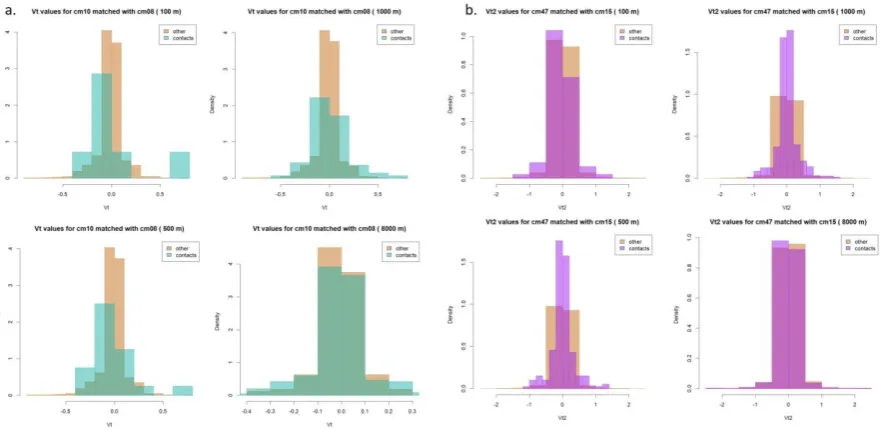
Vt and Vt2 are more difficult to interpret, since they are based on the sine of the turning angle, a value of 0 would indicate both direct movement (0° relative angle) as well as
oscillating movement (180° relative angle). Values close to 1 indicate a tendency to move in a perpendicular direction, and this type of movement was associated more frequently related to contacts. Vt values tend to be lower, as higher speed would be more likely to occur with direct movement, however the larger range in Vt2 values suggests that these oscillating movements are also associated with changes in speed (Figure 7).
Figure 7: Distribution of Vt values for cm10 matched with cm08 for all distance thresholds (a) and distribution of Vt2 values for cm08 matched with cm10 (b).
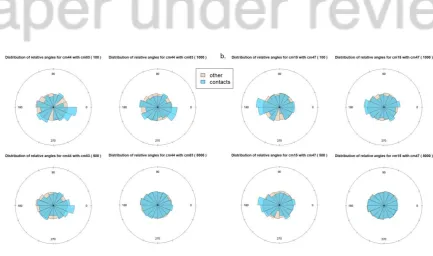
16
Figure 8: Distribution of relative angle values for cm44 matched with cm83 for all distance thresholds (a) and distribution of relative angle values for cm15 matched with cm47 (b).
The three DI metrics measure correlation in direction, step length, or both and can be interpreted as ranging from negative correlation (-1) to positive correlation (1) for DI and DI.theta, while DI.distance ranges from no correlation (0) to positive correlation (1). For both DI and DI.theta, values of 1 were generally associated with contact-related movement, while values close to -1 were more often associated with non-contact-related movement (Figure 9). DI.distance was not a reliable metric here as the approximately hourly fixes varied by up to ~ten minutes, for many dyads a DI-distance value close to 1 occurred when both individuals moved very little but was not indicative of interaction as they were quite far apart. DI.theta was also close to 1 when two individuals did not move, but DI.theta was a more robust metric compared to DI.distance. In general, very similar azimuths for two individuals were less likely to occur randomly than similar step lengths. As the product of DI.theta and DI.distance, DI was centered around zero and generally the movements associated with contacts had higher values than those that were not.
17
3.4
“Interaction” examples
In addition to the examples of the distribution of movement parameter values for individuals in selected dyads shown above, I present examples of different potential dynamic interactions and highlight how they might be empirically detected with the path analytics compared here.
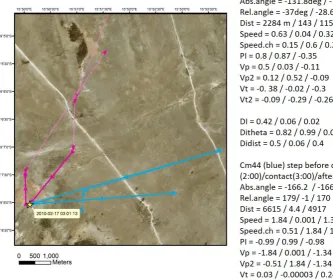
Figure 10 illustrates an interaction marked by very close proximity but relatively short duration, e.g., direct contact required for disease spread. Cm44 and cm83 moved from several kilometres apart to approximately three meters apart at 3:00 on 2010-02-17, then moved to several kilometres apart at the next step. Each individual moved a relatively large distance before and after the step, with a small distance at the contact. However, the actual distances travelled at each step were not similar enough to result in a high DI.dist, and with the exception of the azimuth at the contact, the individuals showed little movement
coherence as measured by the DI metrics. For this type of interaction, there was very little correlation in their movement parameters and the most notable movement pattern was the change in individual parameters: for cm44 in particular, PI ranged from -0.99 to 0.99 and the speed changed 1.84 msec-1.
18
In contrast, Figure 11 highlights an interaction of longer duration during which the individuals are farther apart. On 2010-05-10, the closest cm83 and cm62 are to each other (empirically) is 661 meters at 8:00, however their movements are quite similar as indicated by several high DI values in succession. They crossed paths between 7:00 and 8:00 and this could be an example of step bias, where an interaction is not detected as a result of the temporal resolution of fixes. In addition to the high DI values, their individual movements also show considerable change in values and both have PI values close to 1 preceding the contact.
Figure 11: Example of dynamic interaction cm83 and cm62 with movement parameters associated with contact.
4 Discussion
19
Further, the wide variation across individual jackal’s results suggests that interaction-related movements are typically not symmetric for both individuals in a dyad. This is important as point- and path-based interaction metrics currently used are based on pair-wise measures, which assume interaction is symmetric.
This work highlights the potential for combining proximity with path analytics to study dyadic interactions. While proximity or distance is an important aspect of most types of dynamic interactions of interest in animal movement, it is insufficient for empirically identifying interactions. Two individuals may be very close in time and space but not actually interacting and two individuals who are not empirically close in space and time may interact. Path analytics represent a more robust way of identifying interaction-related movement when combined with proximity explicitly. Unlike path analytics in which movement behaviors such as foraging can be inferred from parameters such as low speed and high relative angle, interaction-related movement is far more complex and unlikely to be associated with specific values of movement parameters. Instead, change in parameter values is more likely to indicate interaction.
In general, movement parameters that measure all three of change, direction, and speed are better able to distinguish contact-related movement. A range of distance values should be used to address different types of interaction as well as issues related to empirical
measurement such as step bias.
Using simulated movement data to compare differences in movement parameters would contribute to a better understanding of how distance thresholds and other subjective decisions affect the results, but as the objective here was to explore whether movement parameters could be differentiated based on spatio-temporal proximity therefore a high quality ‘real’ dataset was considered more important. Next steps would consider simulating different levels of interaction using step selection functions based on ‘suitability’ of
interactions.
Acknowledgements
20
References
[1] Andersson, M. et al. 2008. Reporting Leaders and Followers among Trajectories of Moving Point Objects. GeoInformatica. 12, 4 (Dec. 2008), 497–528.
DOI:https://doi.org/10.1007/s10707-007-0037-9.
[2] Calabrese, J.M. et al. 2018. Disentangling social interactions and environmental drivers in multi-individual wildlife tracking data. Philosophical Transactions of the Royal Society B: Biological Sciences. 373, 1746 (May 2018), 20170007.
DOI:https://doi.org/10.1098/rstb.2017.0007.
[3] Calenge, C. et al. 2009. The concept of animals’ trajectories from a data analysis
perspective. Ecological Informatics. 4, 1 (Jan. 2009), 34–41. DOI:https://doi.org/10.1016/j.ecoinf.2008.10.002.
[4] Calenge, C. 2006. The package “adehabitat” for the R software: A tool for the analysis
of space and habitat use by animals. Ecological Modelling. 197, 3–4 (Aug. 2006), 516–519. DOI:https://doi.org/10.1016/j.ecolmodel.2006.03.017.
[5] Creel, S. et al. 2013. Underestimating the frequency, strength and cost of antipredator responses with data from GPS collars: an example with wolves and elk. Ecology and Evolution. 3, 16 (Dec. 2013), 5189–5200. DOI:https://doi.org/10.1002/ece3.896.
[6] Doncaster, C.P. 1990. Non-parametric estimates of interaction from radio-tracking data. Journal of theoretical biology. 143, 4 (1990), 431–443.
[7] Edelhoff, H. et al. 2016. Path segmentation for beginners: an overview of current methods for detecting changes in animal movement patterns. Movement Ecology. 4, 1 (Sep. 2016), 21. DOI:https://doi.org/10.1186/s40462-016-0086-5.
[8] Gurarie, E. et al. 2009. A novel method for identifying behavioural changes in animal movement data. Ecology Letters. 12, 5 (2009), 395–408.
DOI:https://doi.org/10.1111/j.1461-0248.2009.01293.x.
[9] Gurarie, E. et al. 2016. What is the animal doing? Tools for exploring behavioural structure in animal movements. Journal of Animal Ecology. 85, 1 (2016), 69–84. DOI:https://doi.org/10.1111/1365-2656.12379.
[10] Joo, R. et al. 2018. Metrics for describing dyadic movement: a review. Movement Ecology. 6, 1 (Dec. 2018), 26. DOI:https://doi.org/10.1186/s40462-018-0144-2.
[11] Kays, R. et al. 2015. Terrestrial animal tracking as an eye on life and planet. Science. 348, 6240 (Jun. 2015), aaa2478. DOI:https://doi.org/10.1126/science.aaa2478.
[12] Konzack, M. et al. 2017. Visual analytics of delays and interaction in movement data. International Journal of Geographical Information Science. 31, 2 (Feb. 2017), 320–345. DOI:https://doi.org/10.1080/13658816.2016.1199806.
[13] Krause, J. et al. 2009. Animal social networks: an introduction. Behavioral Ecology and Sociobiology. 63, 7 (May 2009), 967–973. DOI:https://doi.org/10.1007/s00265-009-0747-0. [14] Krause, J. et al. 2013. Reality mining of animal social systems. Trends in Ecology &
Evolution. 28, 9 (Sep. 2013), 541–551. DOI:https://doi.org/10.1016/j.tree.2013.06.002. [15] Laidre Kristin L. et al. 2013. Females roam while males patrol: divergence in breeding
21
Society B: Biological Sciences. 280, 1752 (Feb. 2013), 20122371. DOI:https://doi.org/10.1098/rspb.2012.2371.
[16] Laube, P. et al. 2005. Discovering relative motion patterns in groups of moving point objects. International Journal of Geographical Information Science. 19, 6 (2005), 639–668. DOI:https://doi.org/10.1080/13658810500105572.
[17] Laube, P. and Purves, R.S. 2011. How fast is a cow? Cross‐Scale Analysis of Movement
Data. Transactions in GIS. 15, 3 (Jul. 2011), 401–418. DOI:https://doi.org/10.1111/j.1467-9671.2011.01256.x.
[18] Long, J.A. et al. 2014. A critical examination of indices of dynamic interaction for wildlife telemetry studies. Journal of Animal Ecology. 83, 5 (Sep. 2014), 1216–1233. DOI:https://doi.org/10.1111/1365-2656.12198.
[19] Long, J.A. 2015. Quantifying Spatial-temporal Interactions from Wildlife Tracking Data: Issues of Space, Time, and Statistical Significance. Procedia Environmental Sciences. 26, (2015), 3–10. DOI:https://doi.org/10.1016/j.proenv.2015.05.004.
[20] Long, J.A. and Nelson, T.A. A review of quantitative methods for movement data. International Journal of Geographical Information Science. 1–27.
DOI:https://doi.org/10.1080/13658816.2012.682578.
[21] Long, J.A. and Nelson, T.A. 2012. Measuring Dynamic Interaction in Movement Data. Transactions in GIS. (2012), n/a–n/a.
DOI:https://doi.org/10.1111/j.1467-9671.2012.01353.x.
[22] Long, J.A. and Nelson, T.A. 2013. Measuring dynamic interaction in movement data. Transactions in GIS. 17, 1 (Feb. 2013), 62–77.
DOI:https://doi.org/10.1111/j.1467-9671.2012.01353.x.
[23] Merki, Michael and Laube, Patrick 2012. Detecting reaction movement patterns in trajectory data. Proceedings of the AGILE’2012 International Conference on Geographic
Information Science (2012).
[24] Miller, J.A. 2015. Towards a Better Understanding of Dynamic Interaction Metrics for Wildlife: a Null Model Approach. Transactions in GIS. 19, 3 (Jun. 2015), 342–361. DOI:https://doi.org/10.1111/tgis.12149.
[25] Miller, J.A. 2012. Using spatially explicit simulated data to analyze animal interactions: a case study with brown hyenas in Northern Botswana. Transactions in GIS. 16, 3 (2012), 271–291. DOI:https://doi.org/10.1111/j.1467-9671.2012.01323.x.
[26] Poole, K.G. 1995. Spatial organization of a lynx population. Canadian Journal of Zoology. 73, 4 (Apr. 1995), 632–641. DOI:https://doi.org/10.1139/z95-074.
[27] Powell, R.A. 2012. Diverse perspectives on mammal home ranges or a home range is more than location densities. Journal of Mammalogy. 93, 4 (Sep. 2012), 887–889.
DOI:https://doi.org/10.1644/12-MAMM-5-060.1.
[28] Shirabe, T. 2006. Correlation Analysis of Discrete Motions. Geographic Information Science. M. Raubal et al., eds. Springer Berlin Heidelberg. 370–382.
[29] Whitehead, H. 2009. SOCPROG programs: analysing animal social structures. Behavioral Ecology and Sociobiology. 63, 5 (Mar. 2009), 765–778.
DOI:https://doi.org/10.1007/s00265-008-0697-y.