Available online on 18.10.2019 at http://jddtonline.info
Journal of Drug Delivery and Therapeutics
Open Access to Pharmaceutical and Medical Research© 2011-18, publisher and licensee JDDT, This is an Open Access article which permits unrestricted non-commercial use, provided the original work is properly cited
Open
Access
Research Article
Development and Optimization of Solid Lipid Nanoparticle for Topical
Delivery
Chaudhari Pallavi M
1*, Ghodake Mahananda.V
2Department of Pharmaceutics, Dr. D.Y. Patil College of Pharmacy, Akurdi, Pune – 411044
ABSTRACT
The aim of present work was to develop and evaluate solid lipid nanoparticle (SLNs) based gel for topical delivery of anti-inflammatory drug. Material and method Nabumetone loaded SLNs were developed by hot homogenization followed by ultra- sonication technique using compritol 888 ATO as solid lipid and tween 80 as a surfactant. Developed SLNs were evaluated for particle size, entrapment efficiency ( EE) and drug release profile. Process and formulation parameters were optimized. Differential scanning calorimetry (DSC) and X-ray diffraction (XRD) studies were carried out on SLNs to mark the change in the drug and lipid modification. The Nabumetone based gels were prepar ed using carbopol 940 as gelling agent. Results and conclusion: The F14 batch had shown maximu m entrapment efficiency up to 94.40 and sustained drug release for more than 7 hours. The particle size of optimized batch (F14) was found to be 16.54.
Keywords: Solid lipid nanoparticle, Entrapment efficiency, Colloidal carrier.
Article Info:Received 11 July 2019; Review Completed 18 Aug 2019; Accepted 24 Aug 2019; Available online 18 Oct 2019
Cite this article as:
Chaudhari PM, Ghodake MV, Development and Optimization of Solid Lipid Nanoparticle for Topical Delivery, Journal of
Drug Delivery and Therapeutics. 2019; 9(5-s):105-121 http://dx.doi.org/10.22270/jddt.v9i5-s.3648
*Address for Correspondence:
Chaudhari P.M., Department of Pharmaceutics, Dr. D.Y.Patil College of Pharmacy, Akurdi, Pune – 411044
INTRODUCTION
The skin structure of human skin is a complex structure that potentiates a major route for delivery of the drugs. Skin basically has two main layers – Epidermis and Dermis. The epidermis is the superficial layer of the skin and composed of stratified keratinised squamous epithelium that varies in thickness in different parts of the body. The major types of cells: keratinocytes, melanocytes, Langerhans cell, and merkel cells form the epidermis. The epidermis has following four layers, in most of the regions of the body (1). The stratum
corneum is the outermost layer of the epidermis. The possible pathways of molecular penetration across the stratum corneum include intercellular, transcellular and appendagel.
Stratum Spinosum
Stratum Granulosum
Stratum Lucidum
Stratum CorneumFigure No.1: Anatomy of human skin
Rheumatoid arthritis is a form of arthritis, an autoimmune disease that causes pain, swelling, stiffness and loss of function in the joints and remains the most important form of arthritis seen in rheumatologically practice in the developed world. The geographical distribution of the disease is remarkably homogeneous. The causes of rheumatoid arthritis are still unclear and a wide variety of factors namely genes, environment and hormones are suspected to contribute. Recent years have seen considerable advances in our understanding of both the clinical and basic-research aspects of rheumatoid arthritis. Treatments include medicine, lifestyle changes and surgery. The signs and symptoms, include pain in the joints, swollen and tender joints, including joint inflammation, fatigue etc (4,5).
Etiology
The etiology of RA is not fully understood despite extensive study of metabolic and nutritional factors, the endocrine system, and geographic, psychological, and occupational data. This response supports the suspicion of an infectious origin of the disease process, which includes various bacteria and viruses, but without evidence of precipitating events. Even without this specific knowledge, treatment modalities have been developed that, while not curing the disease, can provide relief from the symptoms of the disease. Evidence points to a complex interplay between environmental and genetic factors. These and other regions of the Major Histocompatibility Complex may confer susceptibility to more severe disease by causing a specific arthrogenic peptide to be presented to CD4+ T cells. Scientists are now focusing on the idea that it is a T-cell-mediated autosomal disease precipitated by both genetic and environmental factors. The pharmacological treatment is done by analgesic, anti-inflammatory agents (6).
Arthritis affects 15% people i.e. over 180 million people in India. Nonsteroidal anti-inflammatory drugs (NSAIDs) are among the most prescribed medications for arthritis. As the use of oral NSAIDs possesses problems as not being patient friendly, cause various gastrointestinal adverse effects, so topical administration of these drugs is always the best choice since adverse effects occur commonly with systemic NSAID therapy (7). Transdermal delivery of nonsteroidal
anti-inflammatory drugs may be an interesting strategy for delivering these drugs to the diseased site. In recent years, solid lipid nanoparticles (SLN) have been used in topical drug formulations and are proven clinically as superior to plain drug topical therapy. Small particle size ensures close contact to the stratum corneum and drug encapsulated in lipid improves selective drug delivery to skin layers. SLN possess a solid matrix, which has the potential to modulate the drug release over a prolonged period of time with a reduced rate of systemic absorption (8).
Solid Lipid Nanoparticles (SLNs)
Solid Lipid Nanoparticles (SLN), which were first mentioned in 1991, are colloidal lipid carriers, solid at room and body temperature. SLN are obtained from GRAS (generally recognized as safe) lipids and surfactants, devoid of toxicity.
SLN have been applied in the pharmaceutical industry for controlled drug release and increasing the bioavailability of trapped active substance by changing the dissolution rate in
parenteral (intravenously, intramuscularly or
hypodermically) oral and rectal therapies, in ophthalmology and in external uses (dermatology, cosmetics).SLN are
considered promising carriers for active cosmetic
ingredients due to many advantages over traditional forms. The SLNs have a number of features determining their eligibility as carriers for cosmetic purposes, such as:
•
Protection of unstable compounds against chemicaldegradations, e.g. retinoid.
•
Controlled active ingredient release.•
The ability to function as occlusal complexes.•
Exhibited potential as UV blockers.Structure and properties of solid lipid nanoparticles: SLN are composed of a core of solid lipid with bioactive material constituting a part of the lipid matrix. Such particle is stabilized by the surfactant layer or a mixture of surfactants
(9).
Advantages of SLN:
• Control and / or target drug release. • Excellent biocompatibility
• Improve stability of pharmaceuticals. • High and enhanced drug content. • Easy to scale up and sterilize.
• Better control over release kinetics of encapsulated compounds.
• Enhanced bioavailability of entrapped bioactive compounds.
• Chemical protection of labile incorporated compounds. • Much easier to manufacture than biopolymeric nanoparticles.
• No special solvent required.
• Conventional emulsion manufacturing methods applicable. • Raw materials required are same as in emulsions.
• Very high long-term stability. • Application versatility.
Solid lipid nanoparticles (SLN) are basically sub-micron colloidal carriers that are mainly pf the composition of physiological lipids, which are dispersed in water or in an aqueous surfactant solution. These are between 50 and 1000nm, size range. The lipid matrixes, used in SLN are made from physiological lipid that decreases the danger of acute and chronic toxicity. They render controlled and targeted release of the incorporated drug, enhance stability of the formulation, avoid the use of organic solvents, help to enhance bioavailability, of encapsulated drug, they offer better reproducibility, by use of various methods of preparation, both hydrophilic and hydrophobic drugs, can be encapsulated in these SLN.
MATERIALS:
Nabumetone was provided as gift sample from Cipla Pharmaceuticals and Research Center, Patalganga, Navi Mumbai. Polymers and excipients such as Compritol ATO888 was obtained from Colorcon Asia Pvt Ltd., Goa. Glyceryl Monostearate, Tween 80, Span 20 and Stearic acid were procured from Research Lab Fine Chem. Mumbai.
METHODS:
EXPERIMENTAL WORK
Preformulation Studies
B. Solubility:
Solubility of drug was determined in Distilled water, methanol and Chloroform, Ethanol.
C. Melting point determination:
Melting point of Nabumetone was determined using capillary tube method. The drug was filled in small quantity into one side sealed capillary tube which was tied to thermometer at its mercury bulb. The thermometer was inserted into Thieles tube containing liquid paraffin in such a way that the upper open end of capillary tube remain above the oil layer. The side arm of Thieles tube was then heated with burner till solid drug melts, and the melting temperature was noted.
D. Partition Coefficient
Determination of partition coefficient was done by shake flask method.
Preparation:
N-Octanol: The determination of the partition coefficient was carried out with high purity analytical grade reagent.
Water: Distilled water was used.
Procedure:
10mg of drug was added to 25 ml of distilled water and 25 ml of n- octanol. It was shaken separately for half an hour. Both phases were then mixed together in a separating funnel and shaken for 4 hrs (on orbital shaker and allowed those to stand to get phase separated).
Calibration curve of Nabumetone
Standard graph of Nabumetone
A precise, sensitive and accurate method for Nabumetone
estimation was developed by using UV visible
spectrophotometer
Determination of wavelength of Nabumetone
Accurate quantity of 10 mg of drug was weighed and transferred to 100 ml volumetric flasks then add 10 ml of methanol and dissolve drug completely; the volume was adjusted up to 100 ml with methanol to get stock solution, further stock solution was diluted suitably to get 10 µg/ml solution, which was analysed by UV-visible double beam spectrophotometer against methanol as a blank to confirm λ
max of Nabumetone. UV spectrum was recorded using UV–
visible spectrophotometer with 1 cm quartz cells (UV-1700 Shimadzu).
Preparation of standard Curve of Nabumetonein methanol
A 10μg/ml stock solution of Nabumetone was prepared. Then aliquots of 0.2, 0.4, .0.6, 0.8, and 1.0 ml of above solution in five different 10 ml volumetric flask and volume up to 10 ml with methanol were made. Absorbance of series of solution was taken and a graph of absorbance vs. concentration was plotted and was found to be linear over a range of 2 to 10μg/ml indicating its compliance with Beer’s law.
The Linear Regression Analysis:
The linear regression analysis was done on Absorbance points. A straight line equation (y = mx + c) was generated to facilitate the calculation of amount of drug.
F) FT-IR spectrum:
The drug and Compritol ATO 888 was subjected to FT-IR studies for the purpose of characterization. The scanning was
performed between 4000 cm-1to 400cm-1 range. (JASCO
4100, Japan)
G) Differential Scanning Calorimetry (DSC):
DSC studies of pure Nabumetone, Compritol ATO 888, were carried out. Accurately weighed samples were carefully added in DSC aluminum cup and heating curves were recorded in temperature range of 40–280 oC at a heating rate
of 10oC/min under inert atmosphere. The study was carried
out using Differential Scanning Calorimeter. (DSC 60 Shimadzu, Japan)
H) X-ray diffraction study
XRD study was performed to analyse crystalline or amorphous nature of the excipients and drug. X-ray powder diffraction studies of pure Nabumetone, Compritol ATO 888 were carried out using Advance X-ray Diffractometer (Bruker AXS D8 Advance XRD, Germany).
Solubility Studies:
Solubility study of Nabumetone in different lipids and surfactants:
Solubility of drug must be quantified in each of the excipient used for preparation of SLNs. This quantification helped in determination of the loading dose of final dosage form. Besides this, selection of the specific component becomes easy after comparative analysis of drug solubility in different solvent.
Solubility study of Nabumetone in different lipids
Solubility of the drug in a lipid is a key factor to achieve high entrapment of the drug into the lipid matrix. Therefore, solubility of drug in various lipids was determined in order to determine the lipid having maximum potential to solubilize the drug.
Procedure:
Weighed amount of lipid (100 mg) was added to a glass vial. Drug was added to the vial in gradually increasing amount. The above mixture was heated to a temperature above 5– 10°C of the lipid’s melting point. A transparent solution of the drug into the melted lipid indicated solubilisation of the drug into the lipid melt. This serves as an end point. The amount of drug added was calculated.
Solubility study of Nabumetone in different surfactants
Procedure:
Solubility studies were conducted by adding an excess amount of Nabumetone in a vial containing 1 ml of the surfactant separately. The mixture was mixed manually for 30 min. After that all mixtures were sonicated for 30 min. Then these mixtures were shaken using orbital shaker for 6 hrs. The equilibrated sample was centrifuged at 11000 rpm for 30 min. The undissolved Nabumetone settles down at the bottom. The supernatant was taken out and diluted with
methanol for quantification of by UV spectrophotometer at λ
max of drug.
Table No. 1: Different lipids and surfactant used for Solubility study
Sr.no Lipids Surfactants
1 Glyceryl
Monostearate
Tween 60
2 Compritol ATO 888 Tween 80
3 Stearic acid Span 20
Formulation of Nabumetone loaded Solid lipid nanoparticles
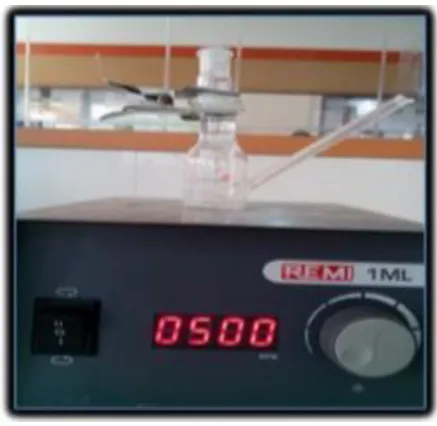
SLNs were prepared by hot homogenization technique and Ultrasonication technique which requires two immiscible phases Oil and aqueous phase with an emulsifier which helps in formation of an emulsion by reducing the interfacial tension.
Method of Preparation of Nabumetone loaded Solid lipid nanoparticles hot homogenization technique and Ultrasonication technique (10,11,12)
SLNs were also prepared by ultra-sonication method. For smaller particle size, combination of both ultrasonication and high speed homogenization is required. Drug was added to hot lipid melt. Hot aqueous phase was added to the hot lipid melt, emulsified by probe sonicator or by using high speed stirrer. Pre-emulsion was formed, sonicated using probe sonicator, o/w nanoemulsion was formed which was filtered to obtain SLNs.
Optimization of formulation parameters and process variables for preparation of Nabumetone loaded SLNs Hot homogenization followed by Ultrasonication method
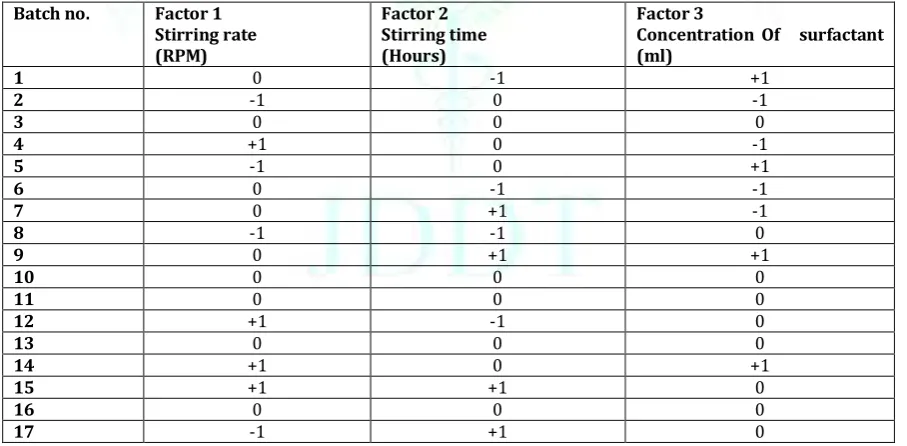
The Box- Behnken design for Stirring speed, Stirring time & surfactant Tween 80 with 3 factors, 3 level and 17 runs was selected for optimization study separately and design expert 10 software was used. The independent variables selected were stirring speed X1, Stirring time X2 & surfactant concentration X3and dependent variables were particle size (Y1), entrapment efficiency in percentage (Y2) with high, medium and low level and formulated as per Table No. 2. Optimization was performed to find out the level of independent variables that would yield a minimum value of the particle size (Y1), maximum value of entrapment efficiency (Y2) after optimization, the results were compared.
Table No.2: Independent variables and their corresponding levels of Nabumetone loaded SLN preparation for Box-Behnken design
Variables
Levels
-1 0 +1
Stirring speed (rpm) 1200 1350 1500
Stirring time (Hour) 3 4 5
Surfactant concentration (ml) 0.5 1 1.5
Table No. 3: Formulation table for the preparation ofNabumetone loaded SLN preparation
Batch no. Factor 1
Stirring rate (RPM)
Factor 2 Stirring time (Hours)
Factor 3
Concentration Of surfactant (ml)
1 0 -1 +1
2 -1 0 -1
3 0 0 0
4 +1 0 -1
5 -1 0 +1
6 0 -1 -1
7 0 +1 -1
8 -1 -1 0
9 0 +1 +1
10 0 0 0
11 0 0 0
12 +1 -1 0
13 0 0 0
14 +1 0 +1
15 +1 +1 0
16 0 0 0
17 -1 +1 0
Characterization of Nabumetone loaded solid lipid nanoparticles
Evaluation of batches for optimization
1. Physical Appearance: The prepared Nabumetone SLNs were inspected for the colour, homogeneity, consistency
2. Particle size analysis
By Digital Microscope
The particle size was determined using an optical microscope with software (Pixel Pro). The average particle size was expressed in terms of nm. SLNs were mounted on slide and placed over stage of micrometer the software (Pixel Pro) for image analysis of nanoparticles. Each
determination was carried out on a minimum of 100 particles and their mean was reported.
By Zetasizer 1000 HS
The formulation (0.1 ml) was dispersed in 50 ml of water in a volumetric flask and gently mixed by inverting the flask. Measurement was done using a Zetasizer 1000 HS (Malvern Instrument, UK). Light scattering was monitored
3. Drug entrapment efficiency (13)
collected 1ml liquid was filtered to measure the free drug concentration after suitable dilution with distilled water. The absorbance was measured at 261 nm in a UV Spectrophotometer to calculate the entrapment efficiency using following formula:
Entrapment efficiency (%) = wt. of drug incorporated / wt. of drug initially taken x 100
4. In vitro analysis
In-vitro release studies were performed using artificial cellophane membrane (Molecular weight 12000). For this experiment a vertical Franz diffusion cell was used. The artificial membrane was securely placed between the two halves of the diffusion cell. The receptor compartment contains phosphate buffer (pH 7.4), its temperature maintained at 37±0.5ºC and stirred continuously using magnetic stirrer. A predetermined amount of Nabumetone loaded SLN containing 10 mg of Nabumetone was placed on the donor side. One ml of the sample was withdrawn from the receptor compartment at definite time intervals and replaced with equal volume of fresh receptor fluid. The aliquots were suitably diluted with the receptor medium and analysed by UV spectrophotometer. Measurements were done in triplicate and their means were reported.
5. Scanning electron microscopy (14,15)
Surface morphology of particles was studied with scanning electron microscopy (SEM). SLNs were mounted on double-faced adhesive tape and coated with a thin gold–palladium layer by sputter-coated unit and analysed with scanning electron microscope (JEOL JSM-6360 A).
6. FT-IR spectrum:
The SLNs optimized formulation was subjected to FT-IR studies for the purpose of characterization. The scanning was performed between 4000 cm-1to 400cm-1 range. (JASCO 4100, Japan) (16)
7. Differential Scanning Calorimetry (DSC):
DSC studies of the lyophilized SLN powder were carried out. Accurately weighed samples were carefully added in DSC aluminium cup and heating curves were recorded in temperature range of 40–280 ºC at a heating rate of 10ºC/min under inert atmosphere. The study was carried out using Differential Scanning Calorimeter. (DSC 60 Shimadzu, Japan)
8. Zeta potential measurement
Zeta potential distribution was determined by using a zetasizer (Horiba, Japan SZ 100). One mg of freeze dried Nabumetone SLN was dispersed in distilled water. To prevent the agglomeration, the dispersed solution was placed for 5 min in ultra sonicator bath. Then the sample was taken in the glass cuvette and zeta potential was measured in range from -200 to +200mv.
9. pH measurement
The pH value of optimized Nabumetone SLN was measured by pH meter (Equip-tronics)
10. Ex-vivo drug deposition study:
The Ex-vivo diffusion study was performed on excised Goat skin. The abdominal skin of goat was shaved, carefully placed on the Franz diffusion cell with the epidermal side
facing the donor compartment and the dermal side in contact with the receptor solution. Sample was applied to donor compartment. The receptor compartment contains phosphate buffer (pH 7.4), its temperature maintained at 37±0.5ºC and stirred continuously using magnetic stirrer. A predetermined amount of Nabumetone loaded SLN containing 10 mg of Nabumetone was placed on the donor side. One ml of the sample was withdrawn from the receptor compartment at definite time intervals and replaced with equal volume of fresh receptor fluid. The aliquots were suitably diluted with the receptor medium and analysed by UV spectrophotometer. Measurements were done in triplicate and their means were reported (17).
Figure No.2: Franz diffusion cell apparatus
Carrageenan induced rat paw oedema
This study was done on Wistar rats. 18 rats were selected of 250gms. Three groups were utilized, stating control, test and standard, with 6 rats in each group. They were kept on fasting condition for 24 hours. Next day, fresh solution of 1% carageenan was prepared and further used for the study. The rats were labelled properly, and their paw size was measured using vernier calliper. The paw was marked, and the left paw was injected with carageenan solution using tuberculin syringe, and again the paw volume was measured using vernier calliper. The test group was drug loaded solid lipid nanoparticle gel was applied. To the standard group, the marketed gel was applied, and after every hour the paw volume was measured. Total inhibition was calculated (18,19).
The percentage (%) inhibition of edema is calculated using the formula
Percentage Inhibition =
Vc – Vt/ Vt X100
Where, Vc is paw volume in control; Vt is paw volume in test drug
RESULTS AND DISCUSSION
Preformulation of Nabumetone:
A. Physical Appearance:
Table No.4: Physicochemical properties of Nabumetone
Sr.No. Parameters Observation
1 Physical state Crystalline powder form
2 Colour White
3 Odour Typical odour
B. Solubility:
Solubility of drug in various solvent was found to be as shown in Table No. 5.
Table No. 5: Solubility studies of Nabumetone
Sr.No. Solvent Solubility
1 Distilled water Insoluble
2 Ethanol Slightly soluble
3 Methanol soluble
C. Melting point:
Melting point of drug was observed at 80-81oC
D. Partition Coefficient:
Partition coefficient (n-octanol/water) of Nabumetone was determined by shake flask method. Partition coefficient (log P) was found to be 3.08
E. Calibration curve of Nabumetone:
Nabumetone solution which was scanned in the range of 400 nm to 200 nm showed maximum absorption (λ max) at 261 nm. Absorbance of prepared solution was measured at 261 nm using UV spectrophotometer. Drug followed Beers and Lamberts law in the range of 2 to 10μg/ml. Calibration curve and related data are given in the Table No. 6 and Figure No.3.
Table No.6: Absorbance data of Nabumetone in Methanol
Sr.no. Concentration (ug/ml) Absorbance
1 2 0.207
2 4 0.410
3 6 0.634
4 8 0.874
5 10 1.102
Figure No. 3: Calibration curve of Nabumetone
F) FT-IR spectrum:
Figure No. 4: FT-IR spectrum of Nabumetone
Table No.7: FT-IR spectrum interpretation of Nabumetone
Sr.no. Wavelength cm-1 Functional group
1 2950-2840 -C-H stretching
2 1600-1400 C=C aromatic
3 1400-1365 CH3 bend
4 1200-1020 O-CH3 ether
y = 0.2254x - 0.0308
R² = 0.9992
0
0.2
0.4
0.6
0.8
1
1.2
2
4
6
8
10
A
b
so
rb
a
n
ce
Figure No. 5: FT-IR spectrum of Compritol ATO 888
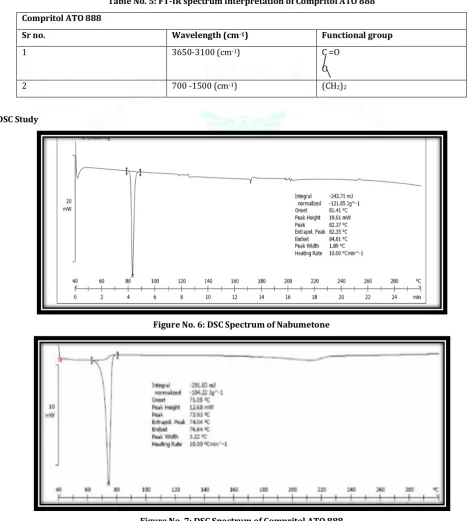
Table No. 5: FT-IR spectrum interpretation of Compritol ATO 888
Compritol ATO 888
Sr no. Wavelength (cm-1) Functional group
1 3650-3100 (cm-1) C =O
O
2 700 -1500 (cm-1) (CH2)2
DSC Study
Figure No. 6: DSC Spectrum of Nabumetone
Figure no 6 and 7 shows the differential scanning calorimetry (DSC) profile of, Nabumetone and Compritol ATO 888.
The Nabumetone and Compritol ATO 888 showed sharp endothermic peak at 82.37 and 73.93 ◦C, respectively, corresponding to their melting temperatures. Sharp peak of drug showed purified form of drug.
X-ray diffraction study
Figure No. 8: X-ray diffraction of Nabumetone
Figure No.8 and 9 shows the X-ray diffraction profile of Nabumetone and Compritol .The X-ray diffractogram of Nabumetone indicated high intensity of peak which indicated crystalline nature of peak
Figure No. 9:X-ray diffraction of Compritol ATO 888
Solubility study of Nabumetone in different lipids and surfactants: Lipid screening:
Lipid based formulation can be used to increase drug
absorption by increasing solubilisation, enhancing
permeability, reducing drug metabolism. The pharmaceutical and pharmacological implication were evaluated the drug-lipid miscibility in solid drug-lipid nanoparticle.
The solubility of Nabumetone in various pharmaceutically accepted lipids was determined as shown in Table No. 6 and Figure No. 10, in order to choose the lipid for Nabumetone loaded SLN.
Table No. 6: Solubility study of Nabumetone in different lipid
Lipids Concentration (mg/ml )
Glyceryl monostearate 3.10
Compritol ATO 88 47.90
Sterric acid 15.45
Figure No. 10: Solubility study of Nabumetone in different lipids
The solubility of Nabumetone was higher in compritol ATO 888. So, on the basis of solubility compritol ATO 888 was selected for the further formulation. Higher concentration of compritol ATO 888 shows higher entrapment efficiency of drug, but excess amount of lipid retard the drug release through SLNs. The lower concentration of lipid shows lower entrapment efficiency of drug. Therefore the optimized quantity was used for the formulation according to particle size, entrapment efficiency and dug release.
Selection of surfactant and co-surfactant:
The miscibility of a drug and excipients was dependent upon the intermolecular interactions formed between the drug (solute) and excipients (solvent).
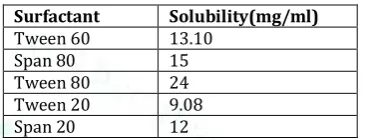
The solubility of Nabumetone was determined in various surfactants is as shown in Table No. 7 and Figure No. 11.
Figure No. 11: Solubility study of Nabumetone in different Surfactants
Table No. 7: Solubility study of Nabumetone in different surfactant
Surfactant Solubility(mg/ml)
Tween 60 13.10
Span 80 15
Tween 80 24
Tween 20 9.08
Span 20 12
The different types of surfactant Tween 80, Span 80, Tween 60, Tween 20, Span 20 were used as surfactant. Depending upon the solubility of drug in the surfactant, Tween 80 was selected as surfactant. The type and concentration of surfactant affect the particle size, entrapment efficiency as well as stability of nanoparticles. Low concentration tween 80 will not be sufficient to give sphericity to the nanoparticles resulting into increased particle size and form aggregative mass of nanoparticles. High concentration of Tween 80 may lead to bridging between nanoparticles and also cause foaming. So, the optimum quantity was selected according to particle size, entrapment efficiency and drug release.
Formulation of Nabumetone loaded Solid lipid nanoparticles
SLNs were prepared by hot homogenization technique and Ultrasonication technique which requires two immiscible phases Oil and aqueous phase with an emulsifier which helps in formation of an emulsion by reducing the interfacial tension. All 17 batches were formulated separately according to Box- Behnken design by using combination of ultra-sonication followed by homogenization.
Optimization of Nabumetone loaded SLNs by using Box-Behnken design
Box-Behnken design was used to study the effect concentration of surfactant, stirring time & stirring speed on different parameter like entrapment efficiency, particle size and drug release, as depicted in Table No. 8.
0 10 20 30 40 50 60
Glyceryl monostearate
Compritol ATO 88 Sterric acid Transcutol
C
o
n
ce
n
tr
a
ti
o
n
in
m
g
/m
l
Type of lipid
0 5 10 15 20 25 30
Table no 8: Box Behnken design for optimization of Nabumetone loaded SLNs
Sr. no Factor 1 Factor 2 Factor 3 Response 1 Response 2
A stirring speed B stirring time C surfactant Entrapment efficiency Particle size
(RPM) (Hrs) (ml) (%) (nm)
1 1350 3 1.5 87.43 30.54
2 1200 4 0.5 75.41 24.21
3 1350 4 1 90.57 26.62
4 1500 4 0.5 86.43 24.50
5 1200 4 1.5 89.84 11.34
6 1350 3 0.5 79.68 34.02
7 1350 5 0.5 80.25 39.54
8 1200 3 1 78.27 21.70
9 1350 5 1.5 91.25 23.25
10 1350 4 1 90.57 26.62
11 1350 4 1 90.57 26.62
12 1500 3 1 92.85 26.23
13 1350 4 1 90.57 26.62
14 1500 4 1.5 94.40 16.54
15 1500 5 1 88.49 18.54
16 1350 4 1 90.57 26.62
17 1200 5 1 85.12 19.62
Optimization of stirring speed and stirring time
Speed and time for stirring was evaluated by particle size. It was seen that the particle size lowest at speed 1500 rpm for 4 hrs. The effect of stirring speed and time on particle size was evaluated for different batches. Firstly, the Nabumetone SLNs was analysed at 1000, 1500 and 2000 rpm for 1hrs. After it the optimization of stirring time was carried out for time 1, 2 and 3 hrs. Larger particles were obtained at low stirring rates and time, whereas smaller particle sizes were observed at high stirring rates and time. But highest stirring rate larger particles were observed. Focusing on minimal particle size the optimum stirring condition for SLNs was found at stirring speed 1500 rpm time for 4hrs. The particle size increases with increasing in stirring rate and time, may be due to the highest kinetic energy of the system with higher agitation forces for prolonged periods. Because of this energy smaller particle and even larger particle have tendency to bind together with each other and surrounding particles by overcoming the interfacial energy barrier.
Sonication time (Ultra-sonication method)
Sonication time was increased (40 min) it showed decreased in particle size but after some time SLNs particles go breakdown and formed irregular shape particles and also decreased the entrapment efficiency of drug. Sonication time decreased (5 min) it formed aggregative mass of Compritol ATO 888 and increased particle size. Sonication times (10min) were selected for optimization study.
Characterization of Nabumetone loaded solid lipid nanoparticles
Evaluation of batches for optimization
1. Physical Appearance:
The prepared Nabumetone SLNs were homogeneous, white, and consistent.
2. Particle size:
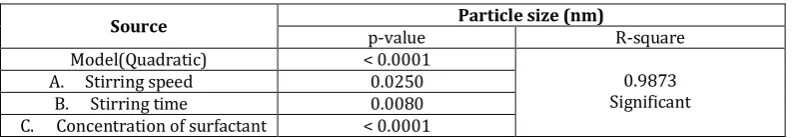
Table No. 9: ANOVA for responses surface (Particle size)
Source Particle size (nm)
p-value R-square
Model(Quadratic) < 0.0001
0.9873 Significant
A. Stirring speed 0.0250
B. Stirring time 0.0080
C. Concentration of surfactant < 0.0001
For the particle size, the value of correlation (R2) was found to be 0.9873, indicating good fit of the model. P - Value for all the independent variable was less than 0.05 that means it has significant model terms. Low P- value was likely to be a meaningful addition to model because changes in the predictor’s value are related to changes in the response variable.
The equation in terms of coded factors used to make predictions about the response of particle size for given level of each factor as mentioned below. The coded equation was useful for identifying the relative impact of the factor by comparing the factor coefficients.
Final equation in terms of coded factor
Particle size = 26.12+1.12*A1.44*B5.08*C 1.40*AB -1.23*AC + 3.20*BC -8.80 A2+3.80 B2+1.40 C2
The equation in terms of coded factors can be used to make predictions about the response for given levels of each factor. By default, the high levels of the factors are coded as +1 and the low levels of the factors are coded as -1. The coded equation is useful for identifying the relative impact of the factors by comparing the factor coefficients.
Final equation in terms of actual factor
Particle size = 675.50125 + 1.09573 x Stirring speed
-1278500 x Stirring time -17.99500 x Surfactant
The equation in terms of actual factors can be used to make predictions about the response forgiven levels of each factor. Here, the levels should be specified in the original units for each factor. This equation should not be used to determine
the relative impact of each factor because the coefficients are scaled to accommodate the units of each factor and the intercepts not at the Centre of the design space.
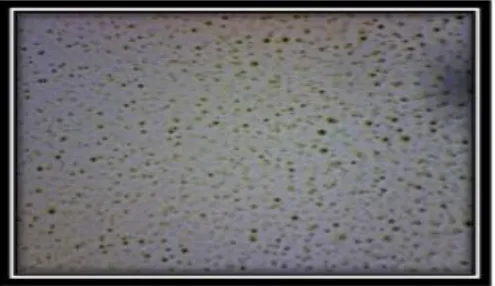
Figure no. 12: Optical microscopy of optimized batch (F14) of Nabumetone loaded SLN
Figure No. 13: Contour plot for stirring speed and stirring time affecting on particle size
Effect of Stirring speed and time on particle size:
There is inverse relationship between homogenization speed and time. homogenization speed and time increase (9000 rpm for10min) particle size was spherical but after some time particle get breakdown and form irregular shape
particle, less entrapment of drug was observed.
homogenization speed and time (5000 rpm for 150min) the compritol ATO 888 form aggregate mass that increased in the particle size of SLNs The homogenization speed and time (6000 rpm 30min)showed higher entrapment efficiency and reduce particle size.
Effect of surfactant concentration on particle size:
According to Figure No.13 and 14, when concentration of surfactant increased, there is reduction in the particle size.
This was to be expected, because a higher surfactant concentration will cover the surface of the lipid phase, resulting in smaller particle size. The presence of a sufficient amount of surfactant was proposed to help the solubilisation and stabilization of drug molecules within the lipid matrix and at the surface.
The decrease in particle size at high surfactant concentration might be due to effective reduction in interfacial tension between the aqueous and lipid phases leading to the formation of emulsion. Higher surfactant concentration effectively stabilised the particle by forming a stearic barrier on the particle surface and thereby protect smaller particle
and prevent their coalescence into bigger ones.
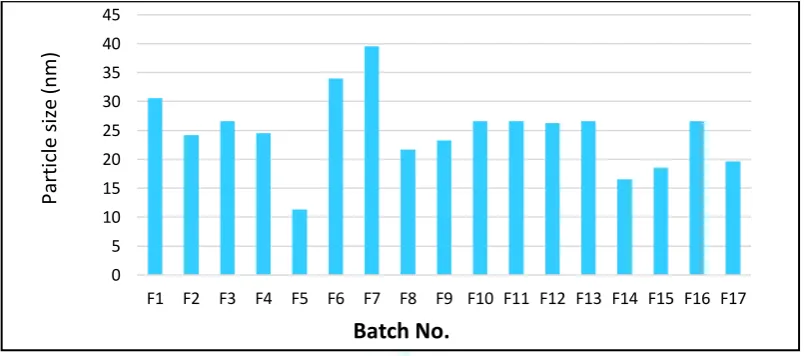
Figure No. 15: Batch wise results of particle size
The batch wise result of particle size was shown in Figure No.15, batch no F- 5 and F-14 showed lowest particle size while F -6 and F-7 showed highest particle size.
Entrapment efficiency:
Table No. 10: ANOVA for responses surface (Entrapment Efficiency)
Source Drug Entrapment Efficiency (%)
p-value R-square
Model(Quadratic) < 0.0001
0.9943 Significant
A. Stirring speed < 0.0001
B. Stirring time 0.0064
C. Concentration of surfactant < 0.0001
For the entrapment efficiency, the value of the correlation coefficient (R2) was found to be 0.9943 indicating good fit of the model. P value for all the independent variables was below 0.05 that means it has significant model terms. The equation in terms of coded factors can be used to make prediction about the response for given levels of each factor. The coded equation is useful for identifying the relative impact of the factors by comparing the factor coefficient.
Final equation in terms of coded factors:
Entrapment efficiency = 90.57+4.19 *A +0.8600 *B +5.14 *C -2.80 *AB -1.62 *AC +0.8125*BC -1.05A2-3.13 B2-2.79 C2
It shows that as the concentration of surfactant increases, EE decreases. This may be due to increase in the partition of the drug from internal to external phase of the medium at the high concentration of surfactant.
0 5 10 15 20 25 30 35 40 45
F1 F2 F3 F4 F5 F6 F7 F8 F9 F10 F11 F12 F13 F14 F15 F16 F17
Batch No.
P
art
ic
le
si
ze
(nm
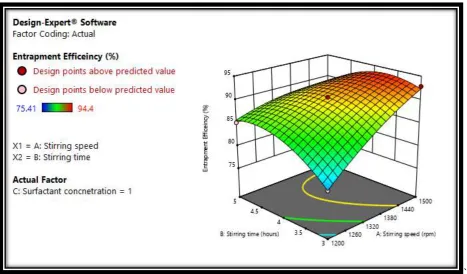
Figure No. 16: Counter plot for the effect stirring speed &stirring time on Entrapment efficiency
`
Figure No. 17: 3D plot for the effect stirring speed & stirring time on Entrapment efficiency
From the response 3D plot for the EE (Figure no.17), it can be seen that as the concentration of surfactant increases, EE decreases. This may be due to decreases in the particle size. It may also be due to increases in the partition of the drug from internal to external phase of the medium at the high concentration of surfactant.
Effect of stirring speed and time on entrapment efficiency
The entrapment efficiency was directly proportional to stirring speed. And increase in stirring speed a vigorous uniform and rapid division of nanoparticle this may have less chances of coalescing into bigger particle. This leads to decrease in particle size with increased in stirring rate as shown in Figure no.18.
Figure No. 18: Batch wise results of entrapment efficiency
In vitro drug release study
The in-vitro release of Nabumetone SLN was varied in amount according to concentration of emulsifying agents used in formulations it was concluded that SLN showed better drug release within 7 hours (Figure no. 19.).
Figure No. 19: Batch wise results of in vitro drug release
Evaluation for optimized of Nabumetone loaded SLN
Batch F-14 shows smaller particle size, higher entrapment efficiency and more drug release due of higher concentration of surfactant. So, batch F-14 was finally optimized and further used for the formulation and evaluation
1. Particle size:
By Digital Microscope:
The optimized batch was subjected to particle size. The particle size was approximately 16.54.nm (Figure No 20.) which is depends on surfactant concentration stirring rate and stirring time.
Figure No.20: Optical microscopy of optimized formulation (F14)
0 50 100
1 2 3 4 5 6 7 8 9 10 11 12 13 14 15 16 17
Batch No.
%
E
n
tr
a
p
m
e
n
t
e
ff
ic
ie
n
cy
0
20
40
60
80
100
1
2
3
4
5
6
7
8
9
F1
F2
F3
F4
F5
F6
F7
F8
F9
F12
F14
F15
F17
Dr
u
g
r
e
le
a
se
(
٪
)
2. Dilution test:
It was confirmed that W/O type of emulsion was formed and following table showed the observation and interference.
Table No 11: Observation for dilution test
Test no. Observation Interference
1. Emulsion did not break O/W type of emulsion was not formed
2. Emulsion break W/O type of emulsion was formed
3. pH:
The pH of optimized formulation of Nabumetone loaded SLNs was found to be 6 and pH of the human skin is in the range of 4 to 7, so it was concluded that prepared formulation was compatible with human skin.
4. IR and DSC spectra:
The result of optimized formulation Figure No. 21 and 22 was indicated that there was not formation of new peak so the drug and excipients were compatible with each other and revealed that Nabumetone was successfully incorporate into the Nabumetone SLNs.
Figure No. 21: FTIR spectra of optimized batch of Nabumetone SLN
Figure No. 22: DSC spectra of optimized batch (14) of Nabumetone SLN
Zeta potential measurements:
Zeta potential of SLN formulations were determined to observe net surface charge on SLN and surrounding system. Zeta potential of SLN was determine to understand the stability aspect and quality control measure. The magnitude of the zeta potential gives the indication of the potential stability of the colloidal system. If all the particles in suspension have large negative or positive zeta potential
Figure No. 23: Zeta potential of optimized batch (F14)
Figure No. 24: SEM of optimized batch (F14)
Preparation of SLNs based gel:
The SLNs dispersion was converted into gel carrier system using gelling agents such as Polycarbophil, Xanthan gum and Carbopol (different grades 940, 934). Gelling agent at various concentrations were dispersed under stirring in to the SLNs dispersion till they were uniformly mixed to form gel with suitable consistency In some cases, pH of dispersion was adjusted in between 5.5-6.5 by triethanolamine to form gel with good consistency.
Evaluation of gels
A. Homogeneity
All developed gels were tested for homogeneity by visual inspection after the gels have been set in container. They were tested for their appearance and presence of any aggregates.
B. Physical evaluation
Physical parameters such as colour and appearance were evaluated by physical inspection.
C. pH measurement
pH of the gel was measured by using pH meter (Remi, INDIA).pH of formulation observed in the range of 6.8-7.1.which indicated prepared formulation compatible with skin. pH of optimized batch (F14) was found to be 6.8.
D. Viscosity and Rheological studies
The viscosity of gels was determined by using Brookfield viscometer. The gel was placed in the sample holder and the suitable spindle selected was lowered perpendicularly into the sample. The spindle was attached to viscometer and then it was allowed to rotate at a constant optimum speed at room temperature. The readings were noted after 2 minutes. The result of viscosity showed that increasing concentration of carbopol 940 from 0.25٪ to 0.5٪ viscosity was found to increase. It was observed that formulation were found to be liquid form before adding triethanolamine addition of triethanolamine cause increase in viscosity which transform liquid phaseto gel such result observed due to ionic repulsion of carboxylate group and the polymer become stiff and rigid there by increase the viscosity of formulation.
Viscosity of optimized batch (F14) was found to be 2618cps.
E. Spreadability
It observed that increasing the concentration of the Carbopol 940 was associated with the decrease in spread ability. As the Carbopol concentration increased viscosity and gel strength of formulation was found increase and spread ability was decrease spread ability play important role in patient compliance and help in uniform application of gel to the skin. A good gel takes less time to spread and will have good spread ability.
Carrageenan induced rat paw edema results
Figure 25: Effect of % inhibition of paw edema in carrageenan induced rat paw edema
The anti-inflammatory action of the solid lipid nanoparticles was observed and it depicted the significant inhibition, when compared to the carrageenan induced edema, and was comparable to that of the standard.
CONCLUSION:
Thus, the study of inclusion of Nabumetone in SLN, by use of optimization Box-Benhken design showed the prolonged action, with good particle size and entrapment efficiency. The anti-inflammatory study also showed inhibition in the edema, when compared to the standard.
ACKNOWLEDGMENT:
We are thankful to Savitribai Phule Pune University, Pune for financial support for this research work as well for providing the SEM facility.
CONFLICT OF INTERESTS
Declared none
REFERENCES:
1. Tortora G.J., Grabowski S., Principles of Anatomy and Physiology, John Wiley and Sons Inc., 10th edition, 140-146.
2 .Waugh A., Grant A., Anatomy and Physiology in Health and Illness, Churchill Livingstone, 9th edition, 362-366.
3. Harsh Mohan, Textbook of Pathology, Jaypee Brothers Medical Publisher (P) Ltd New Delhi, 5th edition, 802- 804.
4. Semerano, L.; Minichiello, E.; Bessis, N.; Boissier, M.C. Novel Immunotherapeutic Avenues for Rheumatoid Arthritis. Trends Mol. Med. 2016, 22, 214–229
5. McInnes, I.B.; Schett, G. The pathogenesis of rheumatoid arthritis. N. Engl. J. Med. 2011, 365, 2205–2219.
6. Scott D., Wolfe F., Huizinga T., Rheumatoid Arthritis. Lancet. 2010; 376(9746):1094–1108.
7. Gibofsky Allan. Epidemiology, Pathophysiology, and Diagnosis of Rheumatoid Arthritis: A Synopsis. Am J Manag Care. 2014;20:S128-S135.
8. Vivian P., Bykerk., PoonehAkhavan., Glen S. Hazlewood. Canadian Rheumatology Association Recommendations for
Pharmacological Management of Rheumatoid Arthritis with Traditional and Biologic Disease-modifying Antirheumatic Drug Journal of Rheumatology. -2011.Vol 38, 1-24.
9. Rainer H., Müller., KarstenMader., Sven Gohla. Solid lipid nanoparticles (SLN) for controlled drug delivery – a review of the state of the art. European Journal of Pharmaceutics and Biopharmaceutics. -2000. Vol 50,161-177.
10. Sadiq A, Alla A, Rassol A, Formulation and Evaluation of silbinin loaded solid lipid nanoparticles for peroral use targeting lower part of gastrointestinal tract, Int J of Pharm and Pharm sci, 2014;6(1):55-67.
11. Ekambaram P, Sathali A Formulation and Evaluation of Solid Lipid Nanoparticles of Ramipril, J Young Pharmacist, 2011; 3:216-20.
12. Müller RH, Mäder K, Gohla S. Solid lipid nanoparticles (SLN) for controlled drug delivery – A review of the state of the art. Eur J Pharm Biopharm 2000; 50:161-77.
13. Luo Y, Chen D, Ren L, Zhao X, Qin J. Solid lipid nanoparticles for enhancing vinpocetine’s oral bioavailability. J Control Release 2006; 114:53-9.
14. Abdelbary G, Fahmy RH. Diazepam – loaded solid lipid nanoparticles: Design and characterization. AAPS PharmSciTech 2009;10:211-9.
15. Heinzelmann ME, Wiesendanger R. Scanning tunneling microscopy II surface science. Newyork: Springer verlogg; 1992. P. 99-149.
16. Bhalekar MR, Pokharkar V, Madgulkar A, Patil N, Patil N. Preparation and evaluation of miconazole nitrate-loaded dolid lipid nanoparticles for topical delivery. AAPSPharmSciTech 2009; 10:289-96.
17. Cavalli R, Marengo E, Rodriguez L, Gasco MR. Effects of some experimental factors on the production process of solid lipid nanoparticles. Eur J Pharm Biopharm. 1996; 43:110–5.
18. Winter CA, Porter CC. Effect of alteration in sidechains upon anti-inflammatory and liver glycogenactivities in hydrocortisone ester. J Am Pharmacol Soc. 1957; 46:515-9.
19. Di Rosa M, Giroud JP, Willoughby DA. Studies onthe mediators of the acute inflammatory responseinduced in rats in different sites by carrageenan and turpentine. J Pathol. 1971; 104:15-29.
0
1
2
3
4
5
6
0
1
2
3
4