QUANTIFYING "BAIT QUALITY" FROM NUMBER OF
RANDOM ENCOUNTERS REQUIRED TO KILL A PEST
C. L. BATCHELER
Protection Forestry Division, Forest Research Institute, PO Box 31-011, Christchurch
SUMMARY: Information on toxic loading and piece-weight distribution are used to calculate an index of the number of baits which an animal must encounter and eat before the probability of death exceeds 99%. It is termed the 99% bait quality index (99BQI).The index shows that, on average, rabbits of median susceptibility to 1080 must find 4.2-5.4 unscreened carrot baits; possums of median susceptibility must find 6.5-8.4. Indices for 1080-tolerant rabbits and pos-sums ranged from 6.2-15.6 baits. Indices for machine-screened baits range from 1.9-3.2 for rabbits of median susceptibility, and 3.2-4.4 for tolerant individuals. Corresponding figures for possums are 2.4-3.8 and 3.2-5.7. Indices for hand-screened bait of appropriate toxic loading are 1-2 baits.
It is argued that when poorly prepared baits, containing many sub-lethal fragments, are used, large amounts of bait must be distributed to enable an intended victim to find many pieces before poison-induced anorexia suppresses further feeding. If bait is scarce, the chances of survival are high, and this is suggested as a possible cause of failure of some control operations. Ways by which the use of large quantities of poorly prepared bait increase the risk of incidental poisoning of birds are also discussed.
INTRODUCTION
Where toxic baits are set out in piles or large cakes at feeding stations, or liberally sprinkled along lines, as are common practices for control of rodents and rabbits (Oryctolagus cuniculus), there is little doubt that an intended victim, once it has found a station, can find sufficient bait to consume a lethal dose. For such cases, the required toxic loading of the bait material is commonly estimated as about six times the average lethal dose, contained in the average amount of bait consumed in a feeding ses-sion (Bentley, 1958, p.18). The key qualities of the bait are palatability and acceptance by all indivi-duals; lethality of each piece is not important. Avail-ability is, of course, vitally important, and is usually achieved by ensuring that baits are presented within the feeding range of each animal (Poole, 1963), or alternatively, luring them to baits (Rowley, 1960). Even so, bait may not be available to all animals if competitive interactions between individuals exclude subordinate members from bait stations, or animals are reluctant to approach new objects (neophobic response, Barnett, 1958) in their environment.
Carrick (1958, p.82) commented on experiments on the control of rabbits in Australia: "The logical method of poisoning animals which are dispersed as individuals and small groups of restricted ranging habit, . . . (and) tend to concentrate on the more suitable grazing areas, and which find each food item
by random close contact. . . is to scatter pieces of poisoned bait, each one lethal, so frequently over the entire area. . . that every rabbit will be sure to contact one".
Spreading baits abundantly over an area is recog-nised as an essential quality of competent aerial poisoning of rabbits and possums (Trichosurus vul-pecula) in New Zealand and a recognised hall-mark of competence of pilots and field staff is to place "plenty" of bait where most animals live. But the implications of Carrick's remark on the required lethality of each bait have not been recognised as an important aspect of "bait quality" or as a possible cause of failures.
The biological problem is simple. Assuming that the bait material is highly acceptable to all animals of the target population, but that the size and toxic load of pieces ranges from a fraction to more than a lethal dose, how many pieces must be encountered and eaten before a lethal dose is ingested, or the onset of poison-induced anorexia inhibits further feeding? In this context, the relative quality of baits will be inversely proportional to the necessary num-ber of encounters. This proposition is probably true for any bait distributed in any way, and particularly trUe for aerial broadcasting because each bait be-comes a "stand-alone" object of random encounter. There is always space -between baits and therefore a lapse of time between successive encounters. These
130 NEW ZEALAND JOURNAL OF ECOLOGY, VOL. 5, 1982 time lapses, and the associated chances of survival,
must increase quite rapidly as a group of animals begins to feed on bait, particularly if more glutton-ous individuals remove a large portion of the bait before others begin to feed.
Accordingly, if we assume that pieces will be con-sumed as they are encountered, regardless of size, then an index of quality will be related to the typical toxic loading of baits of different sizes, and the pro-portions of those present. This paper reports develop-ment of a generalised probability method for calcu-lating an index from such information, and is based on the probable number of baits which an animal must find and consume to ingest a lethal dose. Its application to 1O80-poisoned carrot and cereal bait aerial control programmes is discussed.
METHODS Size class (weight) distribution of samples
Preliminary work on this topic showed that particle weights ranged from less than 0.1 g to about 30 g, and distributions of carrot baits in particular, were invariably positively skewed. Weights were therefore reduced to nine convenient classes by log2 sorting from a base of 0.25 g, viz. <0.25 g, 0.25-0.5 g, 0.5-1 g, 0.5-1-2 g, 2-4 g, 4-8 g, 8-0.5-16 g, 0.5-16-32 g and >32 g. The first samples collected for the study (at Kainga-roa State Forest, 1977) were weighed on a Metter top-loading balance. This proved to be very laborious. Subsequently, samples of about 0.5 kg of bait were weighed on a Sartorious electronic top loader which was interfaced with a Hewlett Packard 97S calcu-lator. The calculator was programmed to list and sort weights, and produce a printed summary of numbers, weights and associated percentages in each class, and of the mean weight per bait and standard deviation of the sample.
1080 load in baits
The toxicity of bait was estimated by homogenis-ing samples and estimathomogenis-ing the fluoride concentration by an alkali fusion-specific ion electrode procedure (Batcheler, in prep.). Since the concentration of poison in sprayed baits was expected to be inversely proportional to the cube root of weight of pieces (Rowley, 1959), sub-samples of carrot and surface-sprayed cereal pellet baits were sorted into the log2 classes, and the 1080 concentration was determined for each.
Data from all samples were then pooled to deter-mine the average regression between weight and con-centrations by linear and quadratic least squares regressions of concentration on the cube root of weight.
99BQI
A Computer programme was written in which 100 hypothetical animals of specified tolerance to 1080 encounter baits of given weight class mean in direct proportion to their abundance (p1 . . . pn), and there-by consume quantities of poison as calculated in the previous section (q1 . . . qn). Those which consumed a lethal dose at the first encounter were subtracted from the initial 100, and for those which consumed less than the lethal dose, the matching probabilities + (q1 . . . qx). As each new p and q were calculated, already ingested (say ql . . . qx) were stored in one dimensional arrays. Then, for each successive en-counter, complete matrices were calculated of the multiplicative probabilities of encountering any com-bination of (p1 . . . pn). (p1 . . px) and of the associated possible totals of 1080 ingested (q1. . . qn) + (q1 . . . qx). As each new p and q were calculated, q was checked against the lethal dose, and the pro-portion of animals surviving the encounter was cal-culated from the (sum of all probabilities of sub-lethal encounters) / (sum of all the probabilities). Then, new (PI, . . Px) and (qi . . . qx) arrays were established, and the cycle was repeated until less than one animal survived. These computations required up to 200K words of array store space when dealing with baits of low toxicity or predominantly small pieces. Computations were terminated if the (p1 . . px) list exceeded 50K words (which seldom occur-red), and the index was obtained by extrapolation. The index derived is described in this paper as the 99 % bait quality index (99BQI).
Indices were calculated for 1.5 kg rabbits which would succumb to 0.6 mg 1080 (LD50 Rammell and Fleming, 1978) or 1.05 mg 1080 (approx. LDl00) and for 3 kg possums which would succumb to 4.5 mg 1080 (approx. LD50, J. A. Peters, pers. comm.) or 7.5 mg (approx. LD95, J. A. Peters, pers. comm.). Those which succumb to LD50 are termed "median" ani-mals, and those which can tolerate a limit or near-limit dose (LD95-LD100) are termed "tolerant".
BAITS AND MACHINES CONSIDERED
Most of the information presented deals with samples of carrot baits, of which all except two were collected in the course of monitoring cutters during poison operations against rabbits and possums.
FIGURE 1. A Gibson carrot cutter. Carrots are dump-ed into the basket on the right of the photo. cut and poisoned in the middle chamber, and expelled through the screw conveyor on the left. The Urquhart proto-type is in the background.
FIGURE 2. A standard Reliance cutter (on the left) and rotary screen. Carrots are fed in through a stor-age hopper. cut, then raised through an output auger and fed into the rotary screen. The chaff is separated and discharged (rear left) and the accepted bait is poisoned at the base of the output auger (rear right). Alexandra. September 1981.
pass through a grating of parallel bars. Reliance cutters (Fig. 2) were developed by NZ Forest Service during the late 1960s, to produce more uniform baits. The cutting principle is based on the action of two horizontally rotating knives which shear 22 mm thick slices off the carrots, and force them downwards through a square grid of stationary knives which are set at right angles. The standard nominal bait is 22mm ,3 and 11.2 g weight. The grid knives in one
FIGURE 3. A modified Reliance cutter. Carrots are fed into the input auger from a bin, and a conveyor which extracts stones and some of the soil. Cutting, screening and poisoning occurs in the one mechan-ism in the middle of the machine. Chaff (non-toxic) is carried away by the auger on the left, and accept-ed bait is dischargaccept-ed into a bin or aircraft loader through the auger at the rear of the photo. Alexan-dra. September 1981.
machine (see Kaingaroa Results) were set at 28 mm centres, giving a nominal weight of 18.1 g. After 1976, when it was shown that considerable numbers of birds were poisoned during possum poisoning operations, rotary drum screens were developed and operated in conjunction with Reliance cutters to re-move the "chall" through 16 mm diameter holes in the drum wall. Then, from 1979, further development work was undertaken. One machine (Fig. 3) has been modified so that the carrots are driven against sta-tionary knives by rotating impellers, and the resul-tant slices are forced through a rotating square-celled grid which is mounted beneath a scrolled plate. The nominal bait dimensions are 22 x 22 x 16 mm, and 8.1 g weight. The rotary drum screen has also been replaced by a simpler mechanism which ejects the cut material by centrifugal force at 9 M / sec from a chamber beneath the cutting mechanism, and sepa-rates the chall over a screen of parallel 2.6 mm wires at 13 mm centres. In Table 2, the rotary and centrifugal screens are designated by "RS" and "CS" respectively.
NEW ZEALAND JOURNAL OF ECOLOGY, VOL. 5, 1982
less than about 0.1 g and to sort them from frag-ments of woody crop weeds, leaves and other rub-bish in the bait material. Accordingly, later work was restricted to weighing particles of 0.1 g or more.
Weight distributions of pieces exceeding 0.1 g have been sampled from four cutters (Fig. 5). On average, 80% of the pieces were less than 2 g, and 92 % were less than 4 g. Of the four cutters, the Bentall, which has the lowest cutting rate, produced a significantly smaller proportion of pieces less than 0.25 g (P <0.01, 2 x 2 Chi-square tests of all possible pairs). Of the other three, which produce 6-8 tonnes per hour, weight distributions were very similar, and the only obvious distinction was the small mode of 2-4 g pieces produced by the Urquhart. There is no sem-blance of weight modes among the material pro-duced by the Reliance or Gibson cutters. The engine-ering implications of these observations are beyond the scope of this paper, but it is important to notice in our present context that they all produced very large numbers of very small fragments, and very few near the 5 g weight optimum of rabbit baits advo-cated for Australian condition (Rowley, 1959), the 2-5 g range suggested for New Zealand (J. Bell, pers.
FIGURE 4. Weight-frequency distributions of all countable fragments of carrot baits cut by two Reliance machines.
through a rotating row of knives arranged to com-plete formation of slab-shaped baits.
Results from analyses of two samples of toxic pollard-based cereal baits which were manufactured by NZ Fruitgrowers Ltd are also given. The poison was sprayed onto the surface of the baits after they had been formed by an extrusion process.
RESULTS Bait weights
The weight distribution of all countable fragments of carrot produced by high speed machines is typi-fied by measurements from Reliance cutters at Kai-ngaroa State Forest in 1977 and Taipo, Westland, in 1979 (Fig. 4). At Kaingaroa, the average weight of 4605 baits was 0.31 g; 87 % were less than 0.25 g, and only 2.8 % exceeded 2 g. At Taipo, using a modified Reliance, the average weight of 2031 baits was 0.74 g. Particles less than 0.25 g comprised 62%, and those exceeding 2 g comprised 8%.
It was often difficult to find and weigh particles FIGURE 5.exceeding 0.1 g cut by four machines.Weight-frequency distributions of all baits
comm.), or the 4-8 g range suggested for possums (J. A. Peters, pers. comm.).
The effect of using mechanical screens to remove chaff from carrot bait is shown for three versions of the Reliance cutter in Fig. 6. All machines produced approximately log-normal weight distributions, with a distinctive tail of very small pieces which apparent-ly adhere to large pieces throughout the screening process. Averages from the three were 2.97 g from the modified 22 x 22 x 16 mm grid, 3.41 g from a standard 22 mm3 grid, and 3.64 g from a modified
22 mm3 grid. Proportions exceeding 2 g ranged from
46% to 62%, and those exceeding 4 g ranged from 22 % to 36 %. Clearly, removal of chaff by mechani-cal screens increased the average weight and the pro-portion of potentially lethal baits by about seven times, but it is clear that the averages are still less than half of what might be expected from measure-ments of the cutting grids.
FIGURE 6. Weight-frequency distributions of all baits exceeding 0.1 g cut by three versions of Reliance machines, and screened through a16 mmsieve drum.
FIGURE 7. Concentration of 1080 (mg/g) against the log10 of bait weight. The higher concentration in
small pieces is evident. Inflexion at about 4 g is pro-bably due to the presence of a large proportion of intact epidermis on pieces which are less than the size of the cutting grid.
* The cause of inflexion of the curves is not well under-stood. From examining samples of bait, I believe it arises because many baits of intermediate size are sub-stantially covered by intact epidermis which is rather impervious to 1080 (Staples, 1969), but I have not at-tempted to quantify the point.
Regressions of toxicity on carrot bait weight
Eleven samples of toxic bait were taken at 30 min. intervals during preparation of 35 tonnes of carrot bait which was used for TB-possum control in West-land in 1979. The samples were sorted into weight classes and stored within about 30 min. of cutting. Matched sub-samples of unsorted bait were also collected. Estimates of 1080 concentrations in the unsorted samples ranged from 1.3 mg / g to 3.6 mg / g during the sampling period, in which the target load was 1.8 mg / g.
134 NEW ZEALAND JOURNAL OF ECOLOGY, VOL. 5, 1982
TABLE 1.99BQI's of unscreened carrot baits produced by four kinds of carrot cutters. The baits were cut for a trial(1)or during routine operations (0) when pre-feeding to enhance the acceptance of toxic bait. Toxicities of 0.2 and 0.8 mg / g, as approved by NZ Agricultural Chemicals Board. were assumed for computation. The effect of doubling those concentrations were also computed for bait cut by Gibson and Urquhart cutters.
curves were less than from linear curves in all cases, and significantly so (at P = 0.95) for six of the 11. Therefore, a general description of the relationship for all baits was obtained by scaling the results for each size class to a standard value of 1 mg / g and calculating linear and quadratic regressions for all samples combined. The quadratic regression c = 4.932 -4.334 x + 1.162 x2 (c = mg/g 1080, x = cube root
of weight in g) fitted the data significantly better (P = 11.9, n = 77). The average 1080 load (l) in any bait of weight (w) in a sample of concentration m was therefore estimated asl =c.w.m.
Regression for sprayed cereal baits
Two 200 g samples of cereal pellet baits to which 1080 had been applied by a spray process to give nominal concentrations of 0.4 mg / g and 0.8 mg / g were submitted to the Laboratory by NZ Fruitgrow-ers' Chemical Co Ltd for assessment of the accuracy of loading, the depth of penetration of 1080 and
moisture content. The baits averaged 14 mm dia., weights ranged between 0.33 g and 2.21 g and aver-aged 1.18 g and 1.12 g, and the average assayed toxicities were 0.403±0.065 mg/g (P = 0.95, n = 5) and 0.693 ± 0.180 mg/g (n = 5). Discs about 4-5 mm thick were cut from the middle of a sub-sample of the 0.4 mg/ g baits and material from the core (5 mm dia.), middle (5-10 mm annulus) and outer zones was separated with the aid of 5 mm and 10 mm cork borers. Duplicate assays of these sub-samples indicated that 94-96 % of the total 1080 was retained in the outer 2 mm surface layer, 3 % to 5 % was in the middle zone, and only 0.4 % to 0.6 % reached the core. Since this suggested that average toxicities per g
would be inversely proportional to weight, sub-samples of 0.5-1 g, 1-1.5 g and 1.5-2 g pellets were drawn from the 0.4 mg / g stock and analysed. The derived regression is c = 1.267 0.801 x (r =
0.998), where c is 1080 concentration per g and x is the cube root of bait weight in g.
99BQI's
Tables 1-3 summarise 99BQI's accumulated from 15 sets of data, 105 samples, and weights of 13,406 particles of bait. They indicate, within the limitations of current experience, the relative qualities of un-screened carrot baits (Table 1), machine- and hand-screened carrot bait (Table 2), and the samples of rabbit pellet baits (Table 3). With regard to rabbits, a toxic loading of 0.2 mg/kg, the toxicity permitted by the NZ Agricultural Chemicals Board (NZACB), is assumed for bait samples which were actually non-toxic. Actual loadings as assessed by 1080 assays (Batcheler, unpubl. records) are used for two sets of data. Likewise, for possums, 0.8 mg/ g-the NZACB loading for possum control in farm areis as-sumed for unscreened carrots. However, for screened carrots and pellets, a standard concentration of 1.5 mg/ g is assumed in accordance with an unpublished recommendation by J. A. Peters (pers. comm.) on the basis of current research on the acute toxicity of 1080 to possums. Assayed loadings were used for analyses relating to the TB-possum control operation in Westland, and 2.5 mg / g was assumed for some computations relating to the pellet baits.
Unscreened carrot baits
The 99BQI's given in Table 1 were derived by
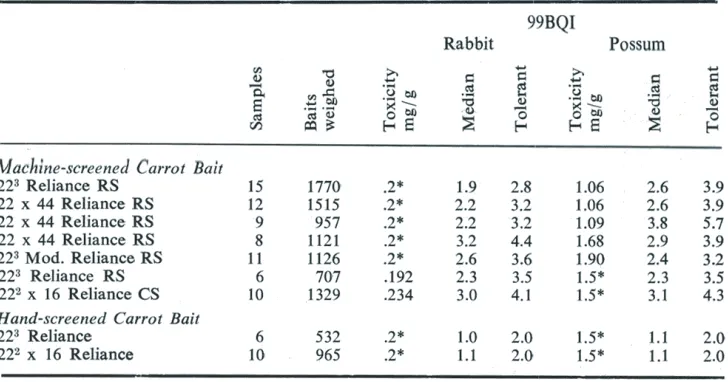
TABLE 2.99BQI's for machine and hand-screened baits cut in a possum control operation at Taipo, Westland (lines1-5)and a rabbit control operation at Alexandra. Assumed toxicities are indicated by asterisks, otherwise the toxicities given were assessed by 1080 assays. "RS" denotes a rotary screen of the type shown in Fig.2,and "CS" denotes the centrifugal screen incorp-orated in the machine shown in Fig.3.Grid sizes are in mm.
assuming the various toxic loads and target animals as indicated previously. At 0.2 mg/g, the indices for median rabbits averaged 4.9 encounters and ranged between 4.2 and 5.4. For tolerant rabbits, the esti-mates ranged between 6.2 and 8.5 encounters (av. 7.4). Estimates for median possums ranged from 6.5 to 8.2 encounters (av. 7.5), and those for tolerant animals ranged between 10.1 and 15.6 encounters (av. 13.6).
Machine-screened carrot baits
The effect of screening bait produced by three versions of the Reliance in the TB-possum control operation are given in the first five lines of Table 2. Assuming 0.2 mg/g for rabbits, the 99BQI's ranged between 1.9 and 3.2 encounters (av. 2.4) for median animals, and 3.2 to 4.4 for tolerant animals (av. 3.4) Overall, these indices indicate that a lethal quantity of 1080 will be encountered by rabbits at half the number of encounters which are necessary with un-screened bait. This, as shown by computations for unscreened bait produced by the Gibson and Urqu-hart cutters at 0.4 mg/g, indicated that machine-screening produced an equivalent effect on bait quality, as does doubling the toxicity of the bait.
The toxicity of the bait cut in Westland was in-creased during the operation, as shown in Table 2, because of concern at low estimates being returned by toxicological laboratories (Batcheler, unpubl. re-cords) and the implications of the research already noted on re-evaluation of the acute toxicity of 1080
to possums. Furthermore, the cutting grid was modi-fied during the operation (by removing each second knife from the grid) because it was found that about 40% of the carrots were being rejected as chaff. The 99BQI's roughly reflect the changes of toxicity. They ranged from 2.4 encounters for median possums (average 2.9) and 3.2 to 5.7 to tolerant possums (av. 4.1). But there was no evidence that modifying the grid improved the quality of the bait, even though the average toxicity was increased from about 1.06
mg/g to 1.68 mg/g. However, doubling the size of the grid approximately halved the proportion of car-rots rejected as chaff. Increasing the toxic loading to 1.9 mg/g, and changing to a modified grid and cut-ting mechanism, improved the 99BQI to 2.4 baits for median possums, and 3.2 for tolerant possums.
136 NEW ZEALAND JOURNAL OF ECOLOGY, VOL. 5, 1982
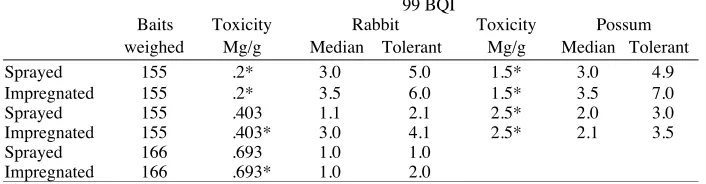
TABLE 3. 99BQI's for two samples of cereal pellet baits. 1080 was sprayed onto the baits after manufacture. Indices were calculated assuming 0.2 mg/ g, and the two concentrations deter-mined by 1080 assays. Indices were also calculated for the same toxicities on the assumption that 1080 had been uniformly mixed into the pellet dough. The comparisons show that surface spraying of variable size baits is more effective.
99 BQI
Baits Toxicity Rabbit Toxicity Possum
weighed Mg/g Median Tolerant Mg/g Median Tolerant
Sprayed 155 .2* 3.0 5.0 1.5* 3.0 4.9
Impregnated 155 .2* 3.5 6.0 1.5* 3.5 7.0
Sprayed 155 .403 1.1 2.1 2.5* 2.0 3.0
Impregnated 155 .403* 3.0 4.1 2.5* 2.1 3.5
Sprayed 166 .693 1.0 1.0
Impregnated 166 .693* 1.0 2.0
the toxic loadings currently allowed, median rabbits and possums must, on average, encounter two-three baits, whereas tolerant individuals must take three to six.
Hand-sieved carrot baits
The third set of results in Table 2 concern the effect of removing more chaff from the bait cut at Alexandra by hand-sieving machine-screened bait through a 16 mm circular hole sieve. At the nominal loadings of 0.2 and 1.5 mg/g, one encounter is lethal for median rabbits and possums, and two are lethal for virtually all individuals. Thus meticulous screen-ing (givscreen-ing a minimum bait weight of about 2 g), which reduces the necessary number of encounters by an additional 50-70% compared with machine-screened bait, is obtained at the expense of dumping a further 8-10% (Batcheler, unpubl. records) of the weight of machine-screened baits.
Cereal pellet baits
Indices were calculated for the effectiveness of the cereal bait against rabbits on the assumptions that they bad been loaded by surface-spraying at 0.2 mgj g, or at assayed concentrations. For possums, loads of 1.5 mg and 2.5 mg/g were assumed. Then, to evaluate the theoretical effect of spraying com-pared with mixing 1080 solution into the dough before the pellets are formed, indices were calculated for the same loadings on the assumption that the concentration of 1080 was uniform in all pellets. The results are summarised in Table 3.
The indices consistently show that sprayed pellets are more lethal than those to which 1080 is added into the dough. Assuming 0.2 mg/g, 99BQI's for median rabbits are 3.0 for sprayed pellets, and 3.5 for impregnated pellets. At 0.403 mg/g, the indices are 1.1 and 3.0 respectively. At 0.693 mg/g, median
rabbits require one encounter with either form of the bait, whereas tolerant rabbits require 2.0 encoun-ters with impregnated pellets.
The calculated indices given for possums clearly show that these pellets would be relatively ineffective (median 3.0-3.5, tolerant 4.9-7.0) at the maximum permitted loading. Even exceeding the maximum by a further 67 % yielded indices of 2.0-3.5 baits. Clearly, such baits are too small to be considered for use against possums.
DISCUSSION
The work reported in this paper began more by accident than design in that development of screens was undertaken to minimise losses of birds through accidental poisoning, not to improve the efficiency of poisoning possums. Harrison (1978) had shown from trials at Kaingaroa State Forest that the mortality rate was halved when bait was sieved over a 13 mm screen. Casualties among ground-feeding species were not surprising because most bait came to rest there, but the death of canopy dwellers was not widely expected. A clue to the cause of these deaths came from placing five 3.6 x 3.6 m mats beneath a dense Pinus nigra stand and counting and weighing all the baits which fell on them during the day they were sown, and on each of the two days following (Batche-ler, unpubl. records). The successive counts were 274, 41 and 99. Those which were suspended in the trees for at least a day were all less than 4 g. Since about 60,000 particles of bait/ha were sown in the operation, it was evident that something in the order of two small pieces/m2 of highly toxic bait were placed in the feeding range of canopy dwellers such as the grey warbler (Gerygone igata) and whitehead (Mohoua albicilla).
adding to the risks to birds, but this is not borne out by this study. The regression of toxicity on weight derived from sampling baits of different sizes indi-cates that 0.1 g pieces of rabbit and possum bait (0.2 mg / g and 0.8 mg / g respectively) contain about one and four times the LD5 0 for a 20 g chaffinch (Fringilla coelebs). Thus, virtually all fragments of bait are likely to be lethal to small birds, at any loading which is likely to be effective against the pest mammals. Reducing the toxic loading of bait is, therefore, not a practicable approach to minimising the risk. Fortunately however, screening and pro-hibiting the use of some "lures", appears to have generally resolved that problem. But it was also obvious by then that many questions about the effec-tiveness of baits against the target animals had neither been asked nor answered.
The BQI's given in Tables 1-3 indicate that a very important gain of quality is obtained by screening and / or increasing the toxic loading. Comparing un-screened, machine-screened and hand-screened bait poisoned at 0.2 mg/g, the number of encounters required of a median rabbit declines from about five to one, and the reduction for tolerant individuals is from about seven to two. Equivalent computations for possums associated with screening and increasing the toxic load from 0.8 mg / g to 1.5 mg / g result in decline from 7-12 to 1-2 encounters. These improve-ments are obtained at a cost of screening and dump-ing 25-40% of the carrots cut (unpubl. data).
The results offer an insight into at least part of the reason(s) why accepting poisoning practice has pro-ceeded by trial and error over the years to the appli-cation of extremely large amounts of bait. It is not uncommon in possum control, for example, for toxic carrot bait to be sown at over 30 kg/ha–at which the weight of bait can exceed the weight of possums present. As Peters (1975) points out, such aerial poisoning is inherently about 1 % efficient. The BQI's for unscreened bait suggest that such quantities are necessary at least partly because, on average, the intended victim must find and eat 5-15 bait particles before a certain lethal dose is consumed, and before the anorexia of poisoning suppresses further feeding.
This aspect of the problem is exacerbated by the patchy distribution of rabbits and possums. Field operators invariably attempt to apply greater quan-tities of bait in areas in which they observe the highest densities of animals. Despite this, it is not unusual for all the bait in "traditional" feeding areas to dis-appear, be virtually untouched elsewhere, and yet for there to be many survivors. In such cases, the scarcity of bait available to animals which are
initi-ally slow to accept it must seriously reduce the like-lihood of their consuming a lethal dose.
There thus appear to be very reasonable grounds for recommending that, if each bait can be made lethal, the amounts used could be considerably re-duced. Theoretically, we probably never need more than 50-100 baits/ha to kill every member of the most numerous rabbit or possum population because, if only one encounter is necessary, it is irrelevant whether an animal takes two minutes or two days to find one. Such arithmetic leads towards a require-ment of less than 300 g of carrot baits/ha, assuming they can be well distributed. Even allowing a l0x "margin of certainty" results in one-tenth of the quantities which are currently used.
"Fine-tuning" of bait sowing rates is thus inter-woven with lethality of the baits, and this appears to pose an intricate problem, at least for possum control. Morgan (1982) has shown that some possums detect and reject carrot bait loaded at 0.2 % 1080, at which 7.8 mg is contained in a 4 g bait.
Therefore, assuming an LD9 5 - l 0 0 of 2.5 mg/kg-equivalent to 7.5 mg for a 3 kg possum, there seems to be a high risk of aversion to bait at the toxicity required to kill most members of a" population. It therefore seems necessary, as Morgan suggests, to mask the scent and taste of 1080 to possums. Mask-ing the taste and odour of poisons may indeed be the principal function of the 20 or more food es-sences and scents which have been used for many years in possum control. The contemporary field view is that they are "lures".
The analyses of cereal rabbit baits make several interesting points. At 0.2 mg/ g loading, the quality of impregnated and surface-sprayed pellets is similar to screened carrots–3-6 encounters by rabbits are necessary. At 0.4 and 0.7 mg/g however, spraying the poison onto the surface-which could be done at an airstrip-further reduces the likelihood of sub-lethal encounters by one-half to two-thirds in three of the four computations. Such advantages are worth pursuing, because besides the. apparent efficacy of the sprayed pellets, a considerable component of the cost of factory-made pellets is associated with the labour and equipment required to uniformly mix 1080 into the pellet dough, and" the security and packaging required for shifting' toxic pellets on the public transport system.
138 NEW ZEALAND JOURNAL OF ECOLOGY, VOL. 5, 1982 "failures" (which for rabbits can be loosely defined
as where further control work is required within three years) occur, apparently with increasing fre-quency, particularly in Central Otago. These com-monly appear to be associated with the use of 1080-impregnated oats (which on average contain about 1/30th LD50), or complete avoidance of carrot baits by many individuals (J. Bell, pers. comm.). Similarly, Oliver, Wheeler and Gooding (in press) in West Australia, have suggested that the effectiveness of "one-shot" oat baiting with 1080 (in which about 1 % of grains each contain a lethal dose), has declined over the interval 1955-62 to 1971-75. They suggest that selection for neophobic avoidance of baits which are repeatedly used may account for this decline.
Thus there is evidence from several sources that repeated poisoning-which axiomatically indicates some degree of failure-may lead to a reduction of effectiveness through the selection of behavioural traits analogous to the selection of highly tolerant rats following repeated use of anticoagulants. Exist-ing information cannot decide the matter. Neverthe-less, it seems reasonable to argue that any factor which enhances the chances of survival of pest ani-mals is likely to compound the difficulties of main-taining control over a long period.
I am not aware of any other published work which attempts to quantify the concept of bait qual-ity in terms of a single-statistic estimate of the rela-tive probabilities of killing a target animal. My referee aptly described the technique presented as "a cumbersome method of stating the obvious: increas-ing the size of baits. . . must result in a reduction of the number of baits which need to be eaten before a selected level of toxin is achieved". I agree, and stress only that the index gives some insight as to the dimension of the word "reduction". He furth-er commented that the method seems "unnecessarily cumbersome. . ." and that instead, "a random num-ber generating function could have been used to repeatedly select a bait of weight class mean in pro-portion to abundance with its toxic load accumulat-ing until the preset limit was exceeded. . . ." A random number generator could have been used if the weight of each bait had been entered into the computer as data, because each could then have been selected with equal probability. But nearly all the data had been summarised into classes as baits were weighed. Therefore, the probabilities of encounter were declared by class frequency and therefore, use of a random number generator was not appropriate. Further, in this study, I considered that the advan-tages of entering only 16 numbers for a sample in
stead of hundreds of individual weights would out-weigh the costs in computer time, which averaged about 15 sec per sample on a Burroughs B6700.
BQI's, as used here, cannot be presumed to be a linear measure of quality. It is possible that rabbits or possums will not attempt to find or eat very small baits (Rowley, 1959), in which case these could be ignored in computations. Finally-and probably of much more importance-social disturbances, compe-tition for baits, and the gradual onset of illness dur-ing feeddur-ing bouts, probably tend to slow down an animal's rate of searching from one bait to the next. If so, a linear measure of bait quality would be a power function of the BQI. If, for example, BQI I is accepted as unit quality ("perfect bait"), and the likelihood of an animal proceeding from one bait to the next diminishes by 20 % after each encounter, the relative chances of not poisoning animals with BQI
10 bait would be 19.7 times as great. The high num-bers of encounters calculated for unscreened carrot bait suggest that if badly prepared bait continues to be used against pests, poisoning problems will be-come more common with the passage of time. Such a risk, along with the large amounts of unscreened bait which are required, and Harrison's (1978) obser-vations on mortality of birds, suggests that there is a comprehensive case for meticulous preparation of baits intended for use in aerial poisoning.
ACKNOWLEDGEMENTS
I gratefully acknowledge the help of Dorothy McEwan who weighed most of the baits, ran the computer pro-grammes and determined 1080 concentrations in the samples, and J. Bell, W. D. Ross and the Editor's referee, for their critical comments on the manuscript.
REFERENCES
BARNETT, S. A. 1958. Experiments on 'Neophobic' re-sponse in wild and laboratory rats. British Journal of Psychology 49: 195-201.
BENTLEY, E. W. 1958. Biological methods for the evalua-tion of rodenticides. Ministry of Agriculture, Fisher-ies and Food, London. Technical Bulletin No.8. 35 pp.
CARRICK, R. 1958. What is the best free-feeding system for furrow-poisoning the rabbits? CSIRO Wildlife Research 1: 78-84.
HARRISON, M. 1978. 1080. Wildlife - a review. 9: 48-53. MORGAN. D. R. 1982. Field acceptance of non-toxic and
toxic baits by brushtail possum (Trichosurus vul-pecula Kerr) populations. New Zealand Journal of Ecology 5: 36-43.
poison baiting for the control of the rabbit (Ory-ctolagus cuniculus).
PETERS, J. A. 1975. Contamination of forest ecosystems by sodium fluoroacetate (Compound 1080). Proceed-ings of the New Zealand Ecological Society 22: 33-41.
POOLE, W. E. 1963. Field enclosure experiments on the technique of poisoning the rabbit, Oryctolagus cuni-culus (L). III. A study of territorial behaviour and furrow poisoning. CSIRO Wildlife Research 8: 36-51.
RAMMELL, C. G.; FLEMING, P. A. 1978. Compound 1080: Properties and use of sodium monofluoroacetate in New Zealand. NZ Ministry of Agriculture and Fish-eries. 112 pp.
ROWLEY, I. 1959. Bait size for rabbits. CSIRO Wildlife Research 4: 27-30.
ROWLEY, I. 1960. The sense of smell and food finding in the rabbit. A study of lures for rabbit poisoning CSIRO Wildlife Research 5: 116-25.