Available online on 15.07.2019 at http://jddtonline.info
Journal of Drug Delivery and Therapeutics
Open Access to Pharmaceutical and Medical Research
© 2011-18, publisher and licensee JDDT, This is an Open Access article which permits unrestricted non-commercial use, provided the original work is properly cited
Open Access
Research Article
Development and Validation of Stability Indicating RP-HPLC Method for
Estimation of Alogliptin and Metformin HCl Drug from Bulk and
Pharmaceutical Dosage Form
Atul R. Andhale*, R.K. Godage
1, A.S. Dighe
2Department of Pharmaceutical Chemistry. Pravara Rural Collage of Pharmacy, Pravaranagar, Tal. Rahata, Dist. A. Nagar, India
ABSTRACT
The objective of the current study was to develop a simple, accurate, precise and rapid RP-HPLC method with subsequently validate as per ICH guidelines for the determination of Alogliptin benzoate and Metformin hydrochloride using mobile phase [mixture of Phosphate buffer- pH-3.6 and acetonitrile in the ratio of 65:35] as the solvent. The proposed method involves the measurement of Retention time at selected analytical wavelength. 235.0 nm was selected as the analytical wavelength. The retention time of ALO and MET was found to be 5.055 and 2.838 respectively. The linearity of the proposed method was investigated in the range of 1-5 μg/ml (r = 0.9998) for ALO and 10-50μg/ml (r = 0.9999) for MET respectively. The method was statistically validated for its linearity, accuracy and precision. Both inter-day and intra-day variation was found to be showing less % RSD (Relative Standard Deviation) value indicating high grade of precision of the method.
Keywords: RP-HPLC METHOD, Alogliptin benzoate, Metformin hydrocholiride, Validation.
Article Info:Received 21 May 2019; Review Completed 28 June 2019; Accepted 07 July 2019; Available online 15 July 2019 Cite this article as:
Andhale AR, Godage RK, Dighe AS, Development and Validation of Stability Indicating RP-HPLC Method for Estimation of Alogliptin and Metformin HCl Drug from Bulk and Pharmaceutical Dosage Form, Journal of Drug Delivery and
Therapeutics. 2019; 9(4):504-509 http://dx.doi.org/10.22270/jddt.v9i4.3093
*Address for Correspondence:
Atul R. Andhale, Department of Pharmaceutical Chemistry. Pravara Rural Collage of Pharmacy, Pravaranagar, Tal. Rahata, Dist. A. Nagar, India
INTRODUCTION:
GLP-1 and glucose-dependent insulinotropic polypeptide (also known as gastric inhibitory peptide) belong to the incretin class of gastrointestinal hormones. Incretins stimulate a decrease in blood glucose levels by causing increased postprandial insulin release from the beta cells of the pancreas1. GLP-1 also suppresses glucagon secretion and
exhibits other glucoregulatory actions after secretion in the gut.11 DPP-4 is an enzyme that rapidly degrades, and thereby
inactivates, both GLP-1 and gastric inhibitory peptide. DPP-4 inhibitors prolong the endogenous plasma levels and hence the activity of both of these key hormones.[2] Alogliptin, a
potent and highly selective DPP-4 inhibitor, is the fourth DPP-4 inhibitor to be introduced in Canada, following the approval of sitagliptin, saxagliptin, and Alogliptin.
Fig 1: Structure of Alogliptin
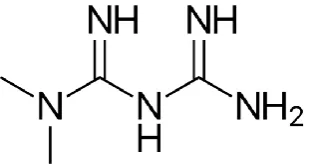
Metformin is a biguanide oral hypoglycemic primarily for treating type 2 diabetes mellitus (T2D). Evidence suggests that, in addition to improving glycemic control, metformin is associated with improved all-cause and cardiovascular mortality1 and decreased risk of some cancers (eg, breast
cancer).2 Despite the potential benefits, since metformin was
introduced in the United States in the mid-1990s, clinicians have been advised to exercise caution in prescribing the drug to individuals with certain comorbidities due to perceived risks of serious side effects, including LA. Lactic acidosis (LA) is defined as blood lactate concentration >45mg/dl (5.0mEq/L), decreased blood pH, and electrolyte disturbances with an increased anion gap
MATERIALS AND METHODS:
Analytically pure sample of Alogliptin and Metformin with purities greater than 99% were obtained as gift samples. The tabulated information regarding the procurement of various
samples are given below in table 1 and table 2 contains all the instrument list used for this work.
Table.No.1 List of chemicals and standards used
Sr.no Chemical Manufacture name grade
1 Water Merck HPLC grade
2 Acetonitrile Merck HPLC grade
3 Methanol Merck HPLC grade
4 Ortho phosphoric acid Merck G.R
5 Triethyl amine Merck G.R
6 0. 22μ Nylon filter Advanced lab HPLC grade
7 0.45μ filter paper Millipore HPLC grade
8 Alogliptin And Metformin Gift samples from Ajanta Pharma
(aurangabad, India) HPLC grade
Table.No.2. List of instruments used.
Weighing Balance PGB 100
Ultra Sonicator WUC-4L
UV-Spectrophotometer And Software UV2450 UV Probe v 2:3:3
HPLC HPLC 3000 Series P-3000-M Reciprocating (Binary pump)
UV-3000-M (UV-Visible Detecter)
Selection of wavelength:
10 mg of Alogliptin and Metformin was dissolved in mobile phase. The solution was scanned from 200-400 nm the
spectrum was obtained. The overlay spectrum of alogliptin and Metformin was obtained and the isobestic point of Alogliptin And Metformin showed absorbance’s maxima at 254 nm. The spectrums are shown in Fig. 3
Fig.3. Spectrum showing overlapping spectrum of Alogliptin and Metformin
The chromatographic method development for the simultaneous estimation of Alogliptin and Metformin were optimized by several trials for various parameters as different column, flow rate and mobile phase, finally the following chromatographic method was selected for the separation and quantification of Alogliptin and Metformin in API and pharmaceutical dosage form by RP-HPLC method. The separation of the drugs was achieved on Water X bridge C18 column (4.6×150mm) 5μ particle size). The mobile phase consists of a mixture of Methanol: Acetonitrile pH 3.0 (130: 870 % v/v) at a flow rate of 1.0 ml/minute and the volume injected was 10 μl for every injection .the detection wavelength was set at 240 nm.
Preparation of Buffer solution: (Mobile phase A). Add 0.25 g of Sodium 1-octane Sulfonate monohydrate in 1000 mL of water, mix and filterthe solution through 0.45µ Nylon membrane disc filter, to this add 2.0 mL of
Triethylaminemix and adjust the pH 3.0 ± 0.1 with Ortho-phosphoric acid Mix and degas
1. Preparation of Mobile Phase B:
Mix Acetonitrile and Methanol in the proportion of 870:130 v/v respectively and use as mobile phase B. 2. Preparation of Mobile Phase:
Prepare the mixture of Mobile phase A: Mobile Phase B in the ratio of 85:15 v/v respectively.
3. Preparation of Diluent:
4. Preparation of Standard stock solution:
Alogliptin Stock.
Weigh accurately about 25 mg of Alogliptin standard and transfer into 50 mL volumetric flask. Add about 30 mL of diluent, sonicate to dissolve and make up to volume with diluent and mix.
Metformin HCl Stock.
Weigh accurately about 50 mg of Metformin HCl standard and transfer into 100 mL volumetric flask. Add about 70 mL of diluent, sonicate to dissolve and make up to volume with diluent and mix.
5. Preparation of Standard solution:
Further transfer 10 mL Metformin HCl Stock Solution and 20 mL ofAlogliptin Stock Solution into 50 mL volumetric flask and dilute up to the mark with diluent and mix.
6. Preparation of Sample Stock solution:
Weigh and transfer 10 tablets into 1000 mL volumetric flask. Add about 700 mL of diluent, sonicate for 30 minutes
with intermittent shaking. Allow it to cool to room temperature and make up to volume with diluent and mix. Let the solution stand for 5 minutes.
Filter the sample solution through 0.45µ Nylon membrane syringe filter. Discard first 3 mL of filtrate.
RESULTS AND DISCUSSION
Method Development.
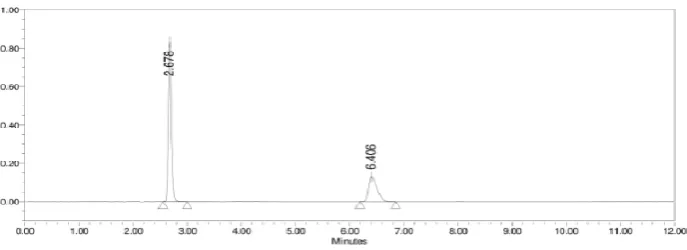
A Reverse phase HPLC method was developed keeping in mind the system suitability parameters i.e. resolution factor (Rf) between peaks, tailing factor (T), number of theoretical plates (N), runtime and the cost effectiveness. The optimized method developed resulted in the elution of Alogliptin at 6.2 min and Metformin at 2.6 min.
Figure 4 represents chromatograms of mixture of standard solutions. The total run time is 25 minutes with all system suitability parameters as ideal for the mixture of standard solutions.
Fig 4: Typical chromatogram of the mixture of the standard sample.
System‐suitability tests are an integral part of method development and are used to ensure adequate performance of the chromatographic system. Retention time (Rt), number of theoretical plates (N), peak resolution (Rs) and peak
Tailing factor (T) were evaluated for six replicate injections of the standards at working concentration. The results given in Table 3 were within acceptable limits.
Table 3: System suitability studies results.
PARAMETERS* REQUIRED LIMITS Alogliptin Metformin
Retention time (min) % RSD < 1% 6.2 2.6
Number Of Theoretical plates (N) Not less Than 2000 4423 6049
Tailing factor (T) Not More Than 2 1.3 1.2
Method validation
Validation of the analytical method is the process that establishes by laboratory studies in which the performance characteristics of the method meet the requirements for the intended analytical application. The RP-HPLC method developed was validated according to International Conference on Harmonization10 guidelines for validation of analytical procedures. The method was alidate for the parameters in terms of system suitability, selectivity,
linearity, accuracy, precision, ruggedness, robustness, limit of detection(LOD) and limit of quantitation(LOQ).
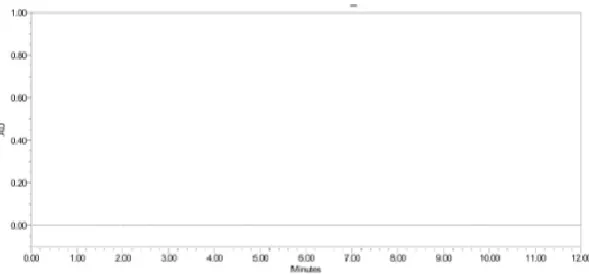
Specificity.
Fig.5.7 Chromatogram showing blank (mobile phase preparation)
Fig.6. Chromatogram showing standard injection Linearity.
The linearity study was performed for the concentration of 10 ppm to 50 ppm Alogliptin and 20 ppm to 100 ppm Metformin level. Each level was injected into
chromatographic system. The area of each level was used for calculation of correlation coefficient. The results aretabulated in Table.4-5. Calibration graph for Alogliptin and Metformin are shown in Fig.No.8 &Fig 9.
Table 4. Linearity Results for Alogliptin
Sr.No Linearity level Concentration Area
1 1 50ppm 703249
2 2 80ppm 1119712
3 3 90ppm 1263844
4 4 100ppm 1399228
5 5 150ppm 2081515
Correlation Coefficient 1.000
Table 5. Linearity Results for Metformin
Sr.no Linearity level Concentration Area
1 1 50ppm 1639365
2 2 80ppm 2610330
3 3 90ppm 2955233
4 4 100ppm 3268898
5 5 150ppm 4865242
Correlation Coefficient 1.000
The linearity study was performed for concentration range of 50μg -150μg Alogliptin and 50μg - 150 μg metformin and the correlation coefficient was found to be 1.000 and 1.000.(NLT 0.999)respectively.
Accuracy:
Table: 6. Accuracy results for Alogliptin.
%Concentration (at specification level) Average area % Recovery Mean recovery
50% 1411902 98.4
98.8
100% 1400900 98.9
150% 1404583 99.2
Table.7. Accuracy results for Metformin.
%Concentration (at specification level) Average area % Recovery Mean recovery
50% 3438212 102.2
100.5
100% 3409956 100.3
150% 3408213 100.4
The accuracy study was performed for % recovery of Alogliptin and Metformin. The % recovery was found to be 98.8 % and 100.5% respectively (NLT 98% and NMT 102%).
Precision.
1.system precision
2.Method precision
1.0 system precision.
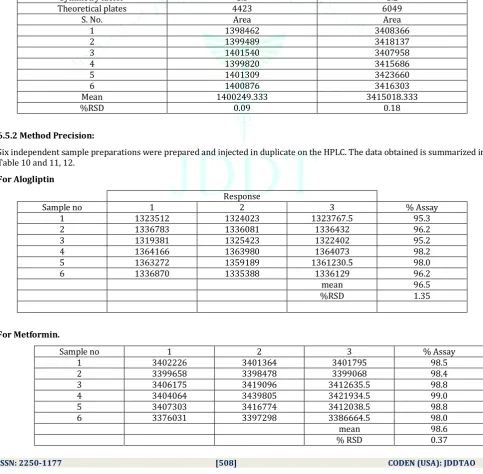
Single injection of Blank (Diluent) and six replicate injections of standard solution were injected on the system. The data obtained is summarized in Table 9.
Table `9: System precision
For Alogliptin For Metformin HCl
Symmetry factor 1.3 1.2
Theoretical plates 4423 6049
S. No. Area Area
1 1398462 3408366
2 1399489 3418137
3 1401540 3407958
4 1399820 3415686
5 1401309 3423660
6 1400876 3416303
Mean 1400249.333 3415018.333
%RSD 0.09 0.18
6.5.2 Method Precision:
Six independent sample preparations were prepared and injected in duplicate on the HPLC. The data obtained is summarized in Table 10 and 11, 12.
For Alogliptin
Response
Sample no 1 2 3 % Assay
1 1323512 1324023 1323767.5 95.3
2 1336783 1336081 1336432 96.2
3 1319381 1325423 1322402 95.2
4 1364166 1363980 1364073 98.2
5 1363272 1359189 1361230.5 98.0
6 1336870 1335388 1336129 96.2
mean 96.5
%RSD 1.35
For Metformin.
Sample no 1 2 3 % Assay
1 3402226 3401364 3401795 98.5
2 3399658 3398478 3399068 98.4
3 3406175 3419096 3412635.5 98.8
4 3404064 3439805 3421934.5 99.0
5 3407303 3416774 3412038.5 98.8
6 3376031 3397298 3386664.5 98.0
mean 98.6
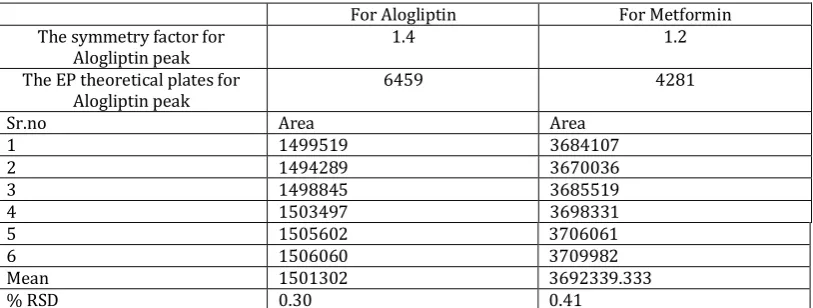
Intermediate precision/Ruggedness.
Same procedure of method precision is followed by another Analyst by using same lot of Alogliptin and Metformin HCl
Tablets on different instrument different column and on different day. The data obtained from Analyst-II are summarized in Table 13.
Table 13: System suitability
For Alogliptin For Metformin
The symmetry factor for
Alogliptin peak 1.4 1.2
The EP theoretical plates for
Alogliptin peak 6459 4281
Sr.no Area Area
1 1499519 3684107
2 1494289 3670036
3 1498845 3685519
4 1503497 3698331
5 1505602 3706061
6 1506060 3709982
Mean 1501302 3692339.333
% RSD 0.30 0.41
CONCLUSION:
The data shows that % assay difference of unfiltered standard solution and filtered standard solution with different filters is within the acceptance criteria. Hence Nylon filter, PVDF filters are suitable for standard solution. The data shows that % assay between centrifuged sample solution and filtered sample solution with 0.45µ PVDF filter, Nylon filter is within the acceptance criteria. Hence all tested filters except Teflon+Glass filter are suitable for sample solution filtration.
REFERENCES
1.Koduru S, Kalepu S, method development for the simultaneous estimation of alogliptin and metformin by using
RP-HPLC,international journal of pharma research and health science,(2015) vol.3,page no.747-753
2 Shyam sundar P, tabassum I, development and validation of stability indicating RP-HPLC method for the simultaneous estimation
of alogliptin and metformin in bulk and pharmaceutical dosage form. (2017) vol.5,page no.223-233.
3. Praveen Kumar A, Aruna G, Analytical Method Development And Validation Of Alogliptin And Metformin Hydrochloride Tablet Dosage Form By Rp-Hplc Method,(2013) Vol.3.Page No. 58-68. 4. http://www.drugbank.ca/drugs/DB0893
5. http://www.drugbank.ca/drugs/DB08864 6. .http://www.webmd.com
8. .http://www.drugsinfo.com 9. .http://www.update.com
10. neha sultana,Dr.iffath rizwana,development and validation of stability indicating RP- HPLC method for simultaneous estimation dosage form and alogliptin and metformin in bulk and tablet dosage form the pharma innonation journal(2018) vol.7.Page no.319-324 11.http://www.mediclnewstoday.com