Twenty Seven Years of Tracking Undergraduate Science Knowledge and Beliefs
Chris David Impey
University of Arizona, USA Martin Formanek
University of Arizona, USA Sanlyn Rebecca Buxner University of Arizona, USA Matthew C. Wenger
University of Arizona, USA
Abstract
The past generation has seen major advances in science and technology, and in the preparation of high school students for college. This study investigates changes in the science knowledge of college students, and in their attitudes and belief systems regarding science and technology. Over 12,600 non-science majors at the University of Arizona were surveyed using the same instrument over a period of 27 years. The knowledge-based component of the survey overlaps with questions used by the National Science Foundation over the same interval to measure science literacy in the adult U.S. population. The instrument measuring beliefs and attitudes is original to this study. The central result of this work is that student knowledge shows almost no change, in the aggregate or measured by individual items, over this span of time. This is in contrast to a significant gain in science literacy among the U.S. adults. In terms of beliefs, student susceptibility to pseudoscience ideas is relatively high and stable over time. College students have a positive attitude towards science and technology that is constant over time, except for changes on a few issues of societal importance. Responses for several items indicate the appearance of a strong gender effect in the past decade. This long-term study suggests there is still substantial work to be done in giving non-science undergraduates basic scientific knowledge and in training them how to think critically in world increasingly dominated by science and technology.
Key terms: Science Education Research; Science in Schools; Science Attitudes and Perceptions; Science Literacy; Popularization of Science; Public Understanding of Science
Please address all correspondence to: Martin Formanek, Department of Astronomy and Steward Observatory, University of Arizona, 933 North Cherry Avenue, Rm. N204, Tucson, AZ, 85719, Email: [email protected]
Electronic Journal of Science Education ejse.southwestern.edu Science literacy continues to be a critical issue for educators, scientists, and policy makers. It is generally framed as sufficient scientific knowledge, and understanding of how the process of science works, to function as an informed citizen in a technological society (Miller, 2012; Gunstone, 2015). The issue of science literacy has been discussed for almost sixty years (Hurd, 1958; McCurdy, 1958) and is consistently discussed and studied in international contexts (Holbrook & Rannikmae; Laugksch, 2000; Miller, 2004; Sadler & Zeidler, 2009). There have been periodic attempts to summarize and reframe the motivations for the general population to be knowledgeable about science (Thomas & Durant, 1987), and these debates are still active (Yore, 2012). The context for science literacy is lifelong learning, where formal exposure to science in school and college is a precursor to a long and variegated set of exposures to science in informal settings (Sacco, Falk, & Bell, 2014). There have been no longitudinal studies of science literacy and attitudes towards science among college students, which motivates this survey their preparedness to participate in informed debate about societal issues involving science and technology.
We have characterized the science knowledge as well as the attitudes and beliefs about science and technology of undergraduate non-science majors, now we want to know if there have been any changes over time. This is part of a series of papers deriving from a long-term study of the basic scientific knowledge and attitudes towards science and technology of undergraduate students at the University of Arizona. Results from the first twenty years of the survey are described in Impey, Buxner, Antonellis, Johnson and King (2011). Undergraduates entering college had marginally higher science knowledge scores than the general public, as measured by the NSF (National Science Board, 2016). Superstitions and beliefs in pseudoscience were commonplace, and such beliefs were essentially uncorrelated with science knowledge (Impey, Buxner, & Antonellis 2012). Other papers by our group have focused on responses to open-ended questions in the survey (Antonellis, Buxner, Impey, & Sugarman, 2012), levels of beliefs in astrology (Sugerman, Impey, Buxner, & Antonellis, 2011), and student sources of information about science (Buxner, Impey, & Tijerino, 2013). Recently, we have begun administering the survey in two massive open online classes (MOOCs) in astronomy that we run, in order to compare science knowledge and beliefs between free-choice adult learners and students taking science as part of their formal college instruction (Impey, Wenger, & Austin, 2015).
Literature Review
Surveys of Public Science Literacy
Ongoing studies of scientific literacy in adults have focused on determining key aspects of scientific literacy, ways to measure it, and comparisons between adults in different countries (Miller & Pardo, 2004). Additionally, relatively recent efforts to assess international students’ scientific literacy has resulting in new frameworks and assessments given to high school students in different countries every three years to be able to compare students’ scientific literacy (Bybee, McCrae,& Laurie, 2006) .
The science knowledge and attitudes of undergraduate students cannot be viewed in isolation. During their four to six years at university, non-science majors might take two or three science courses as part of a Liberal Arts “breadth” requirement, but that formal exposure to science is likely to be a small fraction of their overall exposure. For college students, science preparation takes place primarily in high school. Nationwide, there has been an increase in the fraction of high school students electing to take science classes. Losh (2006) found increases from 1990-2001 of 79% to 86% in students taking biology, 49% to 66% in students taking chemistry, and 31% to 37% in students taking physics. These data are consistent with the increasing math and science preparation as measured by the National Center for Education Statistics (2014), where more science is being taken over an interval that nearly matches this study, with the largest overall participation in biology, followed by chemistry, and then physics. This general upward trend masks substantial regional variations. Over 75% of University of Arizona students are from Arizona and California, which in the 2005 National Assessment of Educational Progress ranked 39th and 44th in the country, with only 20% of eighth grade students at or above the proficient science level (CCSSO, 2007).
For adults in the United States, the data on undergraduate students are best compared with NSF data on the general public, since the survey instrument has direct overlap with the one administered by the NSF and published in the Science and Engineering Indicators series of reports (National Science Board, 2016). The NSF has changed its methodology over the years, which raises some concerns about interpreting time evolution. Before 1982, the data were collected through in-person interviews. From 1982 to 2004, data were collected by phone interviews, using the Institute of Social Research at the University of Michigan as the contractor (Miller, 1983; Miller, 1998). In 2006, the NSF began to gather even more comprehensive data using the biennial General Social Survey, which also marked a return to face-to-face interviews. Typical sample sizes in these surveys are 1500 to 2500. On factual knowledge, as measured by a core set of nine questions, there is a slight but significant rise in the mean number of correct answers, from 5.4 in 1992 and 1995 to 5.8 in 2012 and 2014 (Figure 7-8 in the 2016 report). Adding in General Social Survey data, the factual knowledge of science is strongly correlated with people’s level of formal schooling, and with the number of math and science courses taken in college (Figure 7-9 in the 2016 report).
Electronic Journal of Science Education ejse.southwestern.edu answered 64% of the questions correctly while those older than 65 only answered 47% of the questions correctly. By 2014, the older population showed a substantial gain and this gap had shrunk from 17% to 7%. Younger generations have more formal education than older generations so it is difficult to separate cohort differences in education from aging and other factors. But public understanding of science has increased over time and by generation, after controlling for levels of formal education (Losh, 2010, 2012).
Where Adults Get Their Information about Science
Adult Americans encounter science in a variety of informal settings such as museums and science centers, TV or cable programs, and videos on the Internet. The lifetime exposure to science in free choice settings probably dominates the limited amount of time these people have spent in a science classroom (Falk & Dierking, 2010; Falk & Needham, 2013). As students eschew traditional, authoritative sources like books, the primary source of science information is rapidly shifting to the Internet. Data from the NSF’s series Science and Engineering Indicators show that as a primary source information about science and technology, use of newspapers has declined from 17% to 7% and use of television has declined from 44% to 25% between 2001 and 2014, while use of the Internet has increased from 10% to 47%. The Internet is even more dominant as the primary source of information for particular scientific issues, growing from 44% to 68%, while newspapers and television languish below 15% (National Science Board, 2016). Wikipedia dominates as an online destination (Bateman & Logan, 2010; Okoli, Mehdi, Mesgari, Nielsen, & Lanamaki, 2014), leading to an attempt to improve the content as a vehicle for science literacy (Wikipedia, 2016).
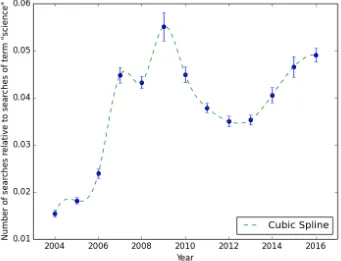
Figure 1. Google Trend data showing the searches on the term “climate change” normalized by searches on the term “science”.
There have been profound changes in science and technology over the period spanned by the survey reported in this paper. Consider students at the beginning and the end of the time period. The typical student from the 1989 cohort was born in 1971. They went to college in a low-tech world. The first portable Macintosh was introduced in 1989, but personal computers were too expensive for most students and email was just beginning to be widely used. The Internet did not exist in 1989. The typical student from the 2016 cohort was born in 1998. They’ve spent their entire lives with portable computers and the Internet, and all their teenage years with smart phones and social media. In science research, this interval spans the dramatic rise of genomics, and a rise in federal funding for biomedical and life science fields from a level slightly higher than physical sciences in 1989 to a level four times higher in 2016 (AAAS, 2016).
Research Questions
Electronic Journal of Science Education ejse.southwestern.edu information for our participants, and prior studies have found differences in science knowledge and attitudes toward science based on gender (Gokhale, Rabe-Hemp, Woeste, & Machina, 2015; Hayes & Tariq, 2000; Osborne, Simon, & Collins, 2003), so we examined our data for these same trends, and to see if there is any change over time.
We attempt to compare to our survey to national data on the general public where possible. The twin measures of science knowledge and attitudes towards science and technology are unique to this study. Our work here addresses the following specific research questions:
(1) Does the basic scientific knowledge of undergraduates show any change over 27 years? Within this broad question, we can address a number of subsidiary questions: (1a) Are there any changes over time on particular knowledge items in the survey? (1b) Is there any change after the introduction of a new General Education curriculum in 1998? (1c) Are there any gender effects over time? (1d) How does the performance of undergraduates compare over time with that of the general public as measured by the NSF?
(2) Do the attitudes and opinions of undergraduates towards science and technology change over 27 years? Within this broad question, some more limited questions are of interest: (2a) Have student susceptibilities to superstition and their beliefs in pseudoscience changed over this time interval? (2b) Has student support of science and technology changed over this time interval? (2c) Are there gender effects in attitudes and beliefs over time?
Research Settings and Methodology
Participants and Setting
The audience for the study was undergraduate students at the University of Arizona taking an introductory astronomy class as part of the science requirement for non-science majors. Our sample of college students spends about 110 hours in a classroom fulfilling their science requirement and an additional 200-300 hours doing class assignments. The University of Arizona is a Land-Grant, Research I institution located in Tucson, Arizona, with a current undergraduate population of 42,300. In terms of preparation for college, the mean combined SAT score for freshmen hasn’t changed substantially over the period covered by this study. The scores were 1096 in 1995, 1101 in 2000, 1122 in 2005, 1098 in 2010, and 1113 in 2014 (The University of Arizona Fact Book 2015). For comparison, mean combined SAT scores for entering college students nationwide were 1006 in 1989, 1010 in 1995, 1019 in 2000, 1028 in 2005, 1017 in 2010, and 1010 in 2014 (College Board, 2015). The University of Arizona scores are around the 60th percentile of the national distribution of scores and so are typical of a large public university.
Women are slightly underrepresented relative to their fraction of the overall undergraduate population, which is 52-54% and relatively stable over this time interval. In terms of majors, the largest groups in the sample are from professional programs of Law, Business, Architecture, followed by Social and Behavioral Science, and Fine Arts and Humanities. A small fraction of the students in general classes for non-science majors are science majors who happen to be interested in astronomy, 3-4%. There has been a decline in the number of students with undeclared majors at the time of the survey, but no significant change in the mix of majors. Self-reported GPA shows no time evolution and a slightly higher GPA for women in the sample than for men.
Survey Instrument
The survey instrument, its means of being administered, and procedures for data entry, error checking, and coding are described in Impey et al. (2011). The two parts of the survey, diagnosing science knowledge and attitudes and opinions toward science, are given in Appendix A and Appendix B of this paper. We use the shorthand Q1, Q2, etc., and L1, L2, etc., in this paper to refer to specific items from the survey. Although the survey is anonymous, information is collected on student gender, major, self-reported GPA, class standing, and the number of college science courses already taken. The first part of the survey overlaps an instrument used by the National Science Foundation since the 1980’s to inform science policy (National Science Board, 2016). There are fourteen true/false and multiple choice science content questions spanning the physical and life sciences, nine of which overlap with the NSF instrument. In addition, there are four questions with open-ended responses, the coding of which is described elsewhere (Antonellis et. al, 2012). Responses to the open-ended questions are not addressed in this paper.
The attitudinal component of the survey consists of 24 statements about science, technology, and society which are coded on a five point Likert scale (5 = strongly agree, 4 = agree, 3 = no opinion, 2 = disagree, 1 = strongly disagree). This part of the survey was devised by the lead author in 1988 and it has no equivalent in any national study. The items are designed to probe student attitudes towards science and technology, susceptibility to superstition and pseudoscience beliefs, and opinions on topics of current societal concern such as climate change, nuclear power, and genetic engineering. An exploratory factor analysis showed that these items could be grouped into four distinct categories: belief in unscientific phenomena (psychic powers, lucky numbers, etc.), belief in aliens and extraterrestrial life, faith-based beliefs (creationism, faith healing, etc.), and positive attitudes towards science and technology (Impey, Buxner, & Antonellis, 2012). These categories matched those determined by expert review and were confirmed through a confirmatory factory analysis on an independent random sample of data. Both parts the survey are unchanged over the time span of data reported in this paper.
Data Collection
Electronic Journal of Science Education ejse.southwestern.edu showed an error rate of less than 0.1%. More discussion of the survey methodology is given by Impey et al. (2011).
Analysis
Analysis for the knowledge items is done by calculating the number of forced choice items each person gets correct and reporting scores as a percent correct out of the total. These items are analyzed individually and in groups (e.g. all physical science items) by graphing the fraction percent each year by different demographic characteristics, the error bars on the graph show the standard error of the mean for each sample year of the data. Each set of data has a line calculated as a fit for the linear trend of the data, the slope of which indicates the average change of the percent correct over time, the significance value indicates that the slope is significantly different than zero, indicating change over time. To determine if changes across time at the university from freshmen to seniors, were significantly different, we used a Kruskal-Wallis H tests, non-parametric statistical tests to test group differences. This test was used due to the non-normal distribution of the data.
Findings
The findings are reported according to the research questions listed earlier in this paper. They are separated into science knowledge (Appendix A) and attitudes and opinions toward science and technology (Appendix B).
Question 1a: Changes in Science Knowledge?
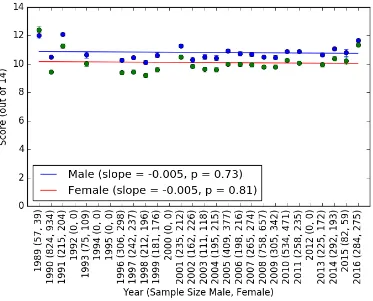
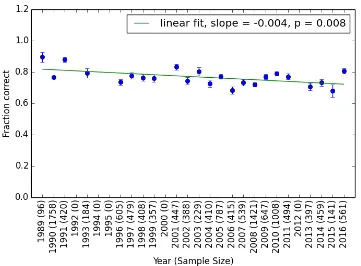
Figure 2. Score on the factual knowledge part of the survey.
Although we cannot follow cohorts using this data, within a given class there is a significant difference between groups of people who took different numbers of science courses. For example, for sophomores the mean science score increases from 71% for those who have yet to take a science course to 78% for those who have taken three. In all four years, these gains are significant at the p < 0.0001 level. On the other hand, if students are grouped by the number of science courses they have taken, the difference among class years for two or three science classes taken is not significant at the p = 0.01 level. The conclusion from this comparison is that knowledge gains are attributable to the science classes rather aggregation of knowledge from other sources during the time at college.
Electronic Journal of Science Education ejse.southwestern.edu whether astrology is scientific since the late 1970’s. The percentage of Americans that regard astrology as unscientific has increased from 50% in 1979 to 65% in 2014, in striking contrast with a widespread undergraduate belief in astrology. Over the survey period the percentage of college students who consider astrology as not at all scientific was persistently only about 20%.
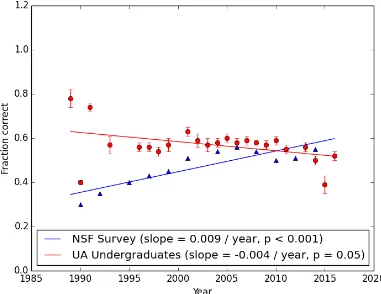
On the awareness that viruses cannot be killed by antibiotics (Q13), we see that students have low success in answering this question, and a marginally significant decline in time to just over 50%. Meanwhile the adult audience sampled by the NSF has improved their performance on this item by nearly a factor of two (Figure 3). This is the only knowledge question when the general public now matches college students. There are only two other items with significant time trends among the college students. One is the question on the big bang (Q5), which shows a slight gain in performance level over time for both students and the general public, but a persistent factor of two performance gap between the two populations (Figure 4). The second is the multi-part question on inherited illnesses (Q15), not part of the NSF survey, which shows a slight decline in student performance level over the 27 years of data (Figure 5).
In sum, and without any substantial improvement in 27 years: about 40% think that antibiotics kill viruses (Q13) and think that lasers work by focusing sound waves (Q3), about 20% don’t know how long it takes for Earth to orbit the Sun (Q10), don’t realize electrons are smaller than atoms (Q4), don’t accept that humans evolved from animals (Q7), don’t know that the oxygen that we breathe was produced by plants (Q2), and they think that humans coexisted with dinosaurs (Q8) and that radioactive milk can be made safe by boiling it (Q12). To many educators and scientists these are eye-popping holes in basic scientific knowledge. The modest 7% gain in knowledge after three science courses indicates that work remains to be done to tether the advances of modern science in the minds of college graduates.
We see overall high acceptance of plate tectonics, or continental drift (Q6), human evolution (Q7), and an acceptance of the big bang (Q8) up to levels of 80 to 90%. Two of these are items with the largest difference between acceptance by students and by the general public, 42% of who affirm the big bang and 49% of who affirm human evolution. Question design may play a role in this difference, since an experiment in the General Social Survey added prefaces to make it clear that the questions referred to conclusions of the scientific community. When these items were changed to “according to the theory of evolution, human beings as we know them today developed from earlier species of animals” and “according to astronomers, the universe began with a big explosion,” the scores for the public improved substantially (National Science Board, 2016). The big bang question is also problematic for astronomers, since an explosion is a poor analogy for the creation of rapidly expanding space-time. The lack of a gain in awareness of the role of antibiotics is a surprise given the increase in health awareness and biology information in the past 27 years. Understanding the correct role of antibiotics is the only area where public knowledge has caught up with that of college students (Figure 3).
that antibiotics kill only bacteria (Q13). Meanwhile, some items see no gains over a college career, such theory of plate tectonics (Q6), evolution (Q7), and the origin of the oxygen we breathe (Q2). Gains on physical science items are larger on average than gains on
Figure 3. Fraction of respondents disagreeing with the statement that “antibiotics kill viruses as well as bacteria” (Q13).
biology items and it is unclear if this is related to instruction. In terms of gender effect, men perform better than women on physical science items like the nature of the Earth’s orbit (Q10) and the way lasers work (Q3), while on life science items like evolution (Q7) or the origin of the oxygen we breathe, gender effects are small or absent (Q2).
Question 1b: Effect of New Science Requirement?
Electronic Journal of Science Education ejse.southwestern.edu University of Arizona’s Office of Academic Affairs suggest that only 15-20% of the classes sampled in this survey were using the active learning methods (Gail Burd and Tom Fleming, 2016, personal communication).
Figure 5. Fraction of respondents correctly answering a four-part question to demonstrate understanding of the transmittance of inherited illnesses (Q15).
Question 1c: Gender Effects?
There is a small gender offset (Figure 2), with men scoring about 5% higher than women, and that also shows no time trend. When the items are divided into six life science questions and eight physical science questions, the gender effect is smaller for life science than for physical science.
Something analogous is seen in the recent NSF data, where men score 9% higher on the physical science index while women score 4% higher on the biological science index. The gender effect might be explained by the tendency for men to guess rather than not answer a question (Mondak, 2004).
Question 1d: Comparison to the Public?
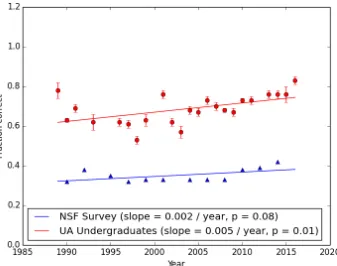
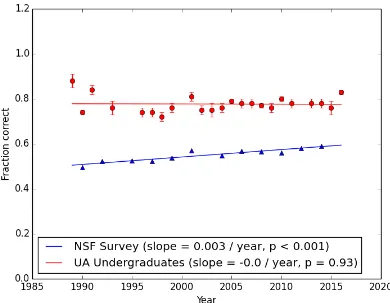
Electronic Journal of Science Education ejse.southwestern.edu Figure 6. Fraction of all the factual knowledge questions correct, for college students and for the general public as measured by the NSF.
degree, to 81% for those with a graduate or professional degree. Student scores in our sample range from 72% for incoming freshmen to 81% for graduating seniors, numbers which match well with the college-educated adults of a wider range of ages in the general public. The gain in science knowledge from those entering to those leaving college is small, but should be treated with caution; students who are taking General Education classes as seniors may have been avoiding taking science and so may be weaker than average in science.
Question 2a: Have Attitudes and Opinions Changed?
(L4, slope = 0.021 / year, p = 0.0003). Taking three required science classes does not seem to lead students to be more skeptical or use evidence-based reasoning to form their beliefs.
Question 2b: Has Support of Science and Technology Changed?
Electronic Journal of Science Education ejse.southwestern.edu Figure 7. Significant time trends for Likert scale items: a) L13: “Technology has too much control over our lives”, b) L12: “Computers will eventually be intelligent enough to think like humans”, c) L7: “Some people have psychic powers”, d) L9: “There are some circumstances when medical science should not be used to prolong life”.
With a survey that spans the birth of the Internet, major events in the space program, and the rise of genomics, we also looked for any impact of major news events on attitudes). The basis of any comparison with the general public is the normalized frequency of the relevant search term using the Google Trend tool. Support for nuclear power is slightly rising (L8, slope = 0.008 / year, p = 0.01), with no sign of any dip after the Fukushima disaster in 2011. Support for the manned space program is steady (L5), even after the setback of the Columbia disaster of 2003 and the retirement of the Space Shuttle in 2011. An increase in support for the search for extraterrestrial life (L22, slope = 0.013, p < 0.0001) may be connected with extraordinary progress in the search for exoplanets and the corresponding news coverage. We see no spikes or transient changes in response to any other individual items in the attitudinal survey.
Question 2c: Gender Effects?
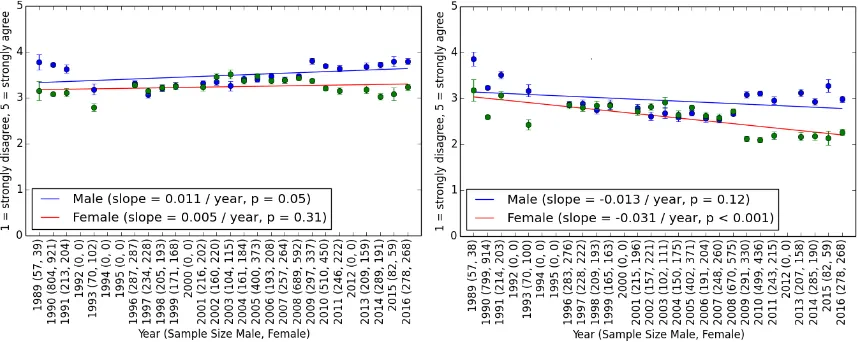
Figure 8. A gender effect in responses to the statements: L8 “Nuclear power is an important energy source and its use should be expanded” (left), L23 “Scientists should be allowed to do research that causes pain to animals, if it helps solve human health problems” (right).
Discussion
Boosting science literacy in the college population is still very much a work in progress. In terms of the research questions posed in this paper, we find the following. First, the basic scientific knowledge of undergraduate non-science majors is stubbornly stable over 27 years, even after the introduction of a new General Education curriculum that was supposed to improve science instruction, and even as the science literacy of the adult U.S. public showed modest gains. Second, the opinions of students on scientific topics are stable, with exceptions that mostly relate to the growing power of technology, and continuing susceptibility to pseudoscience and superstition coexists with strong support for the scientific enterprise.
The take home messages of this study are that (1) college students think about science in a very favorable light but have substantial holes in their basic scientific knowledge, (2) any gains in knowledge as a result of required science courses are modest or absent, (3) the scientific literacy of college students at a large, typical public university has not increased despite proven effectiveness of active learning methods, an increase in the taking of high school science courses, and a rising awareness of the importance of science and technology, and (4) shifts in student opinions about scientific issues are probably more strongly framed by exposure to science in the media than by formal instruction in the classroom. We note that caution should be used in extrapolating the results of this work to the entire college-age population in the U.S., in particular due to non-uniform sampling of the participants in this survey.
The last inference needs to be validated by a survey of where students get their science information, which we have undertaken and expect to report on within the next year. For perspective, students will spend about 110 hours over five years in the classroom for their science requirement at the University of Arizona, or an average of 3.5 minutes per day. Meanwhile, over those same five years they will spend 540 minutes a day engaged in various types of digital media, and just 26 minutes a day spent reading for their homework or classwork (Common Sense Media, 2015). For millennials, science they seek out or encounter is tiny component of their overall data diet. Increasing the amount and quality of science content online would be a useful long term goal for all scientists and educators, along with giving students the information literacy to be able to distinguish reputable from disreputable sources.
Electronic Journal of Science Education ejse.southwestern.edu we cannot follow a cohort of students. This is just the same as the gain from freshmen to seniors among students who took had taken no science classes at the time they were surveyed. Thus, students can increase their knowledge over four to five years spent in college without any formal instruction. A regression analysis revealed that for our population, the number of science classes taken accounted for less than 5% of the variance in students’ knowledge score (Buxner, Antonellis, & Impey, 2010). Interestingly, the same analysis also saw less than 5% of the variance be accounted for by the range of student beliefs (Impey et al., 2012). A similar analysis conducted on the full data set shows that student beliefs account for just over 6% of variance in their knowledge scores. Given the persistence of superstitions and pseudoscience beliefs, this shows that college science teaching is not inducing students into logical ways of thinking that they can then apply in their everyday lives.
Scientists attempt to be egalitarian in their view of knowledge. All understanding of the natural world has intrinsic value, whether it is knowledge of the structure of an atom, or the way information is coded in a genome, or how stars and galaxies formed from an initially hot and smooth universe. However, an adult can be fully engaged in civic life without understanding the Higgs mechanism or knowing the exact age of the universe, but they would hampered by not understanding the mechanisms and causes of climate change or the nature of heritable diseases. Science teaching in the college classroom can harness natural curiosity, but it also must connect science issues to everyday life and to human health and wellbeing. This is the central challenge of the 21st century science educator.
Acknowledgment
References
AAAS. (2016). Historical Trends in Federal R&D. Retrieved from http://www.aaas.org/page/historical-trends-federal-rd
Antonellis, J., Buxner, S., Impey, C., & Sugarman, H. (2012). Surveying science literacy among undergraduates: insights from open-ended responses. Journal of College Science Teaching, 41(3), 82-90.
Bateman, A., & Logan, D. W. (2010). Time to Underpin Wikipedia Wisdom. Nature, 468, 765-765.
Buxner, S., Antonellis, J., & Impey, C. D. (2010). A Long-Term Study of Undergraduates’ Science Literacy: Exploring Responses to Policy-Driven Survey Items. In Annual meeting of the National Association for Research in Science Teaching (Philadelphia, PA).
Buxner, S., Impey, C., & Tijerino, K. (2013). Investigating Where Students Get Their Information About Science. In Communicating Science: A National Conference on Science Education and Public Outreach 473, 305.
Bybee, R., McCrae, B., & Laurie, R. (2009). PISA 2006: An assessment of scientific literacy. Journal of research in Science Teaching, 46(8), 865-883.
CCSSO. (2007). State Indicators of Science and Mathematics Education 2007. Retrieved August
27, 2016, from
http://programs.ccsso.org/content/pdfs/SM%2007%20report%20part%201.pdf
College Board. (2015). SAT Program Participation and Performance Statistics. Retrieved from https://research.collegeboard.org/programs/sat/data
Common Sense Media. (2015). The Common Sense Census: Media Use by Tweens and Teens. Retrieved from https://www.commonsensemedia.org/research/the-common-sense-census-media-use-by-tweens-and-teens
Falk, J. H., & Dierking, L. D. (2010). The 95 Percent Solution: School is Not Where Most Americans Learn Most of Their Science. American Scientist, 98, 486-493.
Falk, J. H., & Needham, M. D. (2013). Factors Contributing to Adult Knowledge of Science and Technology. Journal of Research in Science Teaching, 50(4), 431-452.
Freeman, S., Eddy, S. L., McDonough, M., Smith, M. K., Okoroafor, N., Jordt, H., & Wenderoth, M. P. (2014). Proceedings of the National Academy of Sciences, 111(23), 8410-8415. Gokhale, A.A., Rabe-Hemp, C., Woeste, L., & Machina, K. (2015). Gender differences in attitudes
toward science and technology among majors. Journal of Science Education and Technology, 24, 509-516.
Gunstone, R. (2015). Scientific Literacy. In Encyclopedia of Science Education. (pp. 944-947). Dordrecht, Germany: Springer.
Hayes, B.C., & Tariq, V.N. (2000). Gender differences in scientific knowledge and attitudes toward science: A comparative study of four Anglo-American nations. Public Understanding of Science, 9, 433-447.
Hurd, P.D. (1958). Science Literacy: Its Meaning for American Schools. Educational Leadership, 16(1), 13-16.
Impey, C.D., Buxner, S., Antonellis, J., Johnson, E., & King, C. (2011). A Twenty-Year Survey of Science Literacy Among College Undergraduates. Journal of College Science Teaching, 40, 31-37.
Electronic Journal of Science Education ejse.southwestern.edu Impey, C. D., Wenger, M. C., & Austin, C. L. (2015). Astronomy for astronomical numbers: A worldwide massive open online class. The International Review of Research in Open and Distributed Learning, 16(1).
Laugksch, R. C. (2000). Scientific literacy: A conceptual overview. Science Education, 84(1), 71-94.
LIFE Center. (2005). The LIFE Center's Lifelong and Lifewide Diagram. Retrieved from http://life-slc.org/about/about.html
Losh, S.C. (2006). Generational and Educational Effects on Basic U.S. Adult Civic Science Literacy. The Korean Science Foundation and the Korean Academy of Science and Technology, 836-845.
Losh, S.C. (2010). Diverse Digital Divides in American Society: 1983-2006. In E. Ferro, Y. K. Dwivedi, J. R. Gil-Garcia, & M. D. Williams (Eds.), Overcoming Digital Divides: Constructing an Equitable and Competitive Information Society (pp. 196-222). Hershey, PA: IGI Global.
Losh, S.C. (2012). Stereotypes About Scientists Over Time Among U.S. Adults: 1983 and 2001. Science, 19(3), 372-382.
McCurdy, R.C. (1958). Towards a Population Literate in Science. The Science Teacher, 25, 366-368.
Miller, J.D. (1983). Scientific Literacy: A Conceptual and Empirical Review. Daedelus, 112(2), 29-48.
Miller, J.D. (1998). The Measurement of Civic Science Literacy. Public Understanding of Science, 25, 465-479.
Miller, J.D. (2012). What Colleges and Universities Need to Do to Advance Civic Scientific Literacy and Preserve American Democracy. Liberal Education, 98(4).
Miller, J. D., & Pardo, R. (2000). Civic scientific literacy and attitude to science and technology: A comparative analysis of the European Union, the United States, Japan, and Canada. Between understanding and trust: The public, science and technology, 131-156.
Mondak, J.J. (2004). Knowledge Variables in Cross-National Social Inquiry. Social Science
Quarterly, 85(3), 539-558.
National Center for Education Statistics. (2014). The Condition of Education, High School
Coursetaking. Retrieved from http://nces.ed.gov/programs/coe/indicator_cod.asp
National Science Board. (2016). Science and Engineering Indicators. Retrieved from https://www.nsf.gov/statistics/2016/nsb20161
Okoli, C., Mehdi, M., Mesgari, M., Nielsen, F. A., & Lanamaki, A. (2014). Wikipedia in the Eyes of its Beholders. Advances in Information Science, 65, 2381-2403.
Osborne, J., Simon, S., & Collins, S. (2003). Attitudes towards science: A review of the literature and its implications. International Journal of Science Education, 25(9), 1049-1079. Sadler, T. D., & Zeidler, D. L. (2009). Scientific literacy, PISA, and socioscientific discourse:
Assessment for progressive aims of science education. Journal of Research in Science
Teaching, 46(8), 909-921.
Sacco, K., Falk, J. H., & Bell, J. (2014). Informal Science Education: Lifelong, Wide, Life-Deep. PLOS Biology, 12(11), 1-3.
Sugarman, H., Impey, C., Buxner, S., & Antonellis, J. (2011). Astrology beliefs among undergraduate students. Astronomy Education Review, 10(1), 010101.
Thomas, G., & Durant, J. (1987). Why Should We Promote the Public Understanding of Science? In M. Shortland (Ed.), Science Literacy Papers (pp. 1-14). Oxford, UK: Oxford University Department for External Studies.
University of Arizona 2015. The UA Fact Book, Retrieved from http://factbook.arizona.edu/. Wikipedia. (2016). Wikipedia Year of Science. Retrieved from
https://en.wikipedia.org/wiki/Wikipedia:Year_of_Science
Electronic Journal of Science Education ejse.southwestern.edu Appendix A: Science Literacy Questions:
Q1) Would you say that astrology is very/sort of/not at all scientific? Q2) The oxygen we breathe comes from plants.
Q3) Lasers work by focusing sound waves. Q4) Electrons are smaller than atoms.
Q5) The universe began with a huge explosion.
Q6) The continents on which we live have been moving apart for millions of years, and will continue to move in the future.
Q7) Humans, as we know them today, evolved from earlier species of animals. Q8) The earliest humans lived at the same time as dinosaurs.
Q9) Which travels faster, light or sound?
Q10) Which is true? (a) The Earth goes around the Sun or the Sun goes around the Earth? (b) How long does the orbit in the previous question take?
Q11) If the rate of inflation is falling, are prices decreasing, level, increasing? (Not used in this analysis.)
Q12) Radioactive milk can be made safe by boiling it. Q13) Antibiotics kill viruses as well as bacteria.
Q14) Is all radioactivity manmade/some occurs naturally.
Q15) A doctor tells a couple that they have a one in four chance of having a child with an inherited illness. Does that mean that:
If they have only three children, none will have the illness?
If their first child has the illness, the next three will not?
Each of the couple’s children will have the same risk of suffering the illness?
If the first three children are healthy, the fourth will have the illness?
Appendix B: Likert Scale Items
L1) Overall, the progress of science and technology has been beneficial to our civilization. L2) The Biblical story of creation should be taught alongside evolution theory in our schools. L3) There are phenomena that physical science and the laws of nature cannot explain.
L4) The positions of the planets have an influence on the events of everyday life. L5) UFOs are real and should be investigated.
L6) It is almost certain that there are intelligent lifeforms in other parts of the Universe. L7) Some people possess psychic powers.
L8) Nuclear power is an important energy source and its use should be expanded.
L9) There are some circumstances when medical science should not be used to prolong life. L10) The Universe was created in an enormous explosion billions of years ago.
L11) Some ancient civilizations were visited by extraterrestrials.
L12) Computers will eventually be intelligent enough to think like humans. L13) Technology has too much control over our lives.
L14) Scientists should take responsibility for the bad effects of their theories and inventions. L15) The government should strongly support the manned space program.
L16) Genetic engineering is a good idea.
L17) We should devote more of our money and scientific resources to repair damage done to the environment.
L18) Pure science should be funded regardless of its lack of immediate benefit to society. L19) Science will come up with a way to dispose of toxic waste.
L20) We should exert more control over the nuclear weapons developed by scientists. L21) Faith healing is a valid alternative to conventional medicine.
L22) We should make a concerted effort to search for life on other planets.