Examination Of The Influence Of Service
Quality On Membership Renewal In Fitness
Centers In San Francisco Bay Area
Pei Chih Wei, Hsin Sheng College of Medical Care and Management, TaiwanHuang-Chia Hung, National Taitung University, Taiwan Hiu-Chu Yang, National Taiwan College of Physical Education, Taiwan
Yu-Jui (Arthur) Hsu, Northwestern Polytechnic University, USA Zhengwei Ma, Northwestern Polytechnic University, USA
ABSTRACT
Corporations have to learn how to satisfy their customers’ various demands as the era of interactivity with customers has emerged (Pepper & Rogers, 1999). For fitness center, customers’ demands are increasing and diversified. Therefore, service quality is an index of quality assessment from customers for service-producing industries. Furthermore, the concept of corporate expansion and customer relationship has become the foundation of service-providers for higher profitability through customers’ renewal of membership. The main purpose of this study is to evaluate the impact of service quality on the renewal willingness of fitness center membership. Customers from four fitness centers in the San Francisco Bay Area, USA, were randomly selected for this survey. A total of 50 subjects participated in this survey. The data was analyzed by multiple regression and stepwise regression. The result indicated that the service quality has positive influence on the renewal willingness of membership.
Keywords: Fitness Center, Service Quality, Renewal Willingness, Behavior Intention
CHAPTER ONE: INTRODUCTION
Background
he economy is growing rapidly nowadays and living standard is increasing higher. The technology evolves everyday. Instead of repeatedly using traditional way of handing housework, most people take advantage of modern technology and use latest products to make their life easier, resulting in reduction of exercise. In addition, unhealthy and obsessive eating behavior also contributes to the growth of civilization diseases. For relaxation by engaging more recreational activities outdoor, people can only utilize their time after work or take a vacation occasionally. However, people actually would expect to enjoy more their life from leisure activities in addition to their work and daily routines. People relax themselves by taking a walk after work or taking a vacation. But the most important thing they want is the enjoyment of leisure experience. Relevant medical science articles have been published constantly regarding this issue. Although “how to live healthier and safer” is what people care the most, most people still focus on searching “professional consultation in sports for healthy living style”. Recently, the pursuit of fashionable recreational sports becomes a trend. Basically, apart from leisure venues and sports facilities, consumers would further like to receive comfortable and perfect services.
Research Motivation
According to the report by International Health, Racquet and Sportsclub Association (IHRSA) in January, 2001, there were 6,211 health and fitness clubs in USA in 1982. The number of clubs increased to 9,222 in 1985. The total members of these clubs amounted to 13.8 millions in 1985. In January 2002, health and fitness clubs had been soaring up to 17,807 with total members of 33.8 millions. This report indicates that the total number of the fitness centers had jumped 30-fold in 20 years in between 1982 and 2002. The total number of members had been growing steadily since 1982. Due to the change of consumption patterns and the rise of consumer awareness, the competition in marketing becomes fiercer. Therefore, it is particularly important for fitness centers to retain their
existing customers. While more interactive with customers, fitness centers should learn how to satisfy various needs of their customers. (Pepper & Rogers, 1999).
During the last decade, the interest of both marketing practitioners and scholars alike regarding the notion of “customer value” has increased (Gale, 1994). Although delivering superior customer value is an important factor for fitness centers’ success. (e.g., Bolton and Drew, 1991; Gronroos, 1994, 1997; Zeithaml et al., 1996; Parasuraman, 1997), researchers have also acknowledged the importance of customer value for improving the performance program of customer’s relationship management (Day, 1994; Slater, 1997; Wang et al., 2004). For fitness centers, aiming at stabilizing customer segments can be more profitable than investing more capitals in marketing. Good customer relationship is significant intangible assets for fitness centers. If fitness centers ignore the business relations with customers, customer loyalty will gradually be eroded. As a result, the fitness centers will gradually lose this asset which will impact their revenues and profitability (Anton, 1996).
Therefore, this research is to study the impact of fitness center’s service quality on customer’s renewal willingness and in hope that the findings will be used to provide a better strategy for managing fitness centers.
Research Purposes
Based on the research motivation and background, this study is to further explore the relationship between fitness center’s service quality and consumer’s renewal willingness to establish a suitable theoretical model. Facing with fierce competitions, fitness centers should let consumers have their own choices of selecting their preferred fitness center in order to improve service quality and achieve a lower customer attrition rate. This is the primary focus of this study.
It is hoped that the results of this study will provide fitness centers industry with a better marketing strategy to be more in line with the direction of current marketing trend.
CHAPTER TWO: LITERATURE REVIEW
This chapter consists of four sections, including the origin of fitness center and, the definitions of terms used in these articles.
The origin of Fitness Center
The first fitness health club in the U.S. was originated from Young Men's Christian Association (YMCA) in the 1950s. After the 1970s, fitness centers have been constantly growing. Many products and industries pertaining to fitness center have emerged, such as squash rackets and tennis club. At the same time, the aerobic industries were popular around the world and the US fitness center industries developed stronger day by day. Finally, the USA fitness center approached to a new milestone (Patton, 1989). At the same time, aerobics had become popular all over the world. In the meanwhile, the fitness center industry had gradually developed and become more robust, and entered to a new milestone. In 1998, a report of IHRSA revealed that there were 6,211 clubs in 1982 in the US. By July 2004, the total number of clubs had reached 22,031 with more than 36.3 million members. (IHRSA, 2004) The motivation and reason to join club are based on different economic dimensions. The personal reasons could be the cost and benefits received from club by individual (Buchanan,1965).
Service Quality
Service quality is determined by customer satisfaction through services being provided, and in turn, it affects customer’s loyalty (Bitner, 1990).
The “service quality” in this study is indicated and evaluated by the answers provided from the questionnaires pertaining to fitness center’s service quality. The higher score means that the service quality provided by fitness centers is also better.
Renewal Willingness
Behavioral Intention
Behavioral intention is to explain behavioral processes. The intention indicates that “the decision- making process of choosing a behavior” results in "the extent of expression of whether engaging a behavior”. Cronin and Taylor (1992) investigated the conceptualization and measurement of service quality and the relationship between consumer satisfaction and purchase intentions. To measure the behavior intention of customers, Boulding (1993) used two questionnaires which were the desire of renewal willingness and the intention of recommendation to others. Behavior intention is a reaction of customer satisfaction by comparing their expectation of the products with their actual experience of using the products. In short, a satisfied customer will give the company a positive evaluation such as reputation and customer recognition.
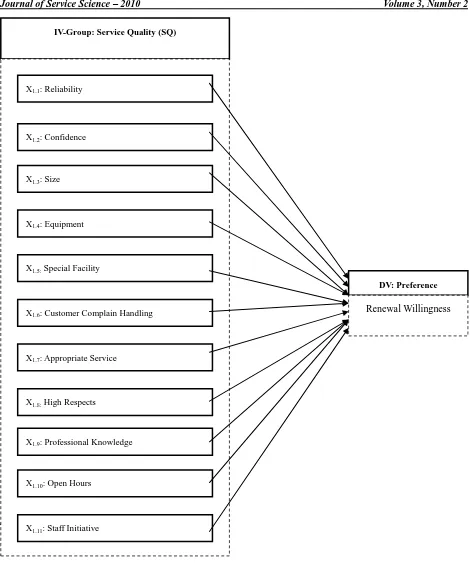
Proposed Model – Framework
Figure 2.1 Proposed Models – Framework
DV: Dependent Variable IV: Independent Variable – Figure 1.
IV-Group: Service Quality (SQ)
X1.6: Customer Complain Handling
X1.5: Special Facility
X1.4: Equipment
X1.3: Size
X1.2: Confidence
X1.1: Reliability
X1.11: Staff Initiative
X1.10: Open Hours
X1.9: Professional Knowledge
X1.8: High Respect
X1.7: Appropriate Service
DV-Group-1: Loyalty
DV1.1 –Recommendation to others DV1.2 –Recommendation Willingness
DV-Group-2: Preference
DV1.3 –First Choice
DV1.4 –No Change even Lower Fee
DV-Group-3: Renewal Willingness
Summary
According to the literature review and the definition of DV and IV, the researcher builds up the research framework. This research framework displays the correlation between the dependent variables and the independent variables, which also becomes the base of research methodology of next chapter.
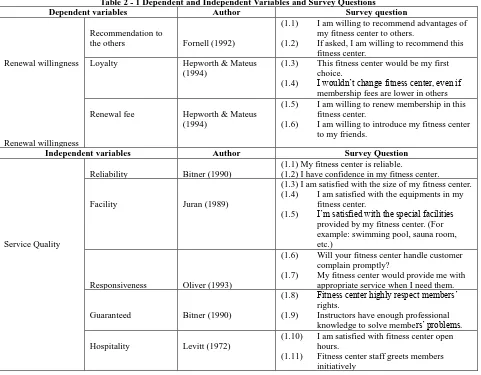
Table 2 - 1 Dependent and Independent Variables and Survey Questions
Dependent variables Author Survey question
Renewal willingness
Renewal willingness
Recommendation to
the others Fornell (1992)
(1.1) I am willing to recommend advantages of my fitness center to others.
(1.2) If asked, I am willing to recommend this fitness center.
Loyalty Hepworth & Mateus (1994)
(1.3) This fitness center would be my first choice.
(1.4) I wouldn’t change fitness center, even if membership fees are lower in others
Renewal fee Hepworth & Mateus (1994)
(1.5) I am willing to renew membership in this fitness center.
(1.6) I am willing to introduce my fitness center to my friends.
Independent variables Author Survey Question
Service Quality
Reliability Bitner (1990)
(1.1) My fitness center is reliable. (1.2) I have confidence in my fitness center.
Facility Juran (1989)
(1.3) I am satisfied with the size of my fitness center. (1.4) I am satisfied with the equipments in my
fitness center.
(1.5) I’m satisfied with the special facilities provided by my fitness center. (For example: swimming pool, sauna room, etc.)
Responsiveness Oliver (1993)
(1.6) Will your fitness center handle customer complain promptly?
(1.7) My fitness center would provide me with appropriate service when I need them.
Guaranteed Bitner (1990)
(1.8) Fitness center highly respect members’ rights.
(1.9) Instructors have enough professional knowledge to solve members’ problems.
Hospitality Levitt (1972)
(1.10) I am satisfied with fitness center open hours.
(1.11) Fitness center staff greets members initiatively
CHAPTER THREE: RESEARCH METHODOLOGY
Research Questions
(1) Is there a significant relationship between fitness center’s customer service quality and renewal willingness?
Population and Sample
(1) Population: The populations targeted are members of fitness center in San Francisco Bay Area, USA (2) Sample: A random sample of 50 people was taken from the following four fitness centers: Touchstone
Data Collection
The survey was conducted from September 20, 2009 to December 12, 2009. The questionnaires were collected from the 50 people and the data were entered into an Excel spreadsheet for analysis.
Pilot Test for Data Reliability
Cronbach's alpha is a statistic commonly used as a measure of the internal consistency or reliability of a psychometric test score for a sample of examinees. Alpha can take values between negative infinity and 1. As a rule of thumb, an alpha value of 0.70 or higher is considered reliability. In this initial stage, pilot test was performed by calculating Cronbach's alpha using all survey questions aforementioned (i.e. all dependent and independent variables in Table 2). The result is shown as follows.
Table 3 - 1 Reliability Statistics
Cronbach's Alpha N of Items
.894 17
Pearson Correlation
Pearson correlation is a measure of the correlation (linear dependence) between two variables X and Y, giving a value between +1 and −1 inclusive. It is widely used in the sciences as a measure of the strength of linear dependence between two variables. The researcher removed five dependent variables (Advantage Promotion, Recommendation Willingness, First Choice, Low Fee No Change, Introduction Willingness) and kept one dependence variable (Renewal Willingness).
Hypothesis and Variables
Based on the research question, the researcher developed the dependent variable and independent variable in the following hypothesis.
(1) Hypothesis:Renewal willingness is highly correlated with the service quality Dependence Variable (DV): Renewal Willingness
Independence Variable (IV): Service Quality
Statistical Methodology: Multiple Regression (Mertler & VANNATTA, 2005)
Table 3 - 2 Service Quality (11 dimensions):
X1.1 Reliability X1.2 Confidence
X1.3 Size X1.4 Equipment
X1.5 Special Facility X1.6 Customer Complain Handling
X1.7 Appropriate Service X1.8 High Respect
X1.9 Professional Knowledge X1.10 Open Hours
X1.11 Staff' Initiative
CHAPTER FOUR: DATA ANALYSIS
In this chapter, the researcher pre-analyzed and pre-screened the raw data, and interpreted the execution process of quantitative method of multiple regression using SPSS.
Multiple Regression -Testing of Hypothesis
Group: Renewal Willingness (DV) - Service Quality (IV)
Hypothesis: Renewal Willingness is highly correlated with the Service Quality (Reliability, Confidence, Equipment, Special Facility, Customer Complain Handling, Appropriate Service, High Respect,: Professional
Table 4-1 ANOVA
Source df Sum of Squares Mean Square F-test P-value
Regression 11 66.816 6.074 4.957 <.0001
Residual 38 46.564 1.225
Total 49 113.380
R=0.768 R2 =0.589 Adjusted R2=0.470
Table 4 - 2 Regression Coefficients
Unstandardized Coefficients
Standardized Coefficients
t-test P-value
Independent Variable Beta Std. Error Beta
Intercept -.772 1.316 -.587 .561
X1.1: Reliability -.072 .291 -.050 -.249 .805
X1.2: Confidence .249 .332 .176 .751 .457
X1.3: Size .256 .155 .268 1.653 .107
X1.4: Equipment .226 .266 .206 .850 .401
X1.5: Special Facility -.084 .172 -.093 -.491 .626
X1.6: Customer Complain Handling -.042 .214 -.030 -.197 .845
X1.7: Appropriate Service .097 .281 .075 .345 .732
X1.8: High Respect .015 .269 .011 .056 .955
X1.9: Professional Knowledge -.379 .177 -.324 -2.140 .039
X1.10: Open Hours .089 .137 .087 .653 .518
X1.11: Staff Initiative .694 .143 .639 4.862 <.0001
The general model for the hypothesis of present study:
Y( Renewal Willingness)= -0.772 -0.072X1.1 + 0.249 X1.2 +0.256 X1.3 + 0.226 X1.4 – 0.084 X1.5 – 0.042X1.6 +
0.097X1.7 + 0.015X1.8 – 0.379X1.9 + 0.089X1.10+ 0.694X1.11
Discussion of Hypothesis Testing Results
The testing of the hypothesis and the results were reported in detail in this section
Multiple Regression and Stepwise Analyses
Multiple Regression
Multiple regression analysis was performed and the results were summarized and presented in Table 4-1 and Table 4-2. The ANOVA summarized in Table 4-1 indicates that the overall model of the 11 IVs significantly predicted Renewal Willingness with R=0.768, R2=0.589, adjusted R2=0.470, F(11, 38) =4.957, and p-value<0.001. The results reveal that Renewal Willingness is highly correlated to Service Quality (p-value<.05). In the meantime, the results support the hypothesis that 11 dimensions (i.e. IVs) were significantly correlated with Renewal Willingness of customers. In addition, the statistical result also shows that Professional Knowledge and Staff Initiative were significant predictors of customer’s Renewal Willingness. Although Size (p-value=0.107) was a not statistical significant at 0.05 level, it was trending toward significance. The variable “Size” should not be neglected.
Stepwise Analyses for the Hypothesis
compact model for the hypothesis, with the dependent variable being Renewal Willingness and the independent variables being Professional Knowledge, Staff Initiative and Size.
A stepwise regression analysis helps to improve the issues of co-linearity among the variables. The collinearity statistics need scrutiny when the independents are highly intercorrelated. The tolerance for a variable is (1 – R2) for the regression of that variable on all the other independent variables, ignoring the dependent variable. When tolerance is close to 0 there is high multi-collinearity of that variable with other independent variables. The statistical analysis results for the hypothesis imply that multi-collinearity was not a distinct problem since the tolerance value for the 11 variables ranges from 0.58 to 1 (Mertler & Vannatta, 2001). Thus, the statistical analysis results of the hypothesis using a stepwise regression indicate that three variables, Professional Knowledge, Staff Initiative and Size, were statistical significant predictors of Renewal Willingness.
The regression equation arrived in a sequence of multiple linear regression equations, in a stepwise manner. At each step of the sequence, one variable is added to the regression equation. The variable added is the one that makes the greatest reduction in the error sum of squares of the sample data. Equivalently, it is the variable that when added, provides the greatest increase in the F value. Consequently, the result showed that one variable, Size, which had not been statistically significant when analyzed by multiple regression, was then statistically significant via the stepwise analysis. In other words, it would be reasonable to include variable Size as one of the important dimensions of Service Quality in predicting Renewal Willingness. In addition to the model shown in Table 4-3, the estimates of the slopes (i.e. betas) of variables by stepwise regression were presented in Table 4-4.
The compact model selected by stepwise regression:
Y (Renewal Willingness) = 0.294 + 0.387X1.3 - 0.288X1.9 + 0.758X1.11
Table 4 - 3 Stepwise Regression - Model Summary
Model R R Square Adjusted R Square
1 .628(a) .394 .381
2 .694(b) .482 .460
3 .725(c) .526 .495
a Predictors: (Constant), X1.11 (Staff Initiative)
b Predictors: (Constant), X1.11 (Staff Initiative) ,X1.3 (Size)
c Predictors: (Constant), X1.11 (Staff Initiative), X1.3 (Size), X1.9 (Professional Knowledge)
Table 4 - 4 Stepwise Regression Coefficients
Source
Unstandardized Coefficients
Standardized Coefficients
t-test p-value
Beta Std. Error Beta
(Constant) .294 .820 .359 .722
X1.11: Staff Initiative .758 .116 .697 6.531 <.001
X1.3: Size .387 .109 .405 3.542 .001
X1.9: Professional Knowledge -.288 .139 -.247 -2.071 .044
Table 4-5 Stepwise Regression - Excluded Variables
Model
Collinearity Statistics Tolerance
1 X1.1: Reliability .939
X1.2: Confidence .959
X1.3: Size 1.000
X1.4: Equipment .966
X1.5: Special Facility .980
X1.6: Customer Complain Handling .925
X1.7: Appropriate Service 1.000
X1.8: High Respects .940
X1.9: Professional Knowledge .923
X1.10: Open Hours .824
2 X1.1: Reliability .609
X1.2: Confidence .590
X1.3: Size .778
X1.4: Equipment .965
X1.5: Special Facility .866
X1.6: Customer Complain Handling .860
X1.7: Appropriate Service .884
X1.8: High Respects .727
X1.9: Professional Knowledge .816
3 X1.1: Reliability .590
X1.2: Confidence .585
X1.3: Size .768
X1.4: Equipment .952
X1.5: Special Facility .737
X1.6: Customer Complain Handling .748
X1.7: Appropriate Service .751
X1.8: High Respects .803
a. Predictors: (Constant), X1.11 (Staff Initiative)
b. Predictors: (Constant), X1.11 (Staff Initiative), X1.3 (Size)
c. Predictors: (Constant), X1.11 (Staff Initiative), X1.3 (Size), X1.9 (Professional Knowledge)
4.2 Overall Proposed Models:
Diagrammatic Representation of Hypothesis
Figure 4.1 Overall Proposed Model
IV-Group: Service Quality (SQ)
X1.1: Reliability
X1.2: Confidence
X1.11: Staff Initiative
X1.10: Open Hours
X1.9: Professional Knowledge
X1.8: High Respects
X1.7: Appropriate Service
X1.6: Customer Complain Handling
X1.5: Special Facility
X1.4: Equipment
X1.3: Size
DV: Preference
CHAPTER FIVE: CONCLUSION AND CONTRIBUTION
There are three sections in this chapter. The first section is the analysis and finding of the overall model. The second section is research hypothesis and result identified. The last section presents the research conclusion and suggestion according to the analysis result.
Analysis and Finding of the Overall Model
This research constructed the theoretical model by literature review and randomly selected the members from various fitness centers as the research target. Based on multiple regression analysis, the results indicated that the overall theoretical model was acceptable and supported by the data collected. Therefore, the model which consists of “Service Quality” and “Renewal Willingness” could be applied to fitness industries.
Research Hypothesis and Result Identified
Upon examination of the hypothesis, R2 of 0.589 from multiple regression analysis indicated that renewal willingness was highly correlated with service quality. Furthermore, three IVs, “Staff Initiative”, “Size” and “Professional Knowledge” representing service quality weree selected as significant predictors of renewal willingness based on stepwise regression analysis. Among these three, “Staff Initiative” was the most significant one (p<0.001), which was most influential on renewal willingness. In particular, if the staffs of fitness center were more attentive to their customers with passion, treating them like a family member, the customers would be much satisfied with the services of the fitness center provided. It seems to the researcher that it is essential and imperative for running the fitness center with strong staff initiative.
In addition, “Size” (i.e. size and space of fitness center) which was part of “Service Quality” was also a significant predictor (p=0.001) for “Renewal Willingness”. It is worth noting that the future expansion or renovation of a fitness center may enhance “Renewal Willingness” of their customers.
The third significant predictor (p=0.044), Professional Knowledge, based on stepwise regression which had a negative linear relationship with Renewal Willingness (slope=-0.288).
It is interesting to note that Professional Knowledge was a more significant predictor from multiple regression analysis (p=0.039) then that from stepwise regression analysis. However, Size was significant in stepwise regression analysis (p=0.001) rather than in multiple regression (p=0.107). This may indicate that the collinearity among the IVs may need further investigation in future researches.
Service Quality Improvement
When fitness center has a nice relationship with customers, the interaction with their customers will also be positive. As such, the service quality of fitness center could also be improved. In addition, when the customers have any questions, fitness center can provide a specialist or various alternatives (including telephone hot-line or website) to resolve their problems promptly. This could increase customer’s overall confidence level, satisfaction and loyalty dramatically.
Finally, when the price of membership renewal fluctuates due to overall economy, customers will be likely to stick with their fitness center due to the service quality experienced. This finding is consistent with the research result of Crosby et al. (1990).
Conclusions and Recommendations
In general, the renewal willingness of consumers usually depends on the reputation of fitness center. Fitness center can focus on customers of various groups to expend their programs for more versatile services, such as customized service for individual’s needs. It would boost business reputation and customer’s loyalty, and even help with customer retention rate.
If these goals can be achieved, the fitness center will not only be more competitive, but also more profitable.
BIBLIOGRAPHY
1. Anton, J. (1996). Customer relationship management. Prentice Hall
2. Boulding,W.,Kalra,A.,Staelin,R., & Zeithaml,V.A. (1993). A dynamic process model of service quality: From expectation to behavioral intentions. Journal of Marketing Research, 15(1), 7-27.
3. Buchanan, J.M. (1965), "An economic theory of clubs", Economicia, 32(125), 1-14.
4. Bitner, M.J. (1990), "Evaluating service encounters: the effects of physical surroundings and employee responses", Journal of Marketing, 54, 69-82.
5. Bolton, R. N. y Drew, J. H. (1991a). A multistage model of customer's assessments of service quality and value. Journal of Consumer Research,17(4), 375-384.
6. Cronin, J.J., & Steven, A.T.(1992). Measuring Service quality: A Reexamination and Extension. Journal of Marketing, 56(July), 55-68.
7. Craig A. Mertler, Rachel A. Vannatta. (2005). Advanced and multivariate statistical methods: practical application and interpretation. Glendale, CA : Pyrczak, c2005.
8. Day, G. (1994). “The capabilities of market-driven organizations,” Journal of Marketing,58(4), 37-52. 9. Gale, B.T. (1994). Managing Customer Value, Free Press, New York, NY.
10. Hepworth, M. and P. Mateus (1994). Connecting customer loyalty to the bottom line. Canadian Business Review, 21(4), 40-43.
11. IHRSA(2004).Trend Report 2004, July 2004: IHRSA
12. Juran, J. M. (1989). A universal approach to managing for quality. Quality Progress,6(5), 15. 13. Levitt, T. 1972. Production-line approach to service. Harvard Business Review,50(2): 41-52. 14. Mertler, C. A., & Vannatta, R. A. (2001). Advanced and Multivariate Statistical Methods: Practical
Application and Interpretation. Los Angeles: Pyrczak Publishing.
15. Oliver, R. L.(1993). Contitive, affective, and attribute bases of the satisfaction .Journal of Customer Research,20(40), 418-430.
16. Patton, R,W., Granthan, W.C., Gerson R., & Gettman (1989). Developing and Managing Health/Fitness Facilities. Champaign, llinois: Human Kinetics Books.
17. Peppers, D., Roger, M., & Dorf, R. (1999). Is your Company Ready for one-to-one Marketing. Harvard Business Review, (Jan-Feb), 151-160.
18. Parasuraman, A.,Zeithaml V. & Berry L.(1985). "A Conceptual Model of Service Quality and Its Implications for Future Research". Journal of Marketing, 49, 41-50.
19. Parasuraman, A. (1997). “Reflections on gaining competitive advantage through customer value,” Journal of the Academy of Marketing Science, 25(2), 154-161
20. Slater, S.F. (1997). “Developing a customer value-based theory of the firm,” Journal of the Academy of Marketing Science,25(2), 162-167.
21. Storbacka, K., T. Standvik, and C. Gronroos (1994). “Managing customer relationships for profit: The dynamics of relationship quality,” International Journal of Service Industry Management, 5(5), 21-38. 22. Wang, Y., Lo, H.P., Chi, R., and Yang, Y. (2004). “An integrated framework for customer value and
customer-relationship-management performance: A customer based perspective from China,” Managing Service Quality, 14(2-3), 169-182.