Supplemental Nutrition Assistance Program
Participation and Child Food Security
WHAT’S KNOWN ON THIS SUBJECT: Recent studies have shown that participating in the Supplemental Nutrition Assistance Program (SNAP) is associated with improved household food security. With the exception of 1 descriptive analysis, studies have not examined how SNAP affects children’s food security.
WHAT THIS STUDY ADDS: This article estimates the association between SNAP and children’s food security using the largest, most rigorous national study of food security to date. Given current proposals to reduce program size, this study underscores SNAP’s importance in affecting children’s well-being.
abstract
OBJECTIVE:This article investigates the association between Supple-mental Nutrition Assistance Program (SNAP) participation and child food security by using data from the largest national survey of the food security of SNAP participants to date.
METHODS:The analysis used a survey of nearly 3000 households with children and a quasi-experimental research design that consisted of 2 sets of comparisons. Using a cross-sectional sample, we compared information collected from SNAP households within days of program entry with information collected from a contemporaneous sample of SNAP households that had participated for∼6 months. Next, by using a longitudinal sample, we compared baseline information collected from new-entrant SNAP households with information from those same households 6 months later. Multivariate logistic regression analysis was used to estimate associations between SNAP and child food security.
RESULTS:SNAP participation was associated with an approximately one-third decrease in the odds of children being food insecure in both samples. In the cross-sectional analysis only, SNAP was also associated with a decrease in the odds of children experiencing severe food insecurity (designated very low food security). Findings were qualitatively robust to different empirical specifications.
CONCLUSIONS: After controlling for other possible confounders, we found children in households that had participated in SNAP for 6 months experienced improvements in food security. On the basis of these findings, we conclude SNAP serves a vital role in improving the health and well-being of low-income children by increasing food security. Future research is needed to determine whether specific groups of children experience differential improvements in food security.Pediatrics2014;133:610–619
AUTHORS:James Mabli, PhD and Julie Worthington, BA
Mathematica Policy Research, Cambridge, Massachusetts
KEY WORDS
child food security, program participation, food assistance, SNAP, food stamps
ABBREVIATIONS CI—confidence interval OR—odds ratio
SNAP—Supplemental Nutrition Assistance Program SNAPFS—SNAP Food Security
TANF—Temporary Assistance for Needy Families
Dr Mabli conceptualized and designed the study, conducted the analysis, and drafted the manuscript; Ms Worthington performed the literature review, conducted the analysis, and drafted the manuscript.
www.pediatrics.org/cgi/doi/10.1542/peds.2013-2823
doi:10.1542/peds.2013-2823
Accepted for publication Jan 15, 2014
Address correspondence to James Mabli, PhD, Mathematica Policy Research, 955 Massachusetts Ave, Suite 801, Cambridge, MA 02139. E-mail: jmabli@mathematica-mpr.com
PEDIATRICS (ISSN Numbers: Print, 0031-4005; Online, 1098-4275).
Copyright © 2014 by the American Academy of Pediatrics
FINANCIAL DISCLOSURE:The authors have indicated they have nofinancial relationships relevant to this article to disclose. FUNDING:Funded by the Food and Nutrition Service, US Department of Agriculture, under contract GS-10F-0050L.
Although children in most US house-holds have adequate access to enough food for a healthy, active life, millions of children experience food insecurity each year, facing food access limitations be-cause of a lack of money or other resources. In 2011, 1 in 5 households with children was food insecure, nearly double the prevalence for households without children (1 in 8 households).1
Children were food insecure in 10% of households with children (3.9 million). In ∼1% of households with children (374 000), children experienced very low food security, a severe form of food insecurity consisting of reductions in food intake and disrupted eating pat-terns because their families were un-able to afford enough food.
Research has shown that child food in-security can be associated with a num-ber of adverse health and developmental outcomes among children.2,3 These
in-clude poorer health and repeated hos-pitalizations,4–9lower physical function
including iron deficiency,9–12lower
ele-mentary school math and reading achievement,13–15 higher likelihood of
depression and anxiety,9,12,16–18 and
poorer psychosocial function.12,15,17,19,20
As the largest federal nutrition assis-tance program in the United States, the Supplemental Nutrition Assistance Program (SNAP) aims to reduce hunger and improve the health and well-being of low-income individuals and families. One of the program’s goals is to reach disadvantaged families with children. SNAP provided benefits to 47 million Americans in 2012, with children mak-ing up nearly half of all participants.21,22
Policy makers, advocates, and those administering SNAP have long hypothe-sized that SNAP reduces food insecurity. However, estimating the effect of SNAP on food insecurity by using household survey data has been challenging be-cause of selection bias. Eligible house-holds that choose to participate in SNAP may differ in systematic ways from
households that do not, making it diffi -cult to identify whether differences in food insecurity between participants and nonparticipants reflect true pro-gram effects or differences in observ-able or unobservobserv-able characteristics of the 2 groups.23–26Most research studies
have attempted to isolate SNAP’s effect on food insecurity from the composi-tional differences between participants and nonparticipants by using a variety of data and empirical methods, but ev-idence of the program’s effect on food security has been mixed. Some studies have found positive or no associations between SNAP and food insecurity,27–31
whereas others, including some with the strongest designs, have found that SNAP was associated with a decrease in food insecurity.23,32–39 Furthermore,
with few exceptions,2 nearly all
re-search examining the effects of SNAP on food security has focused on household food security (measured by using responses to questions about access limitations faced by adults and children in the household); little is known about how SNAP affects children’s food secu-rity (measured by using responses to questions about access limitations faced by children in the household).
In this article, we estimate the associ-ation between SNAP and children’s food security using statistical models that control for confounding demographic, economic, and household variables and by using recently collected, na-tionally representative data from al-most 3000 households. The data come from the SNAP Food Security (SNAPFS) survey, which was conducted by Mathematica Policy Research for the US Department of Agriculture Food and Nutrition Service from 2011 to 2012.
METHODS
Study Design
We sought to minimize selection bias by comparing extant SNAP households to new households that had just entered
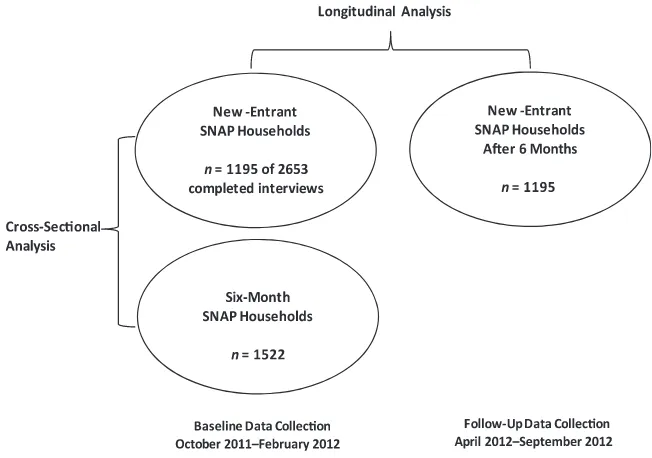
SNAP (new-entrant households). Thus, a major source of selection bias in pre-vious studies borne from comparing program participants to nonparticipants, many of which do not eventually even enter SNAP, was avoided in this study by interviewing new-entrant households and obtaining information from the month before entering SNAP. The analysis used a quasi-experimental research design that consisted of 2 sets of com-parisons. Thefirst design was a cross-sectional comparison group design composed of new-entrant households, defined as households that had been certified for SNAP in the 5 days before the sample date, and a group of participants who had been in the program for the previous 6 to 7 months (6-month households; Fig 1). We surveyed house-holds that had participated∼6 months, relative to other lengths of time, to allow enough time after program enrollment for households to adjust their food pur-chase behavior while avoiding sample loss due to program attrition. The second design was a longitudinal comparison of the new-entrant households at program entry and that same group of partic-ipants 6 or 7 months later. This second design minimizes the bias associated with self-selection that exists when comparing different households at a point in time (as in the cross-sectional design) but may introduce biases due to changes in external factors over time. By using both experimental designs, we sought to address the weaknesses in-herent in each to obtain the most definitive possible estimates of the association between SNAP participation and child food security. Additional details of the study design can be found in the survey report.40
includes a rich set of demographic, economic, and household character-istics described later in the article.
Data Collection
Data were collected by using computer-assisted telephone interviewing. The cross-sectional analysis compares 1195 new-entrant households with children to 1522 6-month households with children interviewed from October 2011 through February 2012. The longitudinal analysis compares the 1195 new-entrant house-holds at baseline with those same households 6 months later, from April to September 2012 (Fig 1). We restricted the sample of new-entrant households in the cross-sectional analysis to those that were still on the program 6 months later to increase comparability between new-entrant and 6-month households (the original sample size was 2653 new-entrant households at baseline).
To best measure the prevalence and characteristics of food-insecure house-holds as theyfirst entered the program, it was essential to interview new-entrant households as soon as possible after
SNAP certification, before the household had adjusted its food purchasing and consumption behaviors based on its SNAP allotment. The length of the base-linefield period was∼2 weeks for new-entrant households and 4 weeks for 6-month households. The length of the
field period for follow-up interviews with a new-entrant household 6 months later was ∼8 weeks. We obtained in-formed consent from all respondents.
Weighting
The study had a 2-stage sample design. First, we drew a sample of 30 states, by using probability-proportional-to-size sampling, with the number of SNAP households in each state as the mea-sure of size. Second, we drew samples of participant households from case-load files provided by participating states. We used sampling weights for all analyses to account for the 2-stage design and to adjust for the potential effects of differential nonresponse. The
findings in this article are based on weighted data and are nationally rep-resentative of new-entrant and 6-month
SNAP households at the time of the baseline interviews.
Measuring Child Food Security
We used the same 18-question instru-ment to measure food security that is used by the US Census Bureau in an annual food security supplement to the Current Population Survey, with ques-tions pertaining to a 30-day recall period (Table 1). Children’s food security was measured by using a scale based on the 8-item child module. The analysis used 2 outcome measures41: a binary indicator
of whether children in the household were food insecure based on$2 affi r-mative responses and a binary indicator of whether children in the household experienced very low food security based on$5 affirmative responses.
Statistical Analysis
We conducted multivariate logistic regression analysis to estimate the association between SNAP (6-month or new-entrant household) and children’s food security. The regression models included the following set of explana-tory variables (Table 2): gender, race, ethnicity, highest grade completed, employment status, and depression status of the household head42;
household income-to-poverty ratio (based on the sum of earned and un-earned income), size, and composition; age of the oldest child in the household; previous SNAP participation status; current participation in federal or state programs; changes in household size, housing status, employment, pay, or hours worked in the past 6 months (either job loss or gain and either in-crease or dein-crease in pay or hours worked); region of residence; state 25th percentile wage and state (nonsea-sonally adjusted) unemployment rate; and variables indicating whether the state offers broad-based categorical eligibility43to SNAP participants and the
average SNAP certification period.22
FIGURE 1
We performed sensitivity analyses to test whether thefindings are robust to deci-sions regarding functional form, variable inclusion, and sample restrictions. This includesfixed-effects estimation, which is designed to account for time-invariant differences across households. This can reduce the chances of having omitted variable bias caused by correlations be-tween an unobserved household factor that is constant over time and both SNAP participation and food security. It also included testing whether attrition bias might have affected the results by using the full set of new-entrant households rather than the restricted sample.
SEs were estimated by using a variance estimator based on afirst-order Taylor series approximation. We accounted for the complex survey design of the SNAPFS survey when estimating SEs by using Stata 12.1’s “svy” commands (Stata Corp, College Station, TX). All statistical tests were 2-sided.
RESULTS
Table 2 displays characteristics of the samples included in the analysis. In the
cross-sectional sample, compared with new-entrant households, 6-month house-holds were more likely to receive Temporary Assistance for Needy Fami-lies (TANF), to have conducted their in-terview in English, and to be employed and were less likely to be Hispanic, to report being depressed, and, in the past 6 months, to have experienced a change in household size, been evicted from their house/apartment, or experienced a change in employment, pay, or hours worked. Six-month households also had higher income (expressed as a percent-age of poverty) than did new-entrant households. Comparisons in the longi-tudinal sample were similar to those in the cross-sectional sample.
Table 3 provides basic data on the prev-alence of food insecurity, before any multivariate adjustments. The prevalence of food insecurity and very low food security was lower among 6-month households than among new-entrant households. In the cross-sectional sam-ple, the percentage of households in which children were food insecure was 37.2% for new-entrant households and
27.1% for 6-month households: a210.0 percentage point difference. Similarly, in the longitudinal sample, the percen-tages were 37.2% and 24.7%, respectively: a212.4 percentage point difference. The prevalence of very low food security was 6.7% among new-entrant households and was 4.0% and 4.7% among 6-month households in the cross-sectional and longitudinal samples, respectively.
Table 4 presents thefindings from the logistic regression analyses. Partici-pating in SNAP for 6 months was as-sociated with a lower likelihood of child food insecurity in both the cross-sectional and longitudinal analyses. The odds ratio (OR) of children experi-encing food insecurity was 0.64 in the cross-sectional sample; this indicates that after controlling for other possible confounders, children in households that had participated in SNAP for 6 months were 36% less likely to be food insecure (OR: 0.64; confidence interval [CI]: 0.52–0.77). In the longitudinal sample, children in 6-month house-holds were 38% less likely to be food insecure (OR: 0.62; CI: 0.52–0.73).
TABLE 1 Questions Used to Assess the Food Security of Households
1.“We worried whether our food would run out before we got money to buy more.”Was that often true, sometimes true, or never true for your household in the last 30 days?
2.“The food that we bought just didn’t last, and we didn’t have money to get more.”Was that often, sometimes, or never true for your household in the last 30 days? 3.“We couldn’t afford to eat balanced meals.”Was that often true, sometimes true, or never true for your household in the last 30 days?
4. In the last 30 days, did you or other adults in your household ever cut the size of your meals or skip meals because there wasn’t enough money for food? (Yes/No) 5. (If yes to Question 4) How many days did this happen in the last 30 days? Do you think it was more than 1 or 2 days?
6. In the last 30 days, did you ever eat less than you felt you should because there wasn’t enough money for food? (Yes/No) 7. In the last 30 days, were you ever hungry but didn’t eat because there wasn’t enough money for food? (Yes/No) 8. In the last 30 days, did you lose weight because there wasn’t enough money for food? (Yes/No)
9. In the last 30 days, did you or other adults in your household ever not eat for a whole day because there wasn’t enough money for food? (Yes/No) 10. (If yes to Question 9) How many times did this happen in the last 30 days? Do you think it was more than 1 or 2 days?
Questions 11–18 were asked only if the household included children age 0–17
11.“We relied on only a few kinds of low-cost food to feed our children because we were running out of money to buy food.”Was that often, sometimes, or never true for you in the last 30 days?
12.“We couldn’t feed our children a balanced meal, because we couldn’t afford that.”Was that often, sometimes, or never true for you in the last 30 days? 13.“The children were not eating enough because we just couldn’t afford enough food.”Was that often, sometimes, or never true for you in the last 30 days? 14. In the last 30 days, did you ever cut the size of any of the children’s meals because there wasn’t enough money for food? (Yes/No)
15. In the last 30 days, did any of the children ever skip a meal because there wasn’t enough money for food? (Yes/No) 16. (If yes to Question 15) How many days did this happen in the last 30 days? Do you think it was more than 1 or 2 days? 17. In the last 30 days, were the children ever hungry but you just couldn’t afford more food? (Yes/No)
18. In the last 30 days, did any of the children ever not eat for a whole day because there wasn’t enough money for food? (Yes/No)
TABLE 2 Descriptive Characteristics of New-Entrant and 6-Month Households With Children
Cross-Sectional Estimatesa Longitudinal Estimatesb
New-Entrant Households
6-Month Households
Pof Difference
New-Entrant Households
6-Month Households
Pof Difference
Household head is female, % 83.2 82.4 .66 83.2 83.0 .90
Race and ethnicity of household head, %
Non-Hispanic white 37.7 43.2 .06 37.7 36.8 .91
Non-Hispanic African American 24.8 24.6 — 24.8 24.8 —
Non-Hispanic other 6.3 7.7 — 6.3 6.1 —
Hispanic 34.7 29.1 — 34.7 35.6 —
Age of household head, %
18–24 23.8 23.5 .65 23.8 23.2 .62
25–49 66.8 68.3 — 66.8 68.3 —
50–64 8.2 7.1 — 8.2 7.4 —
$65 1.3 1.1 — 1.3 1.1 —
Mean age of oldest child 8.6 8.4 .99 8.6 8.2 .98
Highest grade completed, %
Less than high school 23.3 22.6 .75 23.3 24.0 .79
High school 29.9 28.9 — 29.9 29.9 —
Some college 38.8 41.5 — 38.8 39.0 —
College and beyond 8.0 7.0 — 8.0 7.1 —
Employment status of household head, %
Not employed 70.8 63.9 .008 70.8 64.5 ,.001
Employed full-time 9.4 10.4 — 9.4 9.6 —
Employed part-time 19.8 25.7 — 19.8 25.8 —
Household head felt depressed in past 30 d,c% 77.1 73.1 .03 77.1 66.3 ,.001
Interview conducted in English language, % 84.0 87.9 .07 84.0 83.8 .90
Mean monthly income as a percentage of the federal poverty level
63.0 71.7 .008 63.0 72.4 .003
Mean household size 3.5 3.6 .99 3.5 3.5 .99
Household contains children, % 100.0 100.0 — 100.0 100.0 —
Household contains elderly, % 3.7 3.6 .93 3.7 3.5 .82
Household contains disabled person, % 19.2 20.6 .38 19.2 14.1 .004
Participated in SNAP before current spell, % 56.2 53.8 .26 56.2 56.3 .97
Participation in federal or state programs, %
TANF 5.5 9.5 ,.001 5.5 8.9 .003
Welfare 2.2 2.9 .42 2.2 2.6 .65
SSI 6.6 6.9 .82 6.6 6.5 .88
Unemployment compensation 10.0 10.7 .64 10.0 10.7 .74
Experienced trigger events in past 6 months, %
Change in household size 25.1 17.5 ,.001 25.1 13.6 ,.001
Eviction 3.8 2.0 .03 3.8 2.7 .17
Change in employment, pay, or hours worked 44.2 32.7 ,.001 44.2 25.6 ,.001
Region of residence, %
Northeast 11.0 10.3 ,.001 11.0 11.0 .99
Mid-Atlantic 5.7 13.0 — 5.7 5.7 —
Midwest 22.3 13.6 — 22.3 22.3 —
Southeast 12.5 13.6 — 12.5 12.5 —
Southwest 5.7 6.3 — 5.7 5.7 —
Mountain Plains 12.1 17.1 — 12.1 12.1 —
Western 30.7 26.1 — 30.7 30.7 —
Mean state 25th percentile wage 10.8 10.8 .99 10.8 10.8 .99
Mean state unemployment rate 8.9 8.5 .99 8.9 8.9 .99
State offers BBCE,d
% 89.9 88.4 .85 89.9 89.8 .99
Mean state SNAP certification periode 12.1 12.2 .99 12.1 12.1 .99
Data were derived from SNAPFS Survey 2012. BBCE, broad-based categorical eligibility; SSI, Supplemental Security Income.
aThe cross-sectional estimates compare new SNAP participants with a contemporaneous set of participants who have received SNAP for∼6 months. Cross-sectional estimates are based on
a data set with 2717 households with children (1195 new-entrant households with children interviewed at both baseline and 6-month follow-up and 1522 6-month households with children interviewed at baseline). The original sample of new-entrant households with children was restricted to the 1195 households with children that also completed a follow-up interview 6 months later to improve the comparability between the new-entrant and 6-month households.
bThe longitudinal estimates compare new SNAP participants with the same participants∼6 months later. Longitudinal estimates are based on the 1195 new-entrant households with children
and a comparison of their circumstances at baseline and again at follow-up 6 months later. The original sample of new-entrant households with children was restricted to the 1195 households with children that also completed a follow-up interview 6 months later to improve the comparability between the new-entrant and 6-month households.
cBroad-based categorical eligibility refers to noncash TANF- or state maintenance of effort-funded benefits or services that confer categorical eligibility to virtually all households applying for SNAP. dDepression was measured by using the (Kessler) K6 screening scale.
eSNAP participants are required to periodically be recertified to continue to receive benefits. The certification period varies with the likelihood of a change in a SNAP household’sfinancial
The evidence was mixed regarding whether SNAP was associated with a decrease in child very low food se-curity (Table 4). In the cross-sectional analysis, children in households that had participated in SNAP for 6 months were 52% less likely to experience very low food security (OR: 0.48; CI: 0.20– 0.76). Although the association was also negative in the longitudinal anal-ysis, it was not statistically significant (OR: 0.85; CI: 0.49–1.21).
Mostfindings were qualitatively robust to different empirical specifications (Table 5). In the longitudinal analysis of food insecurity, for example, this in-cluded (1) using a more parsimonious set of explanatory variables (OR: 0.57; CI: 0.50–0.65), (2) using the full set of new-entrant households rather than the restricted sample of households (OR: 0.62; CI: 0.49–0.74), (3) including household fixed effects (OR: 0.63; CI: 0.55–0.70), and (4) clustering SEs at the household level (OR: 0.64; CI: 0.50–0.76). Thefindings were also robust for the cross-sectional analyses of food in-security and very low food in-security (Table 5). Unlike in the main specifi ca-tion, several of the sensitivity analyses for very low food security showed sta-tistically significant associations in the longitudinal analysis.
As an additional robustness check, we examined the sensitivity of thefindings to the amount of time between new-entrant households receiving SNAP benefits and the interview date. One objective in conducting the telephone survey with new entrants was to mini-mize the time from program entry to the baseline interview so that the food se-curity responses pertained to the time period before entry into SNAP. Our as-sumption was that the sooner after SNAP certification a household was interviewed, the less likely it would be that the household had adjusted its food purchasing and consumption behavior based on its SNAP allotment. Sixteen percent of new-entrant households were interviewed before receiving SNAP benefits, 13% within 5 days of receiving their SNAP benefits, 23% within 6 to 10 days, 24% within 11 to 15 days, 13% within 16 to 20 days, and 11% within at least 21 days. To examine the sensitivity of the findings to the amount of time since benefit receipt, we categorized new-entrant households into 2 groups based on whether the household had received benefits before the interview and re-estimated the models. The
findings were robust to when new-entrant households were interviewed relative to when they received their
SNAP benefit (Table 5). There was some tendency for the households inter-viewed before receiving benefits or within a short time of receiving benefits to have slightly stronger associations between SNAP and child food security. This was also true for very low food security in the longitudinal analysis.
We also examined whether large-benefit households experienced a larger im-provement in child food security than small-benefit households (Table 5). This was true only in the cross-sectional sample.
DISCUSSION
The results suggest that SNAP partici-pation is associated with a reduction in child food insecurity in the cross-sectional and longitudinal samples and a reduction in very low food se-curity in the cross-sectional sample. The association with very low food se-curity in the longitudinal sample was not statistically significant.
Considered from the perspective of the past literature, it is difficult to compare our estimates to those from other studies because, to the best of our knowledge, there are no multivariate analyses of the association between SNAP participation and child food security. There is a growing
TABLE 3 Descriptive Tabulation of Child Food Security Status in 6-Month and New-Entrant SNAP Households With Children
Cross-Sectional Tabulationsa Longitudinal Tabulationsb
Percentage of New-Entrant Households (Baseline)
Percentage of 6-Month Households
Difference Pof Difference
Percentage of New-Entrant Households (Baseline)
Percentage of New-Entrant Households (6-Mo Follow-Up)
Difference Pof Difference
Food Secure 62.9 72.9 10.0 ,.001 62.9 75.3 12.4 ,.001
Food Insecure 37.2 27.1 210.0 ,.001 37.2 24.7 212.4 ,.001
Food insecure with low food security
30.4 23.2 27.3 ,.001 30.4 20.0 210.4 ,.001
Food insecure with very low food security
6.7 4.0 22.8 .007 6.7 4.7 22.0 .02
Data were derived from SNAPFS Survey 2012.
aThe cross-sectional estimates compare new SNAP participants with a contemporaneous set of participants who have received SNAP for∼6 months. Cross-sectional estimates are based on
a data set with 2717 households with children (1195 new-entrant households with children interviewed at both baseline and 6-month follow-up and 1522 6-month households with children interviewed at baseline). The original sample of new-entrant households with children was restricted to the 1195 households with children that also completed a follow-up interview 6 months later to improve the comparability between the new-entrant and 6-month households.
bThe longitudinal estimates compare new SNAP participants with the same participants∼6 months later. Longitudinal estimates are based on the 1195 new-entrant households with children
body of literature on the effects of SNAP on household food security, however. As reviewed earlier, parts of the past literature have failed to find an association, or even found positive associations between SNAP and food insecurity.27–31 Compared with these
studies, our analysis suggests that SNAP is associated with substantial improve-ments in food security for children. Several studies also have found that SNAP is associated with reductions in household food insecurity, which con-curs with thefindings in this study for child food security.23,32–39
SNAP reduces child food insecurity by providing benefits to low-income households to purchase food. The aver-age monthly benefit for households with children was $413 in 2011.22 Receiving
the benefit has been shown to be only part of the pathway through which SNAP reduces food insecurity. Recent qualita-tive research has shown that SNAP households that are food secure, com-pared with those that are food insecure, are more likely to rely on family net-works forfinancial help and meal pro-vision, shop at multiple stores to obtain the lowest prices, and only buy certain foods such as meat when it is on sale.44
The main policy implication of the current study is that SNAP plays a vital role in the overall low-income safety net. Ensuring that benefits remain robust and that SNAP public outreach efforts continue are of great importance. From a clinical perspective, it is important that pediatric practices and other public and private agencies be alert to signs of food insecurity among the children they serve and provide in-formation to low-income families about how to apply for SNAP.
There are several limitations of the study design. By comparing 6-month participants with those that just entered SNAP, our evaluation design reduces the extent of selection bias present when comparing participants with non-participants. However, measuring child food security immediately before SNAP entry may capture households’ lowest point, typically measured over a year, in terms of economic resources (often referred to as Ashenfelter’s dip or the preprogram dip).45,46 If some of these
households rebound quickly, then we may be overestimating the association between SNAP and improved child food security. We addressed this, at least in part, by including measures of changes
over time in employment, income, housing, and household size and com-position, even in the cross-sectional analysis, using variables that ask about changes in these measures over the past 6 months. Furthermore, by focusing on households that have par-ticipated in SNAP for 6 months, the design inherently excludes children in households that rebounded quickly from the pre-SNAP “dip” in economic circumstances and exited SNAP only a few months after entering.
Another limitation is the potential bias from not interviewing all new-entrant households before they received their
first benefit allotment. However, al-though the magnitudes of the associa-tions differed depending on whether households received SNAP benefits, the overallfinding that SNAP is associated with an improvement in children’s food insecurity was robust to when house-holds received benefits in relation to the interview date.
A third limitation of the design is the remaining possibility of selection bias. We have sought to address this issue by using a carefully developed nonrandom design that seeks to control for ob-servable differences between SNAP new entrants and ongoing participants. However, there remains some risk that observed associations of variables could be due to differences across households that are not observable. To address this, we estimated an alternative model based on household fixed effects. Our
findings were robust to the inclusion of
fixed effects. Future research may be able to identify and control for other differences between new-entrant and extant SNAP households through ran-dom assignment, using a richer set of explanatory variables in the model, such as information about household coping strategies related to food purchasing, and conducting interviews of SNAP leavers to learn why they left and how their food security changed.
TABLE 4 Associations Between Child Food Insecurity or Child Very Low Food Security and Participating in SNAP for 6 Months
Cross-Sectional Estimatesa
Longitudinal Estimatesb
ORc 95% CI P ORc 95% CI P
Food insecurity 0.64 (0.52–0.77) ,.001 0.62 (0.52–0.73) ,.001
Very low food security 0.48 (0.20–0.76) ,.001 0.85 (0.49–1.21) .41
Data were derived from SNAPFS Survey 2012.
aThe cross-sectional estimates compare new SNAP participants with a contemporaneous set of participants who have
received SNAP for∼6 months. Cross-sectional estimates are based on a data set with 2717 households with children (1195 new-entrant households with children interviewed at both baseline and 6-month follow-up and 1522 6-month households with children interviewed at baseline). The original sample of new-entrant households with children was restricted to the 1195 households with children that also completed a follow-up interview 6 months later to improve the comparability between the new-entrant and 6-month households.
bThe longitudinal estimates compare new SNAP participants with the same participants∼6 months later. Longitudinal
estimates are based on the 1195 new-entrant households with children and a comparison of their circumstances at baseline and again at follow-up 6 months later. The original sample of new-entrant households with children was restricted to the 1195 households with children that also completed a follow-up interview 6 months later to improve the comparability between the new-entrant and 6-month households.
dThe ORs are adjusted for gender, race, ethnicity, highest grade completed, employment status, and depression status of the
CONCLUSIONS
With its large sample size, carefully structured quasi-experimental research design, and robust and statistically significantfindings, this study provides convincing evidence of the association between SNAP and improved child food
security and the best estimate to date of the extent of the improvement. Given the
growing body of research establishing associations between children’s health and development and food security, this study’sfindings underscore the impor-tance of SNAP in affecting children’s
current circumstances and future well-being.
Future studies should evaluate whether certain groups of children experience larger improvements in food security compared with other groups of chil-dren, to help policy makers identify the
TABLE 5 Associations Between Child Food Insecurity or Child Very Low Food Insecurity and Participating in SNAP for 6 Months, by Alternative Model Specifications, Number of Days Since SNAP Benefit Receipt for New-Entrant Households, and SNAP Benefit Amount
Cross-Sectional Estimatesa,b Longitudinal Estimatesb,c
OR 95% CI P OR 95% CI P
Food insecurity
Main specification 0.64 0.52–0.77 ,.001 0.62 0.52–0.73 ,.001
Alternative model specification or sample Smaller set of explanatory variablesd
0.60 0.50–0.70 ,.001 0.57 0.50–0.65 ,.001
Unrestricted sample that includes all new-entrant households
0.68 0.54–0.82 ,.001 0.62 0.49–0.74 ,.001
Fixed effects included in the longitudinal analysis — — — 0.63 0.55–0.70 ,.001
SEs clustered at household level — — — 0.64 0.50–0.76 ,.001
Time since benefit subsamplese
New-entrant households that had not received benefits before interview
0.59 0.33–0.85 .002 0.53 0.27–0.79 ,.001
New-entrant households that had received benefits before interview
0.65 0.52–0.78 ,.001 0.64 0.53–0.75 ,.001
SNAP benefit amount as percentage of the maximum SNAP benefitf
Small 0.83 0.65–1.00 .05 0.60 0.46–0.74 ,.001
Large 0.50 0.34–0.67 ,.001 0.62 0.45–0.80 ,.001
Very low food security
Main specification 0.48 0.20–0.76 ,.001 0.85 0.49–1.21 .41
Alternative model specification or sample Smaller set of explanatory variablesd
0.49 0.26–0.72 ,.001 0.73 0.44–1.02 .07
Unrestricted sample that includes all new-entrant households
0.51 0.31–0.72 ,.001 0.77 0.50–1.04 .09
Fixed effects included in the longitudinal analysis — — — 0.78 0.50–1.06 .13
SEs clustered at household level — — — 0.84 0.51–1.17 .33
Time since benefit subsamplese
New-entrant households that had not received benefits before interview
0.40 0.12–0.68 ,.001 0.52 0.16–0.87 .008
New-entrant households that had received benefits before interview
0.49 0.19–0.78 ,.001 0.88 0.51–1.25 .52
SNAP benefit amount as percentage of the maximum SNAP benefitf
Small 0.60 0.21–0.99 .04 0.90 0.42–1.37 .67
Large 0.20 –0.02 to 0.41 ,.001 0.83 0.09–1.56 .64
Data were derived from SNAPFS Survey 2012.
aThe cross-sectional estimates compare new SNAP participants with a contemporaneous set of participants who have received SNAP for∼6 months. Cross-sectional estimates are based on
a data set with 2717 households with children (1195 new-entrant households with children interviewed at both baseline and 6-month follow-up and 1522 6-month households with children interviewed at baseline). The original sample of new-entrant households with children was restricted to the 1195 households with children that also completed a follow-up interview 6 months later to improve the comparability between the new-entrant and 6-month households.
bThe ORs are adjusted for: gender, race, ethnicity, highest grade completed, employment status, and depression status of the household head; household income-to-poverty ratio, size, and
composition; age of the oldest child in the household; previous SNAP participation status; current participation in federal or state programs; changes in household size, housing status, employment, pay, or hours worked; region of residence; state 25th percentile wage and state (nonseasonally adjusted) unemployment rate; and variables indicating whether the state offers broad-based categorical eligibility to SNAP participants and the average SNAP certification period.
cThe longitudinal estimates compare new SNAP participants with the same participants∼6 months later. Longitudinal estimates are based on the 1195 new-entrant households with children
and a comparison of their circumstances at baseline and again at follow-up 6 months later. The original sample of new-entrant households with children was restricted to the 1195 households with children that also completed a follow-up interview 6 months later to improve the comparability between the new-entrant and 6-month households.
dThe set of explanatory variables was limited to household size, composition, and income; region of residence; interview conducted in English; and previous SNAP participation. eAll samples use the original set of 6-month households. Only the sample of new-entrant households is restricted by days since benefit receipt.
fWe computed the SNAP benefit for each household as a percentage of the maximum benefit (by household size) and divided the households into 2 equally sized groups. Small and large benefit
most effective pathways through which SNAP affects child food security. Given that SNAP was associated with a re-duction in, but not elimination of, food insecurity, additional research is also needed to identify the factors as-sociated with child food insecurity among SNAP participants. In particular, there is value in examining how low-income households make their food purchase decisions, to determine the roles that SNAP benefits play in this process.44 This includes obtaining
more information on fluctuations in household expenses and income to understand how SNAP households reallocate scarce resources to meet obligations such as rent, utilities, transportation, and other basic needs; exploring family networks as a food coping strategy, including how non-standard work arrangements and household structure affect food in-security47; and understanding how
household food purchase decisions re-late to food security. Given that TANF
participation increased after 6 months of participation in SNAP, examining how participation in multiple pro-grams affects child food insecurity is useful. Finally, the mixed evidence of a reduction in child very low food se-curity warrants additional research on whether SNAP is in fact reaching those most in need and, given the re-cent work examining the adequacy of SNAP benefit allotments,48 whether
allotments are sufficient to meet households’needs.
REFERENCES
1. Coleman-Jensen A, Nord M, Andrews M, Carlson S. Household food security in the United States in 2011 (Economic Research Report Number 141). Alexandria, VA: United States Department of Agriculture Economic Research Service, September 2013. Avail-able at: http://www.ers.usda.gov/media/ 884525/err141.pdf. Accessed February 1, 2013
2. Nord M.Food Insecurity in Households With Children (Economic Information Bulletin Number 56). Alexandria, VA: US Department of Agriculture Economic Research Service; September 2009
3. Eisenmann JC, Gundersen C, Lohman BJ, Garasky S, Stewart SD. Is food insecurity related to overweight and obesity in chil-dren and adolescents? A summary of studies, 1995–2009. Obes Rev. 2011;12(5): e73–e83
4. Ryu JH, Bartfeld JS. Household food in-security during childhood and subsequent health status: the early childhood longitu-dinal study—kindergarten cohort. Am J Public Health. 2012;102(11):e50–e55 5. Rose-Jacobs R, Black MM, Casey PH, et al.
Household food insecurity: associations
with at-risk infant and toddler development.
Pediatrics. 2008;121(1):65–72
6. Bronte-Tinkew J, Zaslow M, Capps R, Horowitz A, McNamara M. Food insecurity works through depression, parenting, and infant feeding to influence overweight and
health in toddlers. J Nutr. 2007;137(9): 2160–2165
7. Cook JT, Frank DA, Levenson SM, et al. Child food insecurity increases risks posed by
household food insecurity to young children’s health.J Nutr. 2006;136(4):1073–1076
8. Cook JT, Frank DA, Berkowitz C, et al. Food insecurity is associated with adverse health outcomes among human infants and tod-dlers.J Nutr. 2004;134(6):1432–1438 9. Alaimo K, Olson CM, Frongillo EA Jr, Briefel RR.
Food insufficiency, family income, and health in US preschool and school-aged children.Am J Public Health. 2001;91(5):781–786 10. Eicher-Miller HA, Mason AC, Weaver CM,
McCabe GP, Boushey CJ. Food insecurity is associated with iron deficiency anemia in US adolescents.Am J Clin Nutr. 2009;90(5): 1358–1371
11. Skalicky A, Meyers AF, Adams WG, Yang Z, Cook JT, Frank DA. Child food insecurity and iron deficiency anemia in low-income infants and toddlers in the United States.
Matern Child Health J. 2006;10(2):177–185 12. Casey P, Goolsby S, Berkowitz C, et al;
Children’s Sentinel Nutritional Assessment Program Study Group. Maternal de-pression, changing public assistance, food security, and child health status.Pediatrics. 2004;113(2):298–304
13. Jyoti DF, Frongillo EA, Jones SJ. Food in-security affects school children’s academic performance, weight gain, and social skills.
J Nutr. 2005;135(12):2831–2839
14. Winicki J, Jemison K. Food insecurity and hunger in the kindergarten classroom: its effect on learning and growth. Contemp Econ Policy. 2003;21(2):145–157
15. Alaimo K, Olson CM, Frongillo EA Jr. Food insufficiency and American school-aged children’s cognitive, academic, and psy-chosocial development. Pediatrics. 2001; 108(1):44–53
16. Slopen N, Fitzmaurice G, Williams DR, Gilman SE. Poverty, food insecurity, and the
behavior for childhood internalizing and externalizing disorders. J Am Acad Child Adolesc Psychiatry. 2010;49(5):444–452 17. Melchior M, Caspi A, Howard LM, et al.
Mental health context of food insecurity: a representative cohort of families with young children. Pediatrics. 2009;124(4). Available at: www.pediatrics.org/cgi/con-tent/full/124/4/e564
18. Weinreb L, Wehler C, Perloff J, et al. Hunger: its impact on children’s health and mental health.Pediatrics. 2002;110(4). Available at: www.pediatrics.org/cgi/content/full/110/4/ e41
19. Whitaker RC, Phillips SM, Orzol SM. Food insecurity and the risks of depression and anxiety in mothers and behavior problems in their preschool-aged children. Pediat-rics. 2006;118(3). Available at: www.pediat-rics.org/cgi/content/full/118/3/e859
20. Fram MS, Frongillo EA, Jones SJ, et al. Children are aware of food insecurity and take responsibility for managing food resources.J Nutr. 2011;141(6):1114–1119 21. Food & Nutrition Service, US Department of
Agriculture. Supplemental Nutrition Assistance Program participation and costs. Available at: http://www.fns.usda.gov/pd/SNAPsummary. htm. Accessed February 19, 2013
22. Strayer M, Eslami E, Leftin J. Character-istics of Supplemental Nutrition Assistance Program Households: Fiscal Year 2011. Alexandria, VA: US Department of Agricul-ture Food and Nutrition Service, Office of Research and Analysis; 2012
of Agriculture Economic Research Service; October 2009
24. Wilde PE. Measuring the effect of food stamps on food insecurity and hunger: research and policy considerations.J Nutr. 2007;137(2):307–310
25. Burstein N, Hamilton W, Fox MK, Price C, Battaglia M. Assessing the Food Security and Diet Quality Impacts of FNS Program Participation: Final Menu of Survey Options. Cambridge, MA: Abt Associates, Inc; 2005
26. Fox MK, Hamilton W, Lin B. Effects of food assistance and nutrition programs on nu-trition and health. Vol. 3. Literature review (Food Assistance and Nutrition research report Number 19-3). Alexandria, VA: US Department of Agriculture Economic Re-search Service; 2004. Available at: http:// www.ers.usda.gov/publications/fanrr19-3. Accessed May 1, 2013
27. Gibson-Davis C, Foster EM. A cautionary tale: using propensity scores to estimate the effect of food stamps on food in-security.Soc Serv Rev. 2006;80(1):93–126 28. Ribar DC, Hamrick KS. Dynamics of Poverty
and Food Sufficiency(research report no. 36). Washington, DC: US Department of Agriculture Food and Nutrition Service; 2003
29. Gundersen C, Oliveira V. The Food Stamp Program and food insufficiency.Am J Agric Econ. 2001;83(4):875–887
30. Huffman SK, Jensen HH. Food assistance programs and outcomes in the context of welfare reform.Soc Sci Q. 2008;89:95–115 31. Wilde P, Nord M. The effect of food stamps
on food security: a panel data approach.
Rev Agricultural Econ.2005;27:425–432 32. Bartfeld J, Dunifon R. State-level predictors
of food insecurity among households with children.J Policy Anal Manage. 2006;25(4): 921–942
33. Borjas GJ. Food insecurity and public as-sistance. J Public Econ. 2004;88(2004): 1421–1443
34. Yen ST, Andrews M, Chen Z, Eastwood DB. Food Stamp Program participation and food insecurity: an instrumental variables approach.Am J Agric Econ. 2008;90(1):117– 132
35. DePolt RA, Moffitt RA, Ribar DC. Food stamps, Temporary Assistance for Needy Families and food hardships in three American cities.Pac Econ Rev. 2009;14(4): 445–473
36. Ratcliffe C, McKernan S, Zhang S. How much does the Supplemental Nutrition Assistance Program reduce food insecurity? Am J Agric Econ. 2011;93:1082–1098
37. Mykerezi E, Mills B. The impact of Food Stamp Program participation on household food insecurity.Am J Agric Econ. 2010;92 (5):1379–1391
38. Nord M. How much does the Supplemental Nutrition Assistance Program alleviate food insecurity? Evidence from recent pro-gramme leavers.Public Health Nutr. 2012; 15(5):811–817
39. Kreider B, Pepper J, Gundersen C, Jolliffe D. Identifying the effects of SNAP (food stamps) on child health outcomes when participation is endogenous and mis-reported.J Am Stat Assoc. 2012;107(499): 958–975
40. Mabli J, Ohls J, Dragoset L, Castner L, Santos B. Measuring the effect of Supple-mental Nutrition Assistance Program (SNAP) participation on food security. Prepared by Mathematica Policy Research for the US De-partment of Agriculture, Food and Nutrition Service, August 2013. Available at: http:// www.mathematica-mpr.com/publications/ pdfs/Nutrition/SNAP_food_security_ES.pdf. Accessed August 20, 2013
41. Nord M, Bickel G. Measuring Children’s Food Security in US Households, 1995–99
(Food Assistance and Nutrition research report number 25). Washington, DC: US Department of Agriculture Economic Re-search Service; 2002
42. Kessler RC, Green JG, Gruber MJ, et al. Screening for serious mental illness in the general population with the K6 screening scale: results from the WHO World Mental Health (WMH) survey initiative.Int J Meth-ods Psychiatr Res. 2010;19(suppl 1):4–22 43. Trippe C, Gillooly J. Noncash Categorical
Eligibility for SNAP: State Policies and the Number and Characteristics of SNAP Households Categorically Eligible Through Those Policies (final report submitted to the US Department of Agriculture Food and Nutrition Service). Washington, DC: Mathe-matica Policy Research; July 2010
44. Edin K, Boyd M, Mabli J, et al.SNAP Food Security In-Depth Interview Study. Alexandria, VA: Food and Nutrition Service, US Department of Agriculture, FNS; 2013
45. Ashenfelter O. Estimating the effect of training programs on earnings. Rev Econ Stat. 1978;60(1):47–57
46. Heckman J, LaLonde R, Smith J. The eco-nomics and econometrics of active labor market programs. In: Ashenfelter O, Card D, eds.Handbook of Labor Economics. Vol. 3A. Amsterdam, Netherlands: North-Holland; 1999:1865–2097
47. Coleman-Jensen A. Working for peanuts: nonstandard work and food insecurity across household structure. J Fam Econ Issues. 2011;32(1):84–97
DOI: 10.1542/peds.2013-2823 originally published online March 3, 2014;
2014;133;610
Pediatrics
James Mabli and Julie Worthington
Security
Supplemental Nutrition Assistance Program Participation and Child Food
Services
Updated Information &
http://pediatrics.aappublications.org/content/133/4/610 including high resolution figures, can be found at:
References
http://pediatrics.aappublications.org/content/133/4/610#BIBL This article cites 33 articles, 13 of which you can access for free at:
Subspecialty Collections
http://www.aappublications.org/cgi/collection/public_health_sub Public Health
g_sub
http://www.aappublications.org/cgi/collection/child_health_financin Child Health Financing
http://www.aappublications.org/cgi/collection/advocacy_sub Advocacy
following collection(s):
This article, along with others on similar topics, appears in the
Permissions & Licensing
http://www.aappublications.org/site/misc/Permissions.xhtml in its entirety can be found online at:
Information about reproducing this article in parts (figures, tables) or
Reprints
DOI: 10.1542/peds.2013-2823 originally published online March 3, 2014;
2014;133;610
Pediatrics
James Mabli and Julie Worthington
http://pediatrics.aappublications.org/content/133/4/610
located on the World Wide Web at:
The online version of this article, along with updated information and services, is
by the American Academy of Pediatrics. All rights reserved. Print ISSN: 1073-0397.