University of Pennsylvania
ScholarlyCommons
Publicly Accessible Penn Dissertations
Fall 11-17-2009
Advances in Supramolecular and Macromolecular
Chemistry Through the Development of New
Synthetic Methodologies
Brad Matthew Rosen
University of pennsylvania, [email protected]
Follow this and additional works at:http://repository.upenn.edu/edissertations
Part of theMaterials Chemistry Commons,Organic Chemistry Commons, and thePolymer Chemistry Commons
Recommended Citation
Rosen, Brad Matthew, "Advances in Supramolecular and Macromolecular Chemistry Through the Development of New Synthetic Methodologies" (2009).Publicly Accessible Penn Dissertations. 248.
Advances in Supramolecular and Macromolecular Chemistry Through
the Development of New Synthetic Methodologies
Abstract
Development of complex supramolecular and macromolecular systems is driven by the development of new enabling synthetic methodologies. The demands placed upon specific chemical transformations are amplified for dendritic systems prepared via iterative synthesis. Three synthetic methods, Ni-catalyzed
neopentylglycolborylation, Single-Electron Transfer Living Radical Polymerization, and “Thio-Bromo Click” Chemistry are elaborated and utilized in the synthesis of new covalent and supramolecular dendrimers and dendritic macromolecules.
Sequential nickel catalyzed neopentylglycolborylation and cross-coupling of aryl halides is pioneered and harnessed as a tool for the synthesis of a new class of self-assembling dendron, biphenylpropyl ether dendrons. Through the synthesis of generational libraries of biphenylpropyl ether dendrons, new modes of self-assembly are discovered, including the first example of self-organizable vesicular spheres, which represent the largest reported spherical supramolecular dendrimers with MW of 1.7 x 10⁶ g/mol. More importantly, comparison of all libraries of self-assembling dendrons with that of the biphenylpropyl ether dendrons, reveal
predictability in their self-assembly and allow for the construction of a ‘nano-periodic’ table of dendrons. This predictability, while useful for rational design of new self-assembled systems, limits the likelihood of
discovering new modes of self-assembly via library synthesis using existing design strategies. A new design strategy, the “Deconstruction Approach”, where a dendritic topology is systematically stripped of its branches, is developed and applied to biphenylpropyl ether dendrons. This first library of “Deconstructed”
biphenylpropyl ether dendrons demonstrates the power of the strategy to uncover a multitude of new architectures hidden in previously unexplored dendron topologies.
In addition to self-assembling dendrons, dendritic macromolecules possess their own unique synthetic challenges derived from the merging of organic iterative synthesis and polymerization. The mechanism of a new robust polymerization technique, Single-Electron Transfer Living Radical Polymerization (SET-LRP) is elaborated. “Thio-Bromo Click” chemistry is developed as a new tool for the construction of poly(thio-propionoate (PTP) dendrimers. Through the combination of SET-LRP “Thio-Bromo Click” chemistry, an expeditious three-step “Branch and Grow” strategy for the synthesis of dendritic macromolecules is possible.
Degree Type Dissertation
Degree Name
Doctor of Philosophy (PhD)
Graduate Group Chemistry
Keywords
Self-assembly, Dendrimers, Dendrons, SET-LRP, Click-Chemistry, Dendritic Macromolecules
Subject Categories
ADVANCES IN SUPRAMOLECULAR AND MACROMOLECULAR CHEMISTRY
THROUGH THE DEVELOPMENT OF NEW SYNTHETIC METHODOLOGIES
COPYRIGHT
2009
Dedicated in loving memory of my Zayda,
iv
ACKNOWLEDGEMENTS
Even a doctoral dissertation in “self-assembly” does not come together on its own,
and its ultimate existence is the consequence of the dedication of many contributors. To
all of them I owe my deepest gratitude.
Though I started my doctoral research in 2005, I first met Professor Virgil Percec
when I was a high school student looking for a summer research position. Only a minute
had elapsed from the time I e-mailed him my résumé until I received a reply asking me to
go to his lab for a meeting. While showing me around the department, we ran into
Professor Winkler in the 4th Floor Vagelos hallway, and I was introduced simply and as it
turns out correctly as a “Future Macromolecular Chemist.” Since that first meeting with
Professor Percec, I can count few people who have been as stalwart in their support of
my professional aspirations and none who have more profoundly shaped my growth as a
scientist. Under Professor Percec’s guidance, I have truly experienced a
multi-disciplinary training that blended synthetic organic chemistry, polymer chemistry, and
molecular self-assembly. His instruction and insight over the years have been of
tremendous value to me.
Research is a team effort and my graduate work was definitely no exception. In
fact I have a number of teams to thank for their contributions: the Nickel Team (Dr.
Daniela A. Wilson, Dr. Christopher J. Wilson, Chenghong Huang, Dr. Costel
Moldoveanau, Pat Corcoran, Lisa Hoang), the Biphenylpropyl Team (Dr. Daniela A.
Wilson, Dr. Christopher J. Wislon, Dr. Mihai Peterca, Betty C. Won, Chenghong Huang,
Prof. Paul A. Heiney), the “Deconstruction Team” (Dr. Mihai Peterca, Chenghong Huang,
Prof. Xiangbing Zeng (Sheffield), and Prof. Goran Ungar (Sheffield)), the Dipeptide
Team (Dr. Kentaro Morimitsu and Dr. Andres Dulcey), the SET-LRP Team (Dr. Gerard
Lligadas, Prof. Michael Monteiro (Sheffield), Nga Nguyen, Dr. Xuan Jiang, Dr. Sven
Fleischman, Dr. Christopher J. Wilson, Dr. Janine Ladislaw, Dr. Monika Sienkowska,
and Dr. Tamaz Guliashivili), Takanori Hatano, Craig A. Bell (AIBN), and Christian
Hahn), the Thiol Team (Dr. Gerard Lligadas, Christian Hahn, and Dr. Andrew Hughes),
and the Chem. Rev. Team (Dr. Christopher J. Wilson, Dr. Daniela A. Wilson, Dr. Mihai
Peterca, and Dr. Mohammad R. Imam). On a related note, I am grateful for the guidance
and support from my dissertation committee: Professor Gary Molander (Chair), Prof.
Ivan Dmochowski, and Professor Jeffrey Winkler.
The study of supramolecular and macromolecular systems draws upon techniques
from many disciplines. I am appreciative of NMR (Dr. George Furst) and XRD (Prof.
Paul A. Heiney) training Special thanks to Dr. Mihai Peterca for performing XRD
experiments and simulations and to Prof. Xiangbing Zeng and Prof. Goran Ungar for
their work in identifying some of our more elusive structures. Thanks also to Dr. Rakesh
Kohli for Mass-spec training and for many high-res analyses and to Dr. Stephen Cheng
(Akron) for density measurements. I must also thank my previous mentor Prof. Andrew
Myers (Harvard) and Dr. Nan Ji (Harvard) for training me in the art of organic synthesis.
Thanks also to everyone else who has helped along the way of the graduate thesis
vi Dr. Geoff Golding, Dr. Mark Ilies, Dr. Monica Ilies, and Kla Pawaret). I am grateful of
the opportunity I was given to mentor extremely talent undergraduate (Chenghong Huang,
Kim Le, Ritwick Grover, and Lisa Hoang) and high school students (Linda Lipski,
Benjamin Rosen Naomi Staley). Special recognition is due to Chenghong Huang who I
enjoyed working with for three years; I expect great things from his graduate career at
Harvard.
I am also extremely grateful for the financial support I have enjoyed through a
National Science Foundation – Graduate Research Fellowship (NSF-GRFP) from
2005-2008, an American Chemical Society Division of Organic Chemistry – Graduate
Research Fellowship (ACS-DOC) presented by Roche from 2008-2009, and a first-year
graduate fellowship from Rohm and Haas from 2005-2006, and University of
Pennsylvania School of Arts and Science Dissertation Completion Fellowship for 2009.
Of course, none of this would be possible without the opportunities and support of
my parents Ronald and Lynne Rosen. Their tireless pursuit of my academic enrichment
provided me the foundation upon which everything else has been based. Thanks also to
Ms. Alice Davis, my legendary high-school chemistry teacher who instigated my thirst
for chemical education. Last but not least, I am grateful to my wife Alanna for always
Abstract
ADVANCES IN SUPRAMOLECULAR AND MACROMOLECULAR
CHEMISTRY THROUGH THE DEVELOPMENT OF NEW SYNTHETIC
METHODOLOGIES
Brad M. Rosen
Virgil Percec
Development of complex supramolecular and macromolecular systems is driven
by the development of new enabling synthetic methodologies. The demands placed upon
specific chemical transformations are amplified for dendritic systems prepared via
iterative synthesis. Three synthetic methods, Ni-catalyzed neopentylglycolborylation,
Single-Electron Transfer Living Radical Polymerization, and “Thio-Bromo Click”
Chemistry are elaborated and utilized in the synthesis of new covalent and
supramolecular dendrimers and dendritic macromolecules.
Sequential nickel catalyzed neopentylglycolborylation and cross-coupling of aryl
halides is pioneered and harnessed as a tool for the synthesis of a new class of
self-assembling dendron, biphenylpropyl ether dendrons. Through the synthesis of
generational libraries of biphenylpropyl ether dendrons, new modes of self-assembly are
discovered, including the first example of self-organizable vesicular spheres, which
viii g/mol. More importantly, comparison of all libraries of self-assembling dendrons with
that of the biphenylpropyl ether dendrons, reveal predictability in their self-assembly and
allow for the construction of a ‘nano-periodic’ table of dendrons. This predictability,
while useful for rational design of new self-assembled systems, limits the likelihood of
discovering new modes of self-assembly via library synthesis using existing design
strategies. A new design strategy, the “Deconstruction Approach”, where a dendritic
topology is systematically stripped of its branches, is developed and applied to
biphenylpropyl ether dendrons. This first library of “Deconstructed” biphenylpropyl ether
dendrons demonstrates the power of the strategy to uncover a multitude of new
architectures hidden in previously unexplored dendron topologies.
In addition to self-assembling dendrons, dendritic macromolecules possess their
own unique synthetic challenges derived from the merging of organic iterative synthesis
and polymerization. The mechanism of a new robust polymerization technique,
Single-Electron Transfer Living Radical Polymerization (SET-LRP) is elaborated. “Thio-Bromo
Click” chemistry is developed as a new tool for the construction of poly(thio-propionoate
(PTP) dendrimers. Through the combination of SET-LRP “Thio-Bromo Click” chemistry,
an expeditious three-step “Branch and Grow” strategy for the synthesis of dendritic
Table of Contents
Dedication ... iii
Acknowledgements ... iv
Abstract ... vii
Table of Contents ... ix
List of Tables ... xvii
List of Figures ... xxi
List of Schemes ... xxxviii
1 – General Introduction ...1
2 –Introduction to Dendrons and Dendrimers ...5
2.1 General Background and Definitions ...2
2.1 Synthesis of Percec-Type Dendrons ...6
2.2 Self-Assembling Dendrons and Dendrimers ...14
2.2.1 Overview and Historical Background ...14
2.3 Structural and Retrostructural Analysis of Supramolecular Dendrimers. From 2D to 3D Lattices ...21
2.4 Molecular Shape Control Through Dendron Branching Structure ...46
2.5 The Generational Library Approach to Discovery ...53
2.6 Helical Porous Columnar and Spherical Self-Assembly via the Dipeptides from the Apex of Dendritic Dipeptides ...75
2.7 Fluorous Phase or Fluorophobic Effect in Self-Assembly ...53
2.8 References ...53
3–Ni-Catalyzed Borylation and Cross-Coupling of Aryl Halides via in-situ Prepared Neopentylglycolborane as a Tool for Dendron Synthesis ...96
3.1 Introduction ...96
3.2 Results and Discussion ...98
3.2.1 Initial Investigations on Ni-Catalyzed Pinacolborylation ...98
3.2.2 Development and Optimization of Ni-Catalyzed Neopentylglycolborylation ..98
x
3.3 Continued and Future Work ...109
3.3.1 Two- Step, One-Pot Ni-Catalyzed Neopentylglycolborylation and Complementary Pd/Ni-Catalyzed Cross-Coupling with Aryl Halides, Mesylates, and Tosylates ...107
3.3.2 Neopentylglycolborylation of Aryl Chlorides Catalyzed by the Mixed Ligand System NiCl2(dppp)/dppf ...111
3.3.3 Neopentylglycolborylation of Ortho-Substituted Aryl Halides and Neopentylglycolborylation of Aryl Mesylates and Tosylates ...114
3.3.4 Mechanistic Perspectives ...114
3.4 Conclusions ...116
3.5 Experimental Section ...117
3.5.1 Materials ...117
3.5.2 Techniques ...117
3.5.4 Instrumentation ...118
3.5.5 Experimental Procedures and Characterizations ...119
3.6 References ...138
4–Predicting the Structure of Supramolecular Dendrimers via the Analysis of Libraries of AB3 and Constitutional Isomeric AB2 Biphenylpropyl Ether Self- Assembling Dendrons ...141
4.1 Introduction ...141
4.2 Results and Discussion ...144
4.2.1 The Modular Synthesis of Dendritic Building Blocks ...144
4.2.2 Synthesis of First-Generation Dendrons ...151
4.2.3 Synthesis of Higher-Generation Dendrons ...152
4.2.4 Structural and Retrostructual Analysis ...155
4.2.5 Structural and Retrostructural Analysis of the AB3 Library of Supramolecular Dendrimers. ...157
4.2.6 Structural and Retrostructural Analysis of the 3,4-Disubstituted Library of AB2 Supramolecular Dendrimers. ...162
4.2.7 Structural and Retrostructural Analysis of the 3,5-Disubstituted Library of AB2 Supramolecular Dendrimers ...167
4.2.9 Dimensions and Mechanism of Self-Assembly into Spherical Supramolecular
Dendrimers is Determined through Branching Pattern. ...173
4.2.10 Ultrahigh Molecular Weight Supramolecular Spheres via an Unprecedented Interdigitated Vesicular Self-Assembly. ...179
4.2.11 Helical Porous and Non-Porous Columns Exhibiting Intracolumnar Order..182 4.2.12 A “Nanoperiodic Table” of Supramolecular Dendrimers.. ...186
4.3 Conclusions ...196
4.4 Experimental Section ...198
4.4.1 Materials.. ...198
4.4.2 Techniques.. ...199
4.4.3 Synthesis of dendritic building blocks and dendrons.. ...202
4.4.4 DSC Traces. ...202
4.4.5 DSC Traces. ...319
4.4.6 Dependence of Mn () and of the Ratio Mn/MWt () vs Theoretical Molecular Weight (MWt). ...322
4.4.7Theoretical and Experimental Molecular Weights Determined by GPC and Thermal Transitions by DSC ...325
4.4.8 Measured d-spacing ...328
4.4.9 Structural and Retrostructural Analysis of Supramolecular Dendrimers Self-Assembled from 3,4,5- Trisubstituted Dendrons ...331
4.4.10 X-Ray Diffraction Plots and Diagrams ...334
4.5 References ...337
5– Design of Libraries of Self-Assembling Dendrons and Supramolecular Dendrimers via the “Deconstruction” of Self-Assembling Dendrons ...342
5.1 Introduction ...342
5.2 Results and Discussion ...343
5.2.1 The “Deconstruction Strategy ...343
5.2.2 Synthesis of “Deconstructed Dendron” ...343
5.2.3 Structural and Retrostructural Analysis of a Library of Deconstructed Dendrons...353
xii
5.4 Experimental Section ...361
5.4.1 Materials ...361
5.4.2 Techniques ...362
5.4.3 Synthesis ...365
5.4.4 DSC Traces ...365
5.4.5 Thermal Transitions, Enthalpy Changes, and Phases Exhibited by Supramolecular Dendrimers ...401
5.4.6 Measured d-Spacing ...404
5.4.7 Structural and Retrostructural Analysis of Supramolecular Dendrimers ...407
5.4.8 Supporting XRD Figures ...407
5.5 Conclusion ...412
6– Allosteric Control of the Cooperative Supramolecular Polymerization of Dendritic Dipeptides ...414
6.1 Introduction ...414
6.2 Results and Discussion ...416
6.2.1 Synthesis of New Compounds...416
6.2.2 The Supramolecular Polymerization of (4-3,4-3,5)12G1-CH2 -Boc-Tyr-Ala-OMe ...418
6.2.3 The Supramolecular Polymerization of (4-3,4-3,5)nG1-CH2 -Boc-Tyr-Ala-OMe ...428
6.2.4 The Supramolecular Polymerization of (4-3,4-3,5)12G1-CH2 -Boc-Tyr-Xaa-OMe ...430
6.3 Conclusion ...433
6.4 Experimental Section ...433
6.4.1 Materials ...433
6.4.2 Techniques ...435
6.4.3 Synthesis of New Compounds...437
6.5 References ...442
7– Introduction to Single-Electron Transfer Living Radical Polymerization ...447
7.2 The Path to SET-LRP and SET-DTLRP: Sulfonyl Halides as “Universal” Initiators
for Cu-Catalyzed LRP ...450
7.2.1 Cuprous Halide Catalysts for LRP Initiated with Sulfonyl Halides ...450
7.2.2 Cu0 and Cu2O Catalysts for LRP Initiated with Sulfonyl Chlorides ...452
7.2.3 Arenesulfonyl Bromides, Arenesulfonyl Iodides, and N-Centered Initiators 455 7.2.4 TERMINI. The First Iterative Method Based on LRP ...458
7.3 SET-DTLRP ...461
7.3.1 Toward the LRP of Vinyl Chloride (VC) ...461
7.3.2 Applications of SET-DTLRP ...470
7.3.3 From the SET-DTLRP of PVC to the LRP of (Meth)Acrylates in DMSO ....472
7.3.4 Perspective on SET-DTLRP ...474
7.4 SET-LRP ...475
7.4.1 Preparative Characteristics of SET-LRP ...475
7.4.2 Monomer Compatibility ...483
7.4.3 Catalyst Compatibility ...487
7.4.4 Initiators ...490
7.4.5Solvents ...494
7.4.6 Mechanistic Aspects of SET-LRP ...498
7.5 Conclusion and Perspectives ...543
7.6 References ...546
8– A Density Functional Theory (DFT) Computational Study of the Role of Ligand on the Stability of CuI and CuII Species Associated with ATRP and SET-LRP .561 8.1 Introduction ...561
8.2 Experimental Section ...561
8.2.1 Methodology for Quantum-Chemical Calculations ...564
8.3 Results ...561
8.3.1 The Effect of Coordination Geometry on Stabilization of CuI and CuIIX ...565
8.3.2 Validity of [Cu/L]+ and [CuX/L]+ Model ...569
8.3.3 Choice of Ligands ...570
xiv
8.3.5 Comparison of the Energies of [CuIIX/L]+ Complexes ...575
8.3.6 Comparison of the Energies of CuII/L Complexes and the Computation of Heats of Dissociation from CuIIX/L ...581
8.4 Discussion ...585
8.4.1 Crude Comparison of Disproportionation Energies ...586
8.4.2 An Overview of UV Disproportionation Data ...588
8.5 Conclusion ...595
8.6 References ...596
9– Implications of Monomer and Initiator Structure on the Dissociative Electron-Transfer Step of SET-LRP ...598
9.1 Introduction ...598
9.2 Methodology ...614
9.2.1 Computational Techniques ...614
9.2.2 Selection of Model Monomer and Dimer Dormant Species and Initiators ...615
9.3 Tabulated Values ...617
9.3.1 Homolytic and Heterolytic Bond Dissociation Energy ...617
9.3.2 Ion/Radical Pair Formation Energy ...617
9.3.3 Stability of the Ion/Radical Pair ...618
9.3.4 Energy of Activation ...619
9.3.5 Charge Density of the Halide and Spin Density of the Carbon Center ...619
9.4 Results and Discussion ...620
9.4.1 Consistency Test and General Halide and Methyl Substitution Trend ...620
9.4.2 Acrylates (MA-X) and Methacrylates (MMA-X) ...630
9.4.3 Haloacetonitriles (HAN-X), Acrylonitriles (AN-X), and Methyl Acrylonitriles (MAN-X) ...635
9.4.4 Methyl Cyanoacrylates (MCA-X) ...639
9.4.5 Vinyl Halides (VF-X, VC-X, VB-X, VI-I), Chloropropene (CP-X), Vinyl acetate (VAc-X) and Associated Initiators ...641
9.4.6 Styrenes (S-X) and Associated Initiators (Bn-X and PhSO2-X) ...652
9.4.7 Fluoride Initiators ...652
9.5 Conclusion ...663
9.6 References ...666
10– The Disproportionation of Cu(I)X Mediated by Ligand and Solvent into Cu(0) and Cu(II)X2 and its Implications for SET-LRP ...670
10.1 Introduction ...670
10.2 Results and Discussion ...674
10.2.1 Theoretical Considerations ...674
10.2.2 Disproportionation in Solvents that Stabilize Cu(0) Colloids ...682
10.2.3 Disproportionation in Solvents that do not Stabilize Cu(0) Colloids ...687
10.2.4 Analysis of Cu(0) Prepared by Disproportionation in Various Solvents by Dynamic Light Scattering ...694
10.2.5 Perspective on UV-vis and DLS Experiments ...703
10.3 Conclusion ...674
10.4 Experimental Section ...706
10.4.1 Materials ...706
10.4.2 Techniques ...707
10.4.3 Preparation of Cu(I)Br ...707
10.4.4 Preparation of UV/vis-samples ...708
10.4.5 Modeling of Disproportionation Equilibrium by Simultaneous Numerical Approximation ...708
10.4.6 Modeling of Disproportionation Equilibrium by a Series of Ordinary Differential Equations ...711
10.5 References ...706
11– Thio-Bromo “Click Chemistry” as a Tool for the Synthesis of Dendrimers and Dendritic Macromolecules ...720
11.1 Introduction ...720
11.2 Results and Discussion ...721
11.3 Application - Dendritic Macromolecules through a “Branch and Grow Strategy” ...728
xvi
11.5 Experimental Section ...736
11.5.1 Materials ...736
11.5.1 Techniques ...738
11.5.3 Synthesis ...739
11.5.4 Synthesis of Alternative to Thiolglycerol...743
List of Tables
Chapter 2
Table 2.1 - Expected Reflections for S, h, r-s, r-c and the Explicit Ratios Between
Reciprocal d-Spacings for S and h Relative to the (100) Reflection. ...27
Table 2.2 - Expected Reflections for Cubic Lattices with Pm n3 ,Im m3 , andIa d3 Symmetry. Ratio of Reciprocal d-Spacings for Pm n3 and Im m3 Relative to the (110) Reflection and for 3Ia d Relative to the (211) Reflection. ...31
Table 2.3 - Expected Reflections for the 12-fold QLC and Ratio of Reciprocal d- Spacings Relative to the (00002) Peak. ...42
Table 2.2 - Expected Reflections for Cubic Lattices with Pm n3 ,Im m3 , and 3Ia d Symmetry. Ratio of Reciprocal d-Spacings for Pm n3 and Im m3 Relative to the (110) Reflection and for 3Ia d Relative to the (211) Reflection. ...31
Table 2.2 - Expected Reflections for Cubic Lattices with Pm n3 ,Im m3 , and 3Ia d Symmetry. Ratio of Reciprocal d-Spacings for Pm n3 and Im m3 Relative to the (110) Reflection and for 3Ia d Relative to the (211) Reflection. ...31
Table 2.2 - Expected Reflections for Cubic Lattices with Pm n3 ,Im m3 , and 3Ia d Symmetry. Ratio of Reciprocal d-Spacings for Pm n3 and Im m3 Relative to the (110) Reflection and for Ia d3 Relative to the (211) Reflection. ...31
Chapter 3 Table 3.1 - Pinacolborylation of Methyl 4-Bromobenzoate ...101
Table 3.2 - Selected Ni-Catalyzed Pinacolborylations ...102
Table 3.3 - Optimization of Neopentylglycolborylations ...104
Table 3.4 - Scope of Ni-Catalyzed Neopentylglycolborylation ...106
Table 3.5 - Cross-coupling of Aryl Neopentylglycolboronates ...108
Table 3.6 - Neopentylglycolborylation of Aryl Chlorides Containing Additional Electron-Withdrawing Substituents. ...113
xviii Table 4.2 - Thermal Transitions, Enthalpy Changes, and Phases Exhibited by
Supramolecular Dendrimers Generate from the Library of Self-Assembling
3,4-Disubstituted Dendrons ...166 Table 4.3 - Thermal Transitions, Enthalpy Changes, and Phases Exhibited by
Supramolecular Dendrimers Generated by the Library of 3,5-Disubstituted
Self-Assembling Dendrons ...171 Table 4.4 - Measured and Fitted XRD Peak Amplitudes, Column and Pore Diameter for
BpPr Dendrons forming Hollow Helical Supramolecular Dendrimers that
Self-Organize into h Lattices ...183 Table 4.ST1 - Theoretical and Experimental Molecular Weights Determined by GPC and Thermal Transitions by DSC of Library of 3,4,5-Trisubstituted Dendrons ...325 Table 4.ST2 - Theoretical and Experimental Molecular Weights Determined by GPC and Thermal Transitions by DSC of Library of 3,4-Disubstituted Dendrons ...326 Table 4.ST3 - Theoretical and Experimental Molecular Weights Determined by GPC and Thermal Transitions by DSC of Library of 3,5-Disubstituted Dendrons ...327 Table 4.ST4 - Measured d-spacing (in Å) of the, Lam(k, bilayer), Pm3 nCubic (Cub), c2mm
Centered rectangular columnar lattice (r-c), p6mm Hexagonal Columnar (h) Lattices
Generated by 3,4,5- Trisubstituted Dendrons ...328 Table 4.ST5 - Theoretical Measured d-spacing (in Å) of the Lam(k, bilayer), c2mm Centered
rectangular columnar lattice (r-c), Pm3 nCubic (Cub), p6mm Hexagonal Columnar
(h) Lattices Generated by 3,4 –Disubstituted Dendrons ...329 Table 4.ST6 Measured d-Spacing (in Å) of the Lam(k, bilayer), c2mm Centered rectangular
columnar lattice (r-c), p6mm Hexagonal Columnar (h), 12 Fold Quasi Liquid
Crystal (QLC) and P4/mnm Tetragonal (Tet) Lattices Generated by 3,5 –Disubstituted Dendrons ...330 Table 4.ST7 - Structural and Retrostructural Analysis of Supramolecular Dendrimers
Self-Assembled from 3,4,5- Trisubstituted Dendrons ...331 Table 4.ST8 - Structural and Retrostructural Analysis of Supramolecular Dendrimers
Self-Assembled from 3,4 –Disubstituted Dendrons ...332 Table 4.ST9 - Structural and Retrostructural Analysis of Supramolecular Dendrimers
Chapter 5
Table 5.ST1 - Thermal Transitions, Enthalpy Changes, and Phases Exhibited by Supramolecular Dendrimers Generated from Previously Reported Self-Assembling Dendrons ...401 Table 5.ST2 - Thermal Transitions, Enthalpy Changes, and Phases Exhibited by
Supramolecular Dendrimers Generated by Novel Self-Assembling Dendrons ...402 Table 5.ST3 - Thermal Transitions, Enthalpy Changes, and Phases Exhibited by
Supramolecular Dendrimers Generated by Novel Self-Assembling Dendrons ...403 Table 5.ST4 - Measured d-spacing (in Å) of the, Lam(k, bilayer), Pm3 nCubic (Cub), and
c2mm Centered rectangular columnar lattice (r-c) of the supramolecular dendrimer
generated from previously reported self-assembling dendrons. ...404 Table 5.ST5 - Measured d-spacing (in Å) of the Lam(k), Lam(k, bilayer), Pm3 nCubic (Cub)
lattices, c2mm centered rectangular columnar lattices (r-c), Im m3 Body-centered
cubic lattices (BCC), p6mmhexagonal columnar lattices (h), Im m3 (l) triply
continuous body-centered cubic lattices (Cubtri), tetragonal (Tet) lattices exhibited by
supramolecular dendrimers generated from novel self-assembling dendrons. ...405 Table 5.ST6 - Measured d-spacing (in Å) of the Lam(k), Lam(k, bilayer), p2mm Simple
rectangular columnar lattices (r-s), p6mm hexagonal columnar lattices (h), 3D p6mm
hexagonal columnar lattices (h3D), p6mm hexagonal columnar super-lattices (h super-lattice), gyroid bicontinuous body-centered cubic lattices with
3
Ia d symmetry (Cubbi), and
triply continuous body-centered cubic lattices with Im m3 (l) (Cubtri) exhibited by
supramolecular dendrimers generated from novel self-assembling dendrons. ...406 Table 5.ST7 - Thermal Transitions, Enthalpy Changes, and Phases Exhibited by
Supramolecular Dendrimers Generated by Novel Self-Assembling Dendrons ...407 Table 5.ST8 - Structural and Retrostructural Analysis of Supramolecular Dendrimers
Generated from Novel Self-Assembling Dendrons ...408 Table 5.ST9 - Structural and Retrostructural Analysis of Supramolecular Dendrimers
Generated from Novel Self-Assembling Dendrons ...409
Chapter 6
Table 6.1 - Thermal transitions of (4-3,4-3,5)12G2-CH2-Boc-Tyr-Ala-OMe ...423 Table 6.2 - Thermodynamic Data Calculated from the Fits of the Self-Assembly of the
xx Table 6.3- Thermodynamic Data Calculated from the Fits of the Self-Assembly of
Dendritic Dipeptides with Different Tail groups. ...429 Table 6.4- Thermodynamic Data Calculated from the Fits of the Self-Assembly of the
Dendritic Dipeptides Composed of Tyr and other Nonpolar -Amino Acids. ...433
Chapter 8
Table 8.1 - XRD and DFT Bond Lengths and Angles for [CuIIBr/Me
6-Tren]+ ...570
Table 8.2 –Energies of Inorganic Species ...575 Table 8.3 –Heterolytic Bond Dissociation Energies ...576
Chapter 9
Table 9.1 - Comparison of present and previous computational and experimental values for methyl halides . ...620 Table 9.2 - Tabulated values for the homolytic and heterolytic dissociation curves of
Me-X, Et-Me-X, iPr-Me-X, and tB-X.. ...626 Table 9.3 - Tabulated values for the transition states of Me-X, Et-X, iPr-X, and tB-X..626 Table 9.4 - Tabulated values for the homolytic and heterolytic dissociation curves of
MA-X and MMA-X... ...633 Table 9.5 - Tabulated values for the transition states of MA-X and MMA-X. ...633 Table 9.6 - Tabulated values for the homolytic and heterolytic dissociation curves of
HAN-X, AN-X, and MAN-X.... ...637 Table 9.7 - Tabulated values for the transition states of HAN-X, AN-X, and MAN-X. 638 Table 9.8 - Tabulated values for the homolytic and heterolytic dissociation curves of
MCA-X. ...640 Table 9.9 - Tabulated values for the transition states of MCA-X. ...640 Table 9.10 - Tabulated values for the homolytic and heterolytic dissociation curves of
VF-X, VC-X, VB-X, VI-I, CP-X, and VAc-X. ...645 Table 9.11 - Tabulated values for the transition states of VF-X, VC-X, VB-X, VI-I,
CP-X, and VAc-X. ...646 Table 9.12 - Tabulated values for the homolytic and heterolytic dissociation curves of
Table 9.14 - Tabulated values for the homolytic and heterolytic dissociation curves of S-X, Bn-S-X, PhSO2-X... ...655 Table 9.15 - Tabulated values for the transition states of S-X, Bn-X, and PhSO2-X. ....656 Table 9.16 - Tabulated values for the homolytic and heterolytic dissociation curves of
fluoropolymer initiators. ...658 Table 9.17 - Calculated values for the transition states of fluoropolymer initiators. ...659 Table 9.18 - Tabulated values for the homolytic and heterolytic dissociation curves of
dimeric models for dormant propagating macroradicals.. ...662 Table 9.19- Calculated values for the transition states of dimeric models for dormant
propagating macroradicals. ...662
Chapter 10
Table 10.1 - Equilibrium Constants for the Disproportion of Cu(I)X, Kdisp, in Various
Solvents. ...672 Table 10.2 - Approximate Ligand-Dependent Kdisp of Cu(I)Br Determined via UV-vis
Spectroscopy ...680 Table 10.3 - Analysis of the Particle Size of Cu(0) Prepared via Disproportionation of
Cu(I)Br in the Presence of Me6-TREN by Dynamic Light Scattering. ...680
Chapter 11
Table 11.1 - Cu(0)/Me6-TREN/CuBr2-Catalyzed SET-LRP of Methyl Acrylate (MA)
Initiated with Dendritic Macroiniators in DMSO at 25 C ...733
List of Figures
Chapter 1
Figure 1.1 - The Interconnectivity of Strategies and Method in supramolecular and Macromolcular Chemistry ...2 Figure 1.2 - Number of self-assembling Percec-type dendrons prepared with the
xxii Chapter 2
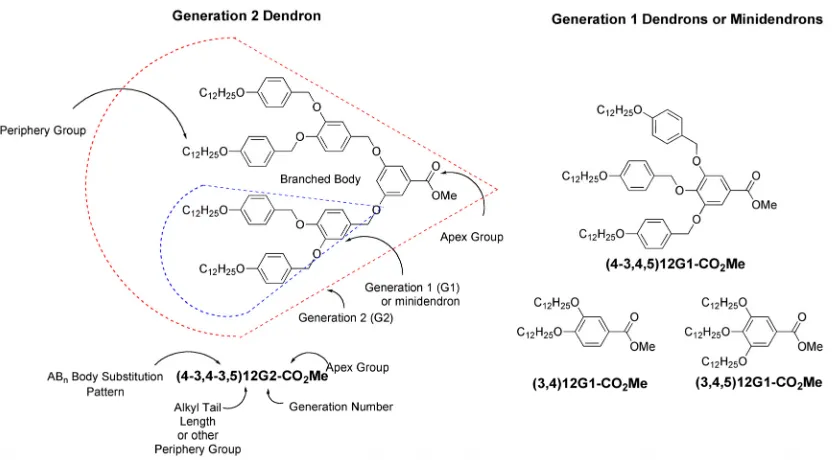
Figure 2.1 - Nomenclature of Percec-type dendrons (left) and generation 1 (G1)
dendron/minidendrons (right) ...12 Figure 2.2 From amorphous benzyl ether dendrons to self-assembling benzyl ether
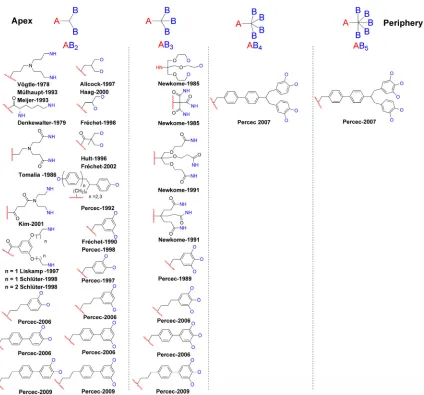
dendrons. ...13 Figure 2.3 - Selected examples of AB2, AB3, AB4, and AB5 building blocks used in the
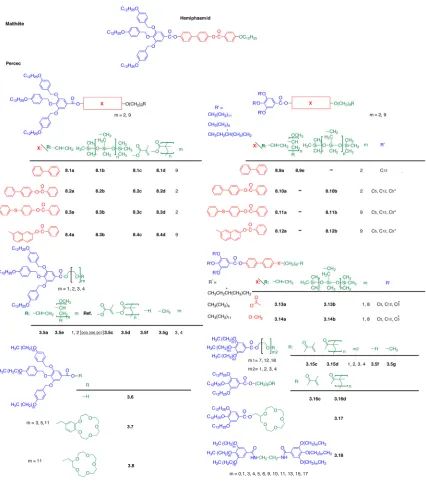
design of self-assembling dendrons and self-organizable dendronized polymers.. ...15 Figure 2.4 - Hemiphasmid reported by Malthête(top) and a selected group of similar first generation monomers and their polymers reported by Percec.. ...19 Figure 2.5 - Some characteristic textures of N (top left), S (top right), h (bottom left),
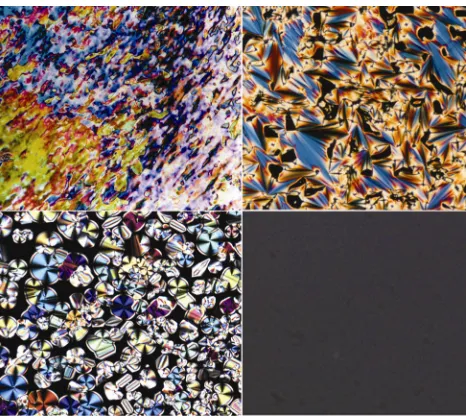
and Cub ( bottom right ) phases. ...22 Figure 2.6 - TEM and negative images of homeotropically (a) and parallel (b) aligned (3,4,5)12F8G1-B[15]C5 in the h. TEM and negative images of hometropically (c)
and SFM image of parallel (d) aligned (4-3,4-3,5)12G1-CH2-(Boc-L-Tyr-L-Ala
-OMe). ...26 Figure 2.7 - Preferred conical conformation of (3,4,5)212G2-COOH (left) and micellar supramolecular spheres assembled into a cubic lattice with symmetry (middle). The regimes of highest electron density (middle) can be compared with the regimes of low-electron density (right)....28 Figure 2.8. Typical indexed experimental X-ray diffractograms of SAD and Smod phases
(a) r-s lattice with p2mm symmetry, (b), the BCC lattice with Im m3 symmetry (c), the
r-c lattice with c2mm symmetry (d), the h lattice with p6mm symmetry, and the Cub
lattice with Pm n3 symmetry (f).. ...32 Figure 2.9 - The spherical/micellar model for the +-++ phase assignment (left) and the columnar model for the ++-- phase assignment (right). The corresponding electron density maps for the z = 0 , z = ¼ and z = ½ planes that were used to elaborate the two models are shown above. Discrimination between these two models was accomplished by TEM and isomorphous replacement. ...34 Figure 2.10 - Raw (a) and reconstructed (b) TEM images and (c) ED pattern and (d) Fourier reconstructed power spectrum of (3,4,5-(3,4)2)12G3-COOH. Also shown the Spherical model (e) for the Pm n3 phase and its [001] projection (f) and the
Figure 2.13 - First amphiphilic dendron, (4-3,4,5-(3,5)2)12G3-CH2OH, identified to self-organize into the P42/mnm tetragonal phase. Small angle experimental X-ray
diffraction powder plot with peak indexing (a); monodomain small angle experimental X-Ray diffraction patterns with indexing (b); schematic of the P42/mnm tetragonal unit
cell with the 5 different types of spherical clusters marked (c); reconstructed electron densitymaps at the indicated z-axis positions (d). ...39 Figure 2.14 - 2D tilings representing tetrahedrally close packed (t. c. p. ) lattices such as Pm n3 (a) and P42/mnm (b) using three basic decorated tiles (c). Quasiperiodic
arrangement of these tiles (d) results in the proposed model (e) of 12-fold symmetry for the LQC structure of (3,4,5-(3,5)2)12G3-CH2OH. ...41 Figure 2.15 - Example of an experimental diffractogram of a QLC lattice. ...41
Figure 2.16 - Representative amplification of higher order diffraction peaks for r-c (top)
and h (bottom) lattices. ...43 Figure 2.17 - Amplification of higher order diffraction peaks in the Cub phase. (a) Full diffractogram and (b) enlargement of the (321), (400), (420), and (421) reflections. ....44 Figure 2.18 - Diffraction by a helical fiber: (a) a 51single-strand atomic helix and its structural parameters; (b) the simplified representation of the fiber diffraction generated for the structure from (a) by using the helical diffraction theory; (c) a 51 single-strand atomic helix model generated from tilted groups of atoms and its structural parameters; (d) the simplified representation of the fiber diffraction by using the helical diffraction theory. . ...45
xxiv favor columnar self-assembly. Unless otherwise shown, all spherical supramolecular dendrimers self-organinze in a Cub lattice.. ...56 Figure 2.27 - Examples of (AB)y-ABn hybrid dendrons exhibiting new Smod phase .. ...58 Figure 2.28 - 3,4-Branching library of phenylpropyl ether dendrons exhibiting the full range of self- organized structures including Cub, Tet, QLC, S, h, r-c, andr-s.. ...62
Figure 2.29 - 3,4,5-Branching library phenylpropyl ether dendrons. ...63 Figure 2.30 - 3,5-Constutitional isomeric branching library of phenylpropyl ether
dendrons. ...64 Figure 2.31 - Structures of (4Nf-3,4,5)nG1-COOH and (4Bp-3,4,5)12G1-COOH. ...65 Figure 2.32 - Examples of 3,4-, 3,5-, and 3,4,5-biphenyl-4 methyl ether-based dendrons and their self-assembly. ...66 Figure 2.33 - Examples of 3,4-, 3,5-, and 3,4,5-biphenyl-4 methyl ether dendrons and their self-assembly. ...67 Figure 2.34 - Library of AB4 based dendrons. ...73 Figure 2.35 - Library of AB5-based dendrons.. ...74 Figure 2.36 - Self-assembly of (4-3,4,5-AB4)12G3-CO2CH3 into a backfolded 7/2- helical column. ...74 Figure 2.37 - Self-Assembly of (4-AB4)12G2-CH2OH into hollow spheres.. ...75 Figure 2.38 - NMR (a) and CD/UV-vis (b, c, d) experiments confirming helical columnar self-assembly of dendronized dipepetides... ...77 Figure 2.39 -. Models of self-assembled helical porous columns from dendritic
dipeptides (left, a-d), orientation of dipetide groups in the column (e) and hydrogen bonding network (right)... ...78 Figure 2.40 -. Proton Transport experiment comparing a liposome containing an
impermeable pH sensitive fluorescent indicator (left) and a liposome containing a self-assembled dendritic channel (right) ...78 Figure 2.41 - The self-assembly of homochiral and heterochiral dendritic dipeptides is stereochemically controlled and allosterically regulated by the stereochemistry of the dipeptide. ...80 Figure 2.42 - Thermoreversible shape change of circular to ellipsoidal columns as
evidenced by cross- sections of the reconstructed electron density maps... ...81 Figure 2.43 - Self-assembly of (4-(3,4)2)12G2-CH2-Boc-L-Tyr-L-Ala-OMe in an apple
Figure 2.45 - Structures of (4-3,4,5)nFmG1-COOH and (4-3,4,5)nFmG1-oEO, where o is the number of EO repeat units... ...84 Figure 2.46 - Structures of (3,4,5)12FmG1-COOH and (3,4,5)12FmG1-oEO, where o in this case is the number of EO repeat units ...84 Figure 2.47 - Structures of dendronized n-type acceptors. ...86 Figure 2.48 - Semifluorinated Percec-type dendrons (top left) and donor apex groups. ..87 Figure 2.49 - Amphiphilic dendron with semifluorinated periphery that self-organizes into the bi-continuous cubic phase (Cubbi) with symmetry (a) and corresponding relative electron density volumetric distribution that schematically illustrates the interlocked network of the bi-continuous phases (b).. ...88
Chapter 3
Figure 3.1 - Overview of methods employed in the synthesis of aryl-boronic acids. ...98 Figure 3.2 - Conditions for initial studies into the Ni-catalyzed pinacolborylation of 4- bromoanisole.. ...99 Figure 3.3 - Versatility of Two-Step, One-Pot Ni-Catalyzed Neopentylglycolborylation and Complementary Pd/Ni-Catalyzed Cross-Coupling with Aryl Halides, Mesylates and Tosylates. ...111 Figure 3.4 – Working mechanism of Ni-catalyzed neopentylglycolborylation. ...116 Figure 3.5 - 1H-NMR spectrum of Neopentylglycol in benzene-d6 (360 MHz) ...122 Figure 3.6 - 1H -NMR spectrum of neopentylglycolborane (HBNpg) in benzene-d6 (3.3
to 3.2 ppm enlargement on left). ...123 Figure 3.7 - 1H NMR spectrum of neopentylglycolborane (HBNpg) in benzene-d6 ,
enlargement of 0.8 ppm to 0.5 ppm. ...124 Figure 3.8 - 13C NMR spectrum of neopentylglycolborane in benzene-d
6 (125 MHz). .125
Figure 3.6 - 1H -NMR spectrum of neopentylglycolborane (HBNpg) in benzene-d6 (3.3
to 3.2 ppm enlargement on left). ...123 Figure 3.6 - 1H -NMR spectrum of neopentylglycolborane (HBNpg) in benzene-d6 (3.3
to 3.2 ppm enlargement on left). ...123
Chapter 4
Figure 4.1 – The three modular approaches to BpPr building blocks.. ...145 Figure 4.2 - Structural and retrostructural analysis of supramolecular dendrimers
xxvi Figure 4.3 - Structural and retrostructural analysis of supramolecular dendrimers
self-assembled from AB2 3,4-disubstituted dendrons. ...165 Figure 4.4 - Structural and retrostructural analysis of supramolecular dendrimers
self-assembled from AB2 3,5-disubstituted dendrons.. ...170 Figure 4.5 – Lamellar crystalline structure with four layer repeat observed for
(4BpPr-3,4,5BpPr)12G1-CO2CH3. (a) electron density map indicating decreased electron density in every other layer. (b) Proposed packing models together with the electron density map. (c) Molecular model of (4BpPr-3,4,5BpPr)12G1-CO2CH3, and the top and side view of the puckered tetralayer model... ...172 Figure 4.6– Small-angle powder XRD plots for selected BpPr dendrons that
self-assemble into the Pm3n cubic phase (top) and the corresponding reconstructed electron density maps, presented at relative scale (bottom). The dashed blue rectangles mark the increased intensity of the higher order diffraction peaks. ...174 Figure 4.7 – Molecular models of the four chosen dendrons in the all-trans conformation
(a), crown-like pyramidal packing proposed for (3,4,5BpPr)312G3-CO2CH3 (b), cone-like packing proposed for (3,4,5BpPr-(3,4BpPr)2)12G3-CO2CH3 and (3,4BpPr)312G3-CO2CH3(c). Unit cell and to-scale molecular model of (4BpPr-(3,4BpPr)2)12G2-CO2CH3 depicting the lower bound of the empty core diameter Dcore (d). ...176 Figure 4.8 – The effect the number of alkyl tails (x) on the spherical diameter and on the
number of dendrons per supramolecular dendritic sphere () generated from third generation dendrons or dendrons of comparable molecular dimensions (a).
Dependence of the calculated projection of the solid angle (’) of the dendrons in the supramolecular sphere on the number of alkyl tails (x) (b).. ...179 Figure 4.9 – Vesicular cubic phase: (4BpPr-3,4BpPr-3,5BpPr)12G2-CO2CH3 XRD
powder plot with the increased relative intensities of the high order peaks marked by the dotted rectangle (a), corresponding relative electron density map (b),
corresponding model of the self-assembled vesicular sphere (c), and comparison with the model of the hollow cubic spheres self-assembled from (4PBp-(3,4PBp)2 )12G2-CO2CH3(d). ...182 Figure 4.9 – Vesicular cubic phase: (4BpPr-3,4BpPr-3,5BpPr)12G2-CO2CH3 XRD
powder plot with the increased relative intensities of the high order peaks marked by the dotted rectangle (a), corresponding relative electron density map (b),
Figure 4.10 – Supramolecular crown conformations assembled from
(4BpPr-(3,4BpPr)2)-12G2-X (X=CO2CH3 and CH2OH) and their self-organization into helical
pyramidal columns. Wide-angle XRD oriented fiber patterns collected at 25°C for X=CO2CH3 (a), compared with the Cerius2 simulated diffraction pattern based on the
corresponding molecular models of (4BpPr-(3,4BpPr)2)-12G2-CO2CH3(b), wide-angle XRD oriented fiber pattern collected at 25 °C for X=CH2OH (c), and theoretical
diffraction pattern for a deca-201 helix (d). Azimuthal Chi angle plots along the region
indicated on the fiber patterns (e). Molecular model for the X=CO2CH3 (f). In (a, c): L
- indicates helical layer line; tilt- dendron tilt angle or tilt correlation features (marked in green); long range helical features are marked by the gray colored circles. ...184 Figure 4.11 – Wide-angle oriented fiber XRD patterns of the supramolecular columns
assembled from the dendritic alcohol (4BpPr-3,4,5BpPr)12G1-CH2OH collected in the Φhio phase (a), and Φh phase (b). Cerius2 molecular model based simulation of the
XRD pattern of the oriented fiber (c). Atomic helical packing, helix parameters and the corresponding simulated XRD pattern (d) of the same supramolecular assembly. The molecular model of the supramolecular structure generated from
(4BpPr-3,4,5BpPr)12G1-CH2OH used in the Cerius2 simulation (e, f, g, h).. ...186 Figure 4.12 – Primary structure vs 3D supramolecular structure for all libraries of AB3
supramolecular dendrimers. Bn = benzyl ether, Pr = phenylpropyl ether, Bp =
biphenyl-4-methyl ether, BpPr = biphenylpropyl ether. ...189 Figure 4.13 Primary structure vs 3D supramolecular structure relationship for all
3,4-disubstituted libraries of AB2 supramolecular dendrimers. Bn = benzyl ether, Pr =
phenylpropyl ether, Bp = biphenyl-4-methyl ether, BpPr = biphenylpropyl ether. ....191 Figure 4.14 – Primary structure vs 3D supramolecular structure for all 3,5-disubstituted
libraries of AB2 supramolecular dendrimers. Bn = benzyl ether, Pr = phenylpropyl
ether, Bp = biphenyl-4-methyl ether, BpPr = biphenylpropyl ether. ...192 Figure 4.SF1 – DSC traces (10°C/min) of the library of (3,4,5BpPr)312G3 dendrons. 306 Figure 4.SF2 – DSC traces (10°C/min) of the library of (3,4BpPr-(3,4,5BpPr)2)12G3
dendrons. ...307 Figure 4.SF3 – DSC traces (10°C/min) of the library of (4BpPr-(3,4,5BpPr)2)12G2
dendrons. ...308 Figure 4.SF4 – DSC traces (10°C/min) of the library of
(4BpPr-3,4BpPr-3,4,5BpPr)12G2 dendrons. ...309 Figure 4.SF5 – DSC traces (10°C/min) of the library of (3,4,5BpPr-(3,4BpPr)2)12G3
xxviii Figure 4.SF6 – DSC traces (10°C/min) of the library of (3,4BpPr)312G3 dendrons. ...311 Figure 4.SF7 – DSC traces (10°C/min) of the library of
(4BpPr-3,4,5BpPr-3,4BpPr)12G2 dendrons. ...312 Figure 4.SF8 – DSC traces (10°C/min) of the library of (4BpPr-(3,4BpPr)2)12G2
dendrons. ...313 Figure 4.SF9 – DSC traces (10°C/min) of the library of (3,4,5BpPr-(3,5BpPr)2)12G2
dendrons. ...314 Figure 4.SF10 – DSC traces (10°C/min) of the library of (3,4BpPr-(3,5BpPr)2)12G2
dendrons. ...315 Figure 4.SF11 – DSC traces (10°C/min) of the library of
(4BpPr-3,4,5BpPr-3,5BpPr)12G2 dendrons. ...316 Figure 4.SF12 – DSC traces (10°C/min) of the library of
(4BpPr-3,4BpPr-3,5BpPr)12G2 dendrons. ...317 Figure 4.SF13 – DSC traces on heating at 10 °C min-1, 5 °C min-1, 2 °C min-1, and 1 °C
min-1 for the compound (3,4BpPr-3,5BpPr)12G2CH2OH. Transition temperatures (°C) and enthalpy changes (in parentheses kcal/mol) are marked on the figure. Peak intensities are not scaled. ...318 Figure 4.SF14 – GPC traces of the library of AB3 3,4,5-trisubstituted dendrons.. ...319 Figure 4.SF15 – GPC traces of the library of AB2 3,4-disubstituted dendrons. ...320 Figure 4.SF16 – GPC traces of the library of AB2 3,5-disubstituted dendrons.. ...321 Figure 4.SF17 – Dependence of Mn () and the ratio Mn/MWt () vs theoretical
molecular weight (MWt) of the library of 3,4,5-trisubstituted dendrons.. ...322 Figure 4.SF18 – Dependence of Mn () and the ratio Mn/MWt () vs theoretical
molecular weight (MWt) of the library of 3,4-disubstituted dendrons.. ...322
Figure 4.SF19 – Dependence of Mn () and the ratio Mn/MWt () vs theoretical
molecular weight (MWt) of the library of 3,5-disubstituted dendrons.. ...322 Figure 4.SF20 – Comparison of the Cub and Cub(g) phases of the (3,4BpPr)3
12G3-CO2CH3. (a) Combined SAXS powder plots for the indicated temperature sequence. (b) Combined WAXS powder plots for the indicated temperature sequence. (c)
Detailed SAXS powder plots and diffraction peak amplitudes for the Cub phase at 180 °C and Cub(g) at 30 °C. (d) Temperature dependence of the lattice parameter a... ...334
(b) powder WAXS pattern; (c) SAXS powder diffraction plot; (d) WAXS powder diffraction plot... ...335 Figure 4.SF22 – Comparison of wide-angle XRD for the Lam(k, tetralayer) phase and the
monotropic S(bilayer) phase of (4BpPr-3,4,5BpPr)12G1-CO2CH3. (a) WAXS powder
diffraction patterns collected for 60 seconds while cooling continuously from the isotropic phase with 5°/min; (b) corresponding WAXS diffractograms; and (c) detailed plots of the two consecutive short exposures detailing the monotropic smectic phase and the low temperature lamellar crystalline phase.... ...336
Chapter 5 -
Figure 5.1 – The deconstruction of (3,4BpPr-(3,4,5BpPr)2)12G3 and the structural and retrostructural analysis of the “Deconstructed” library of AB3, AB2, ABn-(AB)y , and
AB2-AB-AB2 dendrons. Red, green and purple wedges indicate the branches that will
be removed in the next deconstruction step..... ...345 Figure 5.2 – The deconstruction of (3,4BpPr-3,4,5BpPr)12G2 and the structural and
retrostructural analysis of the “Deconstructed” library of AB3, AB2, ABn-(AB)y , and
AB2-AB-AB2 dendrons. Green and purple wedges indicate the branches that will be
removed in the next deconstruction step...... ...346 Figure 5.3 – Reconstructed electron density map of Cubtri phase observed for
(3,4BpPr-4BpPr)12G1-CH2OH at 138 °C.... ...355 Figure 5.4 – Electron density reconstruction of ((3,4BpPr)2-4BpPr)12G2-CO2CH3at
105 °C ...359 Figure 5.5– Electron density reconstructions of the Cubbi phase generated from
(3,4,5BpPr-(4BpPr)2)12G1-CH2OH at 128 °C (left) and the h phase at
105 °C... ...360 Figure 5.SF1 – DSC traces (10 °C/min) of the library of (3,4BpPr-(3,4,5BpPr)2)12G3
dendrons..... ...396 Figure 5.SF2 – DSC traces (10 °C/min) of the library of (3,4BpPr)312G3 dendrons....397 Figure 5.SF3 – DSC traces (10 °C/min) of (3,4BpPr-3,4,5BpPr-4BpPr)12G2,
(3,4BpPr-3,4,5BpPr-3,4BpPr)12G3, and ((3,4BpPr)2-4BpPr)12G2 deconstructed dendrons.... ...398
Figure 5.SF4 – DSC traces (10 °C/min) of (3,4BpPr-4BpPr-3,4BpPr)12G2,
(4BpPr-3,4,5BpPr-4BpPr)12G1, and (4BpPr-3,4BpPr-3BpPr)12G1 deconstructed
xxx Figure 5.SF5 – DSC traces (10 °C/min) of the (3,4BpPr-4BpPr)12G1,
(3,4BpPr-(4BpPr)2)12G1,(3,4,5BpPr-4BpPr)12G1, (3,4,5BpPr-(4BpPr)2)12G1, and
(4BpPr)212G0 deconstructed dendrons. ...400
Figure 5.SF6 – SAXS diffractogram of the Im3 (l) of m (3,4BpPr-4BpPr)12G1-CH2OH (19b) phase recorded at 138ºC (left). Structural diagram of the Im3 (l)phasem .... ....410
Figure 5.SF7 – SAXS diffractogram of the Ia d3 of (3,4,5BpPr-(4BpPr)2 )12G1-CH2OH (24b) phase recorded at 128ºC (left). Structural diagram of the 3Ia d phase ...411
Chapter 6 -
Figure 6.1 – Synthesis of new dendritic dipeptides. Reagents and conditions: (i) Di -tert-butyl dicarbonate , Et3N, Dioxane/H2O, 0 °C, 24h; (ii) NMM, CDMT, EtOAc, 2h; (iii)
K2CO3, DMF, 70 °C. ...417 Figure 6.2 – General Structure of dendritic dipeptides derived from
Boc-Tyr(OH)-Ala-OMe and (4-3,4,-3,5)12G2-CH2Cl.. ...419 Figure 6.3 – CD/UV-vis Spectra of (4-3,4,-3,5)12G2-CH2-Boc-Tyr-Ala-OMe a) L-L b)
D-D c) L-D d) D-L ...420
Figure 6.4 – CD (top) and UV(vis) of D/L-L, D/L-D, L-D/L, and D-D/L
(4-3,4-3,5)12G2-CH2-Boc-Tyr-Ala-OMe in cyclohexanes. a 1.6 10-4 M, b 1.4 10-4 M ...422 Figure 6.5 – Thermal transitions of (4-3,4-3,5)12G2-CH2-Boc-Tyr-Ala-OMe. DSC
traces of (4-3,4-3,5)12G2-CH2-Boc-Tyr-Ala-OMe. Transition temperatures (°C) and enthalpy changes (kcal/mol, in parentheses) are marked on DSC. g, glass; i,
isotropic.... ...423 Figure 6.6 – Degree of aggregation vs Temperature (K) for enantiomeric pairs a) D-D
and L-L b) L-D and D-L c) D-D/L and L-DL d) D/L-D and D/L-L e) D/L-D/L ...427
Figure 6.7 – Degree of aggregation vs Temperature (K) via UV-vis a)
(4-3,4-3,5)nG2-Boc-L-Tyr-L-Ala-OMe and b) (4-3,4-3,5)dm8*G2-Boc-D/L-Tyr-D/L-Ala-OMe.429
Figure 6.8 – Thermal transitions of (4-3,4-3,5)dm8*G2-CH2-Boc-DL-Tyr-DL-Ala-OMe. DSC traces of (4-3,4-3,5)12G2-CH2-Boc-Tyr-Ala-OMe. Transition temperatures (°C) are marked on DSC. g, glass; i, isotropic.... ...430 Figure 6.9 – Degree of aggregation vs Temperature (K) via UV-vis and CD for a)
Chapter 7
Figure 7.1 – Structures of sulfonyl chlorides used as initiators in the CuICl, Cu0, and Cu2O/bpy-catalyzed LRP.... ...452 Figure 7.2 – Multidentate Phase Transfer Catalysts (PTC) used in the Cu0/Cu2
O-catalyzed LRP of Sty and BA initiated with sulfonyl halides ...454 Figure 7.3 – Structures of N-chloro initiators used in Cu-catalyzed LRP and their Ieff....457 Figure 7.4 – Dendritic macromolecules with tailored polymer spacers between the
branching points of (a) low DP (b) medium DP (c) high DP. Red ellipsodes are
TERMINI branches and F represents functional chain ends........ ...459 Figure 7.5 – Diversity of PVC and combined PVC-polyacrylate structures produced via
SET-DTLRP....... ...474
Figure 7.6 – Example MALDI-TOF-MS analysis of a PMA produced via Cu0/Me
6
-TREN catalyzed SET-LRP of MA initiated with BPE in methanol/water (95/5 v/v) at 25C....... ...479 Figure 7.7 – Representative colors of Cu-catalyzed LRP: (A) Cu(0)-wire catalyzed
SET-LRP of MA (the 12.5 cm of 20 gauge wire is wrapped around the stirring bar). Reaction Conditions: [MA]o/[MBP]o/[Me6-TREN]o = 222/1/0.1; (B) CuIBr/Me6
-TREN catalyzed polymerization of MA in MeCN. Reaction Conditions:
[MA]o/[MBP]o/[CuIBr]o/[Me6-TREN]o = 222/1/0.1/0.1; (C) CuIBr/bpy catalyzed
ATRP of MA in toluene [MA]o/[MBP]o/[CuIBr]o/[bpy]o = 222/1/1/1; and (D)
CuIBr/bpy catalyzed ATRP of MA in MeCN [MA]o/[MBP]o/[CuIBr]o/[bpy]o =
222/1/1/1....... ...482 Figure 7.8 – Monomers used in SET-LRP....... ...483 Figure 7.9 – Initiators used in SET-LRP and their known compatible monomers...... .491 Figure 7.10 –Mechanism of SET-LRP...... ...499 Figure 7.11 – UV-Vis analysis of disproportionation of CuBr in DMSO (a) with no
ligand and (b) with Me6-TREN...... ...502
Figure 7.12 – Comparison of SET-LRP in DMSO and Cu-catalyzed radical
polymerization in MeCN...... ...507 Figure 7.13 – 3D plot of the dual effect of Cu0 Surface Area (y-axis) and [Me6
-TREN]o/[MBP]o (x-axis) on the kpapp (z-axis)...... ...509 Figure 7.14 – Effect of increasing % H2O on the kpapp and Mw/Mn in the SET-LRP of MA
xxxii 7.4 mol/L, [MA]o/[MBP]o/[Me6-TREN]o = 222/1/0.1, Cu0 = 12.5 cm of 20 gauge
wire...... ...510 Figure 7.15 – The Effect of Cu0 particle size on the kinetics of Cu0 /Me6-TREN
Catalyzed SET-LRP of MA in DMSO at 25 C (left). The dependence of kpapp vs.
(SA)1/2 for the Cu0/Me6-TREN catalyzed SET-LRP of MA in DMSO at 25 C.
(right)...... ...510 Figure 7.16 – Cu0 decantation experiment (left) and kinetic plots (right) for the
Cu0/Me6TREN-catalyzed SET-LRP of MA initiated with MBP in DMSO at 25 ºC. (a)
Monomer conversion vs time for a conventional kinetic experiment used as a control, (b) monomer conversion vs time for a kinetic experiment where reaction mixture was decanted from Cu0 powder at approximately 20 % conversion and brought back after 1.5 h, (c) overlapped monomer conversion from (a) and (b), and (d) ln([M]0/[M]) vs
time (kpapp = 0.0277 min-1, k1papp = 0.0253 min-1,k2papp = 0.0261 min-1) for both
experiments. Polymerization conditions: MA = 2 mL, DMSO = 1 mL, [MA]0 = 7.4
mol/L, [MA]0/[MBP]0/[Cu0]0/[Me6-TREN]0 = 222/1/0.1/0.1, Cu0 425 m. ...515 Figure 7.17 –The effect of Cu0-Wire surface area on the kpapp of SET-LRP of MA.......517 Figure 7.18 – Taube inner (ISET) and outer (OSET) sphere electron-transfer....... ...521 Figure 7.19 – kpappvsETNfor the SET-LRP of MA initiated by MBP in various solvents
and binary mixtures of solvents. Reaction conditions: MA = 1.0 mL, solvent 0.5 mL, [MA]o = 7.4 mol/L, [MA]o/[MBP]o/[Me6-TREN]o = 222/1/0.1, Cu0 = 12.5 cm of 20
gauge wire. ...... ...526 Figure 7.20 – kpappvs ETN for mixtures of DMSO, DMF, and DMAC with acetone and
EC. The dashed line corresponds to the trend line observed for binary mixtures of DMSO, DMF, DMAC, acetone, and NMP with water. ...... ...527 Figure 7.21 – Comparison of homolytic and heterolytic dissociation processes for methyl acrylate model compounds.. ...... ...531 Figure 7.22 – Radical-anion formed via outer-sphere heterolytic dissociation of
MeSO2Cl....... ...531 Figure 7.23 – Simple Onsager triangle analysis of SET-LRP...... ...539 Figure 7.24- Full Mechanism of SET-LRP involving all heterogenous and homogenous
processes....... ...541 Figure 7.25- SET-LRP and SET-DTLRP in Context of other LRP techniques..... ...544
Chapter 8
Figure 8.2 – Relative Energies of [CuIIX(NH3)4]+ complexes....... ...567 Figure 8.3 – XRD (left) and DFT(right) Models of CuII(Me6-TREN)Br+....... ...570 Figure 8.4 – Ligands used in this computational study........ ...571 Figure 8.5– Equilibrium Geometries and Energies of [CuI/L] + complexes........ ...573 Figure 8.6 – Heats of Formation of [CuI/L]+ Complexes - tetrahedral (striped), square
planar (black), trigonal pyramidal. (white)........ ...574 Figure 8.7 – Equilibrium Geometries of [CuIIX/L]2+ complexes Equilibrium Geometries
of [CuIIX/L]2+ complexes ...577 Figure 8.8 – Stabilization Energies of Cu(II)X/L complexes, X=Cl,Br,I ...578 Figure 8.9 – Heats of Formation for [CuIIX/L]+ complexes ...580 Figure 8.10 – Equilibrium Geometries and Energies of [CuII/L]2+ complexes ...582 Figure 8.11 – Heats of Formation for CuII/L complexes ...583 Figure 8.12 – Heats of X dissociation in [CuIIX/L ]+ complexes ...584 Figure 8.13 – Difference in Stabilization of [CuI/L]+ and [CuIIX/L]+ complexes ...586 Figure 8.14 – Heats of Disproportionation of [CuI/L]+ to Cu0 and [CuIIX/L] ...587 Figure 8.15 – UV-VIS Study of Disproportionation, 0.01 mmol of CuI or CuII in 0.01 mL of solvent after 10 min at 25 ºC ...589 Figure 8.16 – Basic Steps in ATRP ...590 Figure 8.17 – Net Energy at Each Reaction Step in ATRP ...591 Figure 8.18 – Basic Steps in SET-LRP ...593 Figure 8.19 – Net Energy at Each Reaction Step in SET-LRP ...594
Chapter 9
Figure 9.1 – The proposed mechanisms of SET-LRP....... ...600 Figure 9.2 – Taube inner and outer-sphere electron-transfer....... ...603 Figure 9.3 – Intersections of repulsive and attractive (sticky) Morse potentials... ...609 Figure 9.4 – Heterolytic bond dissociation energies and radical anion formation energies
for VAc-X and VC-X... ...612 Figure 9.5 – Model dormant species (Pn-X), initiators, and their designations (X=F, Cl,
Br, I)... ...616
xxxiv Figure 9.7 – Calculated energy profiles for CH3CH2X and CH3CH2X-... ...623 Figure 9.8 – Calculated energy profiles for iPr-X... ...624 Figure 9.9 – Calculated energy profiles of C(CH3)3X... ...625 Figure 9.10 – Savéant model of haloacetonitriles at the B3LYP/CEP-121G level... 628 Figure 9.11 – Calculated energy profiles for HAN-X performed at the B3LYP/6-31+G*
level ...629 Figure 9.12 – Molecular structures (top), charge (middle) and spin (bottom) densities for
neutral HAN-Br (left) and radical anion HAN-Br (right). ...630 Figure 9.13 – Calculated energy profiles for MA-X / Methyl X-propionoate. ...631 Figure 9.14 – Calculated energy profile of chloroacetamide for comparison with cyclic
voltammetry. ...632 Figure 9.15 – Calculated energy profiles of MMA-X.. ...632 Figure 9.16 – Calculated energy profiles for HAN-X. ...635 Figure 9.17 – Calculated energy profiles of AN-X... ...636 Figure 9.18 – Calculated energy profiles of MAN-X... ...637 Figure 9.19 – Calculated energy profiles of MCA-X... ...639 Figure 9.20 – Calculated energy profiles of VF-X... ...641 Figure 9.21 – Calculated energy profiles of VC-X... ...642 Figure 9.22 – Calculated energy profiles of VB-X... ...642 Figure 9.23 – Calculated energy profiles of VI-I... ...643 Figure 9.24 – Calculated energy profiles of CP-X... ...643 Figure 9.25 – Calculated energy profiles of VAc-X... ...644 Figure 9.26 – Calculated energy profiles of CH2X2... ...647 Figure 9.27 – Calculated energy profiles of CHX3... ...648 Figure 9.28 – The symmetric VC-Cl anion radical and ion/radical pair.... ...650 Figure 9.29 – Calculated energy profiles of S-X... ...653 Figure 9.30 – Calculated energy profiles for Bn-X.... ...654 Figure 9.31 – Calculated energy profiles for PhSO2-X.... ...655 Figure 9.32 – Calculated energy profiles for head-to-head (Left) and head-to-tail (Right)
Figure 9.33 – Calculated energy profiles of dimeric models for dormant propagating macroradicals ...661 Figure 9.34 – Revised mechanism of SET-LRP incorporating sticky dissociation. ...666
Chapter 10
Figure 10.1 – The Mechanism of SET-LRP.... ...672 Figure 10.2 – UV-vis spectra of the solution of Cu(I)Br ([Cu(I)Br] = 0.00333 M) in the
presence of varying amounts of Me6-TREN relative to Cu(I)Br in DMSO (a) or 10%
H2O in DMSO (c) as solvent and the absorbance at the 960 nm maximum (blue dots)
and the corresponding conversion of Cu(I)Br into Cu(0) and Cu(II) (red diamonds) in DMSO (c) or 10% H2O in DMSO (d) as solvent . The dashed line represents either the
UV-vis spectrum of Cu(II)Br2 at the concentration ([Cu(II)Br2] = 0.00165 M) expected
if 100% disproportionation occurs or the absorbance intensity at the concentration of Cu(II)Br2 ([Cu(II)Br2] = 0.00165 M) expected from 100% disproportionation... .679 Figure 10.3 – Comparison of experimental UV-vis spectra of the disproportionation of
Cu(I)Br in DMSO as a function of the equivalents of Me6-TREN (black circles) with
the extent of disproportionation predicted by numerically solving the equilibrium expression (blue squares) or through modeling of the disproportionation through ordinary differential equations (red diamonds) ...679 Figure 10.4 – UV-vis spectra of the solution of Cu(I)Br ([Cu(I)Br] = 0.00333 M) in the
presence of varying amounts of Me6-TREN relative to Cu(I)Br in DMF (a) or 10%
H2O in DMF (c) as solvent and the absorbance at the 960 nm maximum (blue dots)
and the corresponding conversion of Cu(I)Br into Cu(0) and Cu(II) (red diamonds) in DMSO (b) or 10% H2O in DMF (d) as solvent. The dashed line represents either the
UV-vis spectrum of Cu(II)Br2 at the concentration ([Cu(II)Br2] = 0.00165 M) expected
if 100% disproportionation occurs or the absorbance intensity at the concentration of Cu(II)Br2 ([Cu(II)Br2] = 0.00165 M) expected from 100% disproportionation. ...685 Figure 10.5 – UV-vis spectra of the solution of the Cu(I)Br ([Cu(I)Br] = 0.00333 M) in
the presence of varying amounts of Me6-TREN relative to Cu(I)Br in DMAC (a) or
NMP (c) as solvent and the absorbance at the 960 nm maximum (blue dots) and the corresponding conversion of Cu(I)Br into Cu(0) and Cu(II) (red diamonds) in DMAC (b) or NMP (d) as solvent. The dashed line represents either the UV-vis spectrum of Cu(II)Br2 at the concentration ([Cu(II)Br2] = 0.00165 M) expected if 100%
disproportionation occurs or the absorbance intensity at the concentration of Cu(II)Br2
xxxvi Figure 10.6 – UV-vis spectra of the solution of Cu(I)Br ([Cu(I)Br] = 0.00333 M) in the
presence of varying amounts of Me6-TREN relative to Cu(I)Br in acetone (a) or
acetone/ 10% H2O (c) as solvent and the absorbance at the 960 nm maximum (blue
dots) and the corresponding conversion of Cu(I)Br into Cu(0) and Cu(II) (red diamonds) in acetone (b) or acetone/ 10% H2O (d) as solvent. The dashed line
represents either the UV-vis spectrum of Cu(II)Br2 at the concentration ([Cu(II)Br2] =
0.00165 M) expected if 100% disproportionation occurs or the absorbance intensity at the concentration of Cu(II)Br2 ([Cu(II)Br2] = 0.00165 M) expected from 100%
disproportionation. ...689 Figure 10.7 – UV-vis spectra of the solution of Cu(I)Br ([Cu(I)Br] = 0.00333 M) in the
presence of varying amounts of Me6-TREN relative to Cu(I)Br in EC (a) or PC (c) as
solvent and the absorbance at the 960 nm maximum (blue dots) and the corresponding conversion of Cu(I)Br into Cu(0) and Cu(II) (red diamonds) in EC (b) or PC (d) as solvent. The dashed line represents either the UV-vis spectrum of Cu(II)Br2 at the
concentration ([Cu(II)Br2] = 0.00165 M) expected if 100% disproportionation occurs
or the absorbance intensity at the concentration of Cu(II)Br2 ([Cu(II)Br2] = 0.00165
M) expected from 100% disproportionation.. ...689 Figure 10.8 – UV-vis spectra of the solution of Cu(I)Br ([Cu(I)Br] = 0.00333 M) in the
presence of varying amounts of Me6-TREN relative to Cu(I)Br in MeOH (a), MeOH/
10% H2O (c), or EtOH (e) as solvent and the absorbance at the 960 nm maximum
(blue dots) and the corresponding conversion of Cu(I)Br into Cu(0) and Cu(II) (red diamonds) in MeOH(b), MeOH/ 10% H2O (d) or EtOH (f) as solvent. The dashed line
represents either the UV-vis spectrum of Cu(II)Br2 at the concentration ([Cu(II)Br2] =
0.00165 M) expected if 100% disproportionation occurs or the absorbance intensity at the concentration of Cu(II)Br2 ([Cu(II)Br2] = 0.00165 M) expected from 100%
disproportionation... ...693 Figure 10.9 – UV-vis spectra of the solution of Cu(I)Br ([Cu(I)Br] = 0.00333 M) in the
presence of varying amounts of Me6-TREN relative to Cu(I)Br in H2O as solvent and
the absorbance at the 960 nm maximum (blue dots) and the corresponding conversion of Cu(I)Br into Cu(0) and Cu(II) (red diamonds) in H2O as solvent (b). The dashed
line represents either the UV-vis spectrum of Cu(II)Br2 at the concentration
([Cu(II)Br2] = 0.00165 M) expected if 100% disproportionation occurs or the
absorbance intensity at the concentration of Cu(II)Br2 ([Cu(II)Br2] = 0.00165 M)
expected from 100% disproportionation. ...693 Figure 10.10 – Particle Size Distributions for Cu(0) prepared via disproportionation in
DMSO with 1.0 equivalents of Me6-TREN (a), DMSO with 0.5 equivalents of Me6