University of Pennsylvania
ScholarlyCommons
Publicly Accessible Penn Dissertations
Summer 8-14-2009
Multiscale Modeling of Electrocatalysis
Liang Qi
University of Pennsylvania, liangqi@seas.upenn.edu
Follow this and additional works at:http://repository.upenn.edu/edissertations
Part of theMaterials Chemistry Commons,Other Materials Science and Engineering Commons, and thePhysical Chemistry Commons
This paper is posted at ScholarlyCommons.http://repository.upenn.edu/edissertations/14
For more information, please contactlibraryrepository@pobox.upenn.edu.
Recommended Citation
Multiscale Modeling of Electrocatalysis
Abstract
In proton-exchange-membrane (PEM) fuel cells, electrochemical oxygen reduction reaction (ORR) on the cathode is a critical step at which large energy loss occurs. Theoretical tools at different scales are discussed in this thesis in order to find ORR catalysts with both higher activity and better durability than current Pt and Pt alloys. For catalytic activity, a relatively simple model reaction, ORR by hydrogen molecule under ultra-high-vacuum (UHV) conditions, is studied by first-principles methods on various metallic surfaces, which shows that good catalytic activities of Pt and its alloys originate from moderate adsorption strengths for atoms and molecules involved in the reaction. Then first-principles methods are also applied to study the reaction mechanisms of electrochemical ORR: detailed analyses in the electronic structures of ORR intermediates confirm that all the electron transfers in ORR occur through proton-coupled electron transfer (PCET) mechanism, which is accomplished by proton transfer along hydrogen-bond network from hydrated proton (hydronium) to ORR intermediates on the surface. Furthermore, first-principles methods are also used to search and design new alloy surfaces with optimal activity based on a simple kinetic model. However, the inaccuracy of this simple model makes a comprehensive multiscale ORR model necessary. Thus, a reaction network of ORR elementary steps on limited surface sites is built, and the steady-state solutions provide current density j at given electrode potential U; then a multiscale model of electrode-electrolyte interfacial structure is proposed for function U (σM), where σM is excess surface electron density on metallic electrode; finally, we discuss the principles to achieve a self-consistent multiscale ORR model to output both U and current I to the external circuit. For the stability of Pt as catalyst, we study its surface oxide formation and surface adatom diffusion, which result in the corrosion and coarsening of Pt nanocrystals respectively. It is found that different anti-corrosion stabilities of Pt facets can be explained by their maximum abilities to keep oxygen atoms adsorbed on the top surface layer, and Pt adatom diffusion barriers change with the surface coverage conditions at different U.
Degree Type
Dissertation
Degree Name
Doctor of Philosophy (PhD)
Graduate Group
Materials Science & Engineering
First Advisor
Ju Li
Keywords
Subject Categories
ACKNOWLEDGEMENT
I would like to express my deepest thanks to my advisor and mentor, Professor Ju Li, for his
unlimited support and insightful guidance. He has taught me not only wealth of knowledge
and techniques, but also how to be a devoted scientist.
I would like to thank Prof. Vasek Vitek, Prof. Andrew M. Rappe and Prof. Christopher
B. Murray for serving on my thesis committee. It is a great honor for me to receive
invalu-able suggestions from these outstanding scientists. Their deep insights will lead my work
to a higher level.
Many thanks to members of our Material Theory Group. I would like to thank Mr.
Joshua Fujiwara, who brings me a lot of information and knowledge on fuel cell research
and industry. I would like to thank Dr. Xiaofeng Qian, who treats me like a brother and
teaches me a lot on density functional theory and programming. I would like to thank Dr.
Jianguo Yu, who taught me basic modeling techniques when I was a fresh graduate student.
I would like to thank Dr. Erik Bitzek, who makes a good organization to build and maintain
our new computer cluster, where I ran a large amount of jobs for my thesis. I would like to
thank Dr. Ji Feng, who teaches me a lot on electronic structures and helps me submit our
paper when I was busy with my thesis. I would like to thank Amit Samanta, with whom I
share the graduate student experience. I would like to thank Liu Cao, Zheng Li, Wei Liu
and Wenbin Li; all of you give me a lot of help and support.
I would like to thank Mr. Mitsumoto Kawai for offering me an exciting internship
experience at Honda Research Institute in Tokyo. I also would like to express my sincere
thanks to my friends at Ohio State University and Upenn: Ning Zhou, Weiqi Luo, Wei Cai,
···; with all of you I have an enjoyable life in Columbus and Philadelphia.
Last, I would like to express my heartfelt gratitude to my parents. All of my
ABSTRACT
MULTISCALE MODELING OF ELECTROCATALYSIS
Liang Qi
Dr. Ju Li
In proton-exchange-membrane (PEM) fuel cells, electrochemical oxygen reduction
reac-tion (ORR) on the cathode is a critical step at which large energy loss occurs. Theoretical
tools at different scales are discussed in this thesis in order to find ORR catalysts with
both higher activity and better durability than current Pt and Pt alloys. For catalytic
ac-tivity, a relatively simple model reaction, ORR by hydrogen molecule under
ultra-high-vacuum (UHV) conditions, is studied by first-principles methods on various metallic
sur-faces, which shows that the good catalytic activities of Pt and its alloys originate from
moderate adsorption strengths for atoms and molecules involved in the reaction. Then
first-principles methods are also applied to study the reaction mechanisms of
electrochem-ical ORR: detailed analyses in the electronic structures of ORR intermediates confirm that
all the electron transfers in ORR occur through proton-coupled electron transfer (PCET)
mechanism, which is accomplished by proton transfer along hydrogen-bond network from
hydrated proton (hydronium) to ORR intermediates on the surface. Furthermore,
first-principles methods are also used to search and design new alloy surfaces with optimal
ac-tivity based on a simple kinetic model. However, the inaccuracy of this simple model makes
a comprehensive multiscale ORR model necessary. Thus, a reaction network of ORR
ele-mentary steps on limited surface sites is built, and the steady-state solutions provide current
density j at given electrode potential U ; then a multiscale model of electrode/electrolyte
interfacial structure is proposed for function U(σM), whereσM is excess surface electron
multiscale ORR model to output both U and current I to the external circuit. For the
sta-bility of Pt as catalyst, we study its surface oxide formation and surface adatom diffusion,
which result in the corrosion and coarsening of Pt nanocrystals respectively. It is found that
different anti-corrosion stabilities of Pt facets can be explained by their maximum abilities
to keep oxygen atoms adsorbed on the top surface layer, and Pt adatom diffusion barriers
Contents
1 Introduction 1
1.1 Background . . . 1
1.2 Detailed Outline . . . 5
2 Fundamental Concepts and Modeling Methodologies 8 2.1 Models of Solid Surface . . . 8
2.2 Fundamental Concepts in Electrochemistry . . . 10
2.2.1 Electrode Potential . . . 10
2.2.2 Electrical Double Layer . . . 12
2.2.3 Electrode Reaction . . . 18
2.3 Materials Modeling Methodologies . . . 21
2.3.1 Density Functional Theory . . . 21
2.3.2 Kinetic Monte Carlo Simulation . . . 24
3 Oxygen Reduction at Vacuum Conditions–the Origin of Catalytic Activity 27 3.1 Oxygen Reduction on Pt (111) Surface . . . 28
3.1.1 Computational Methods . . . 30
3.1.2 O2Adsorption and Dissociation on Pt (111) Surface . . . 32
3.1.3 Reaction Paths on Pt(111) Surface . . . 36
3.2.1 Adsorption on Cu (111) and Au (111) Surfaces . . . 43
3.2.2 Reaction Paths on Cu (111) Surface . . . 45
3.2.3 Reaction Paths on Au (111) Surface . . . 47
3.3 Oxygen Reduction on (111) Surface of Pt Alloys . . . 50
3.3.1 Adsorptions on (111) Surfaces of Pt Alloys . . . 53
3.3.2 Reaction Paths on (111) Surface of Pt Alloys . . . 57
4 First-Principles Studies of Electrochemical Oxygen Reduction Reaction 61 4.1 Electronic Structures of Intermediates in ORR . . . 65
4.1.1 Charge States on O∗2 . . . 67
4.1.2 Charge States of other ORR Intermediates . . . 78
4.2 Dynamics of Proton-Coupled Electron Transfer in ORR . . . 90
4.2.1 PCET on Pt (111) Surfaces . . . 93
4.2.2 General Pictures of PCET Dynamics . . . 99
4.3 Search of New Catalysts by First-Principles Methods . . . 102
4.3.1 Combinatorial Search of Noble Metal Alloys . . . 103
4.3.2 Pt Surface + Au Clusters . . . 108
5 Multiscale Modeling of Electrochemical Reactions 113 5.1 Kinetic Model . . . 114
5.1.1 Mean Field Model . . . 117
5.1.2 Results of Pt (111) and (100) Surfaces . . . 130
5.1.3 Sensitivity Analysis . . . 142
5.1.4 Discrete Model . . . 155
5.2 Model of Electrode-Electrolyte Interfacial Structures . . . 159
5.2.1 Electrode Potential and Differential Capacitance . . . 161
5.3 Principles of Self-Consistent Multiscale Model . . . 169
6 Stability of Catalysts 173 6.1 Oxide Formation on Pt Surfaces . . . 173
6.1.1 Computational Method . . . 176
6.1.2 Oxidation on Pt(111) Surface . . . 181
6.1.3 Oxidation on Pt(100) Surface . . . 188
6.1.4 Oxidation on Pt(210) Surface . . . 195
6.1.5 Oxidation and Polarization Curves on Different Surfaces . . . 198
6.2 Coarsening of Pt Nanocrystals . . . 200
6.2.1 Pt Adatom Diffusion . . . 201
7 Summary and Future Work 205 7.1 Summary . . . 205
7.2 Future Work . . . 208
List of Tables
2.1 Debye length for an aqueous solution with completely dissociated 1-1
elec-trolyte at room temperature T = 300 K andε=78.4. Copying from Table
3.1 in reference [115]. . . 15
3.1 O∗2 geometry in (√3×2) unit cell. The data in brackets are from
Eich-ler’s results[24]. Here O2-surface distance is the perpendicular distance
between O2molecule center and surface plane. O2 tilt angle is formed by
O2molecular axis and surface plane, so 0◦means O2is parallel to surface.
All lengths are in ˚A and angles in degree. . . 33
3.2 O2adsorption energy on different sites and unit cells. The data in brackets
are from Eichler’s results[24]. Here 2fcc (2hcp) means O2already
dissoci-ates into two O atoms in neighbor fcc (hcp) sites. All results are in eV. . . . 33
3.3 Geometries of O∗2 dissociation paths in (2√3×4) unit cell. As Fig. 3.2
shows, Oa(Ob) is the left(right) oxygen atom in the initial state. Here dO-O
is the distance between two oxygen atoms. dPt-O is the distance between O atom and its nearest Pt atom. dz is the perpendicular distance between O
atom and Pt surface. I, T1(T2) and F1(F2) stand for the initial, transition
3.4 The reaction energy (∆E) and activation barrier (Ea) of reaction path of
wa-ter formation from O∗and H∗atoms. Data in brackets are from Michaelides
and Hu[85]. . . 36
3.5 Geometries of initial (I), transition (T) and final (F) states of reaction (3.1)
in (√3×2) unit cell. The notation follows Table 3.3. All lengths are in ˚A. . 38
3.6 Geometries of initial (I), transition (T) and final (F) states of reaction (3.2)
in (√3×2) unit cell. There are two H atoms and Ha is the one which is
initially absorbed separately on Pt surface. The notation follows Table 3.3.
All lengths are in ˚A. . . 38
3.7 The reaction energy (∆E) and activation barrier (Ea) of reaction path of
water formation from O∗2molecule and H∗atom. . . 39
3.8 Geometries of initial (I), transition (T) and final (F) states of reaction (3.4)
in (√3×2) unit cell. There are two O atoms: Oais the one which is finally
connected with H atom, and Obis the other one. The notation follows Table
3.3. All lengths are in ˚A. . . 40
3.9 Geometries of initial (I), transition (T) and final (F) states of reaction (3.5)
in (√3×2) unit cell. There are two O atoms: Oais the one which is initially
connected with H atom, and Obis the other one. Similarly, Hais the H atom
initially connected with O atom and Hb is the other. The notation follows
Table 3.3. All lengths are in ˚A. . . 40
3.10 The adsorption energies of surface intermediates at different sites in a (√3×2)
unit cell of Pt(111) from Section 3.1. . . 44
3.11 The reaction energies (∆E) and activation barriers (Ea) of oxygen reduction
on Cu (111) surface at UHV conditions. . . 46
3.12 The reaction energy (∆E) and activation barrier (Ea) of reaction path of
3.13 The equilibrium lattice constant c0and the corresponding magnetization m
obtained from VASP calculations for pure Pt and Pt3M alloys . . . 52
3.14 The adsorption energy of surface intermediates at different sites in a (√3×2)
unit cell of Pt(111) from Section 3.1. N/A means the surface intermediates
are quite unstable at the corresponding site compared with other sites. All
results are in eV. . . 53
3.15 The adsorption energy of O2, E O∗2
ads, at different sites of Pt3MPt (111)
sur-faces. Here all letters with subscripts mean symmetric adsorption sites
shown in Fig. 3.14 and all results are in eV. . . 53
3.16 The adsorption energy of O atom, EO∗
ads, at different sites of Pt3MPt (111)
surfaces. Here all letters with subscripts mean symmetric adsorption sites
shown in Fig. 3.14 and all results are in eV. . . 54
3.17 The adsorption energy of OH, EadsOH∗, at different sites of Pt3MPt (111)
sur-faces. Here all letters with subscripts mean symmetric adsorption sites
shown in Fig. 3.14 and all results are in eV. . . 54
3.18 The adsorption energy of H atom, EH∗
ads, at different sites of Pt3MPt (111)
surfaces. Here all letters with subscripts mean symmetric adsorption sites
shown in Fig. 3.14 and all results are in eV. . . 56
3.19 The adsorption energy of O atom at fcc hollow site on (111) surface of Pt
under the same lattice constant with Pt3M alloy and its contribution ratio
Cstrain to the total adsorption energy change during alloying. All energy
results are in eV. . . 57
3.20 The activation energetics for every elementary step in oxygen reduction at
UHV conditions on Pt3MPt (111) surface, starting from oxygen
3.21 The activation energetics for every elementary step in oxygen reduction at
UHV conditions on Pt3MPt (111) surface, starting from OOH formation.
All results are in eV. . . 58
4.1 DFT-PBE-PAW optimized ORR intermediates on Pt(111): the adsorption
site, the equilibrium bond length b between two O atoms (except OH,
where b is measured between O and H), shortest vertical distance z
be-tween adsorbates and surface, adsorption energy Eads (references are the
same intermediates in relaxed and isolated states plus relaxed clean
sur-face), magnetic moment m of total unit cell, maximum stretching frequency
νmax of adsorbates, and induced vertical electric dipole Pz. . . 68
4.2 Work function of Pt (111) surface with O∗2: O2coverageθO2, work function
W and the change relative to clean surfaceδW . . . 69
4.3 LSDA+U calculation of charge transfer for O∗2 at bridge site on Pt (111)
surface, where Dudarevs formula of on-site Coulomb interaction is applied
to p orbitals of each oxygen atom [23]: on-site Coulomb and exchange
pa-rameters U-J, the energy gap between LUMO and HOMO for isolated O2,
spin-up charge transfer ∆N↑, spin-down charge transfer ∆N↓, total charge
transfer ∆N, induced vertical electric dipole Pz and magnetic moment m∗
of O∗2. . . 77
4.4 Charge transfer results for ORR intermediates adsorbed on Pt (111)
sur-face: the adsorption site, magnetic moment m of isolated intermediates,
spin-up charge transfer ∆N↑, spin-down charge transfer ∆N↓, total charge
transfer∆N, magnetic moment m∗of adsorbed intermediates, and induced
4.5 Reaction energyδE and reaction energy Eaof PCET near Pt (111) surface
by using the configurations shown in Fig. 4.12 . . . 95
4.6 Reaction energy δE and reaction energy Ea of PCET to O∗ near Au, Ni,
Pt, Cu and Al (111) surface by using the configuration shown in Fig. 4.12
(c) (H3O(H2O)2+O∗→OH∗+(H2O)3). δEO∗→OH∗ is the reaction energy of
Eq. 4.17. . . 100
6.1 Energies E and free energies G of molecules from DFT calculations plus
List of Figures
1 . . . i
2.1 Models of solid surface. (a) Example of a cluster model, a 55-atom Pt
clus-ter in FCC lattice structure, where both (100) and (111) facets are shown.
(b) and (c): Top and side view of a slab model, a (4×4) Pt (111) surface
in FCC lattice structure composed of 4 (111) layers. . . 9
2.2 Illustration of electrode potential and absolute electrode potential. Here
Fermi level of the electrode, EF, equals the energy level of highest
occu-pied molecular orbital (HOMO) of A, so reaction of A++e− ↔A is at thermodynamic equilibrium. Estaticis the average electrostatic energy of an
electron in the electrolyte and vacuum, respectively. . . 11
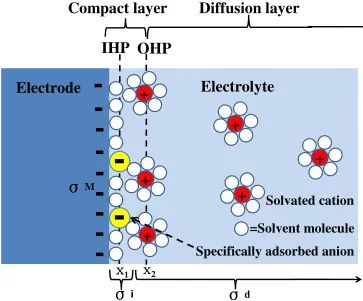
2.3 Illustration of electrical double-layer structure under conditions where
an-ions are specifically adsorbed, copying from Fig. 1.2.3 in reference [7]. . . 13
2.4 Potential distribution of electrical double layer by Gouy-Chapman-Stern
(GCS) model. Meanings of difference signs are explained in the caption of
Fig. 2.3. . . 17
2.5 Pathway of a general electrode reaction O + ne− ↔ R. Here Obulk/Rbulk
stands for O/R in the bulk electrolyte, Osurf/Rsurf stands for O/R near the
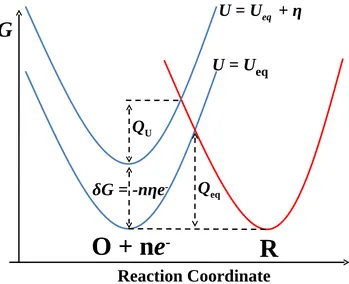
2.6 Effect of an overpotentialη on activation free energy of reaction O + ne−
→ R. Here Ueq is the equilibrium potential. Qeq/QU is the corresponding
activation free energy when U is Ueq/(Ueq + η). Here η is negative to
increase the free energy of the reactant (O + ne−). . . 20
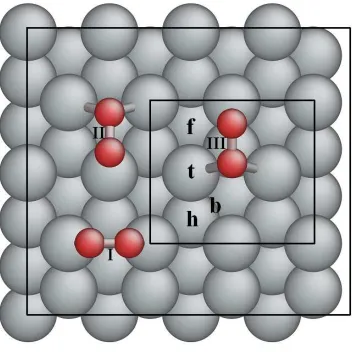
3.1 Surface cell and short-hand notation of special sites, where there are three
O∗2 adsorbed on bridge, fcc and hcp hollow site, respectively. The larger
rectangle stands for (2√3×4) unit cell and the smaller one is for (√3×2). . 31
3.2 The initial, transition and final states for the reaction path of O2dissociation
(O∗2→2O∗) in (2√3×4) unit cell. Although initial states are both O∗2 at
bridge site, (a) shows the path to the final state with two O atoms at fcc
sites and (b) shows the path to the final state with two O atoms at hcp sites. 35
3.3 The initial, transition and final states for the reaction path of OH formation
(O∗+H∗→OH∗) in (√3×2) unit cell. . . 37
3.4 The initial, transition and final states for the reaction path of H2O formation
(OH∗+H∗→H2O∗) in (
√
3×2) unit cell. . . 37
3.5 The initial, transition and final states for the reaction path of OOH
forma-tion (O∗2+H∗→OOH∗) in (√3×2) unit cell. . . 39
3.6 The initial, transition and final states for the reaction path of 2OH formation
(OOH∗+H∗→2OH∗) in (√3×2) unit cell. . . 40
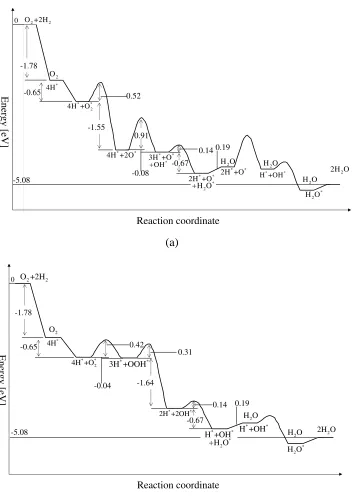
3.7 The whole reaction path of water formation: (a) shows the path starting by
dissociation of O∗2, (b) shows the path starting by formation of OOH∗. . . . 42
3.8 The initial, transition and final states for the reaction path of O2dissociation
(O∗2→2O∗) in (√3×2) unit cell of Cu (111) surface. . . 45
3.9 The initial, transition and final states for the reaction path of OH formation
3.10 The initial, transition and final states for the reaction path of H2O formation
(OH∗+H∗→H2O) in (
√
3×2) unit cell of Cu (111) surface. . . 46
3.11 The initial, transition and final states for the reaction path of OOH
forma-tion (O∗2+H∗→OOH∗) in (√3×2) unit cell of Au (111) surface. . . 48
3.12 The initial, transition and final states for the reaction path of 2OH formation
(OOH∗+H∗→2OH∗) in (√3×2) unit cell of Au (111) surface. . . 49
3.13 The initial, transition and final states for the reaction path of H2O formation
(OH∗+H∗→H2O) in (
√
3×2) unit cell of Au (111) surface. . . 49
3.14 Unit cell of Pt3M (111) surface and short-hand notation of special sites(ti
-top, bi-bridge, fi-fcc hollow and hi-hcp hollow). Here subscripts stand for
different sites because of different nearby atoms. . . 52
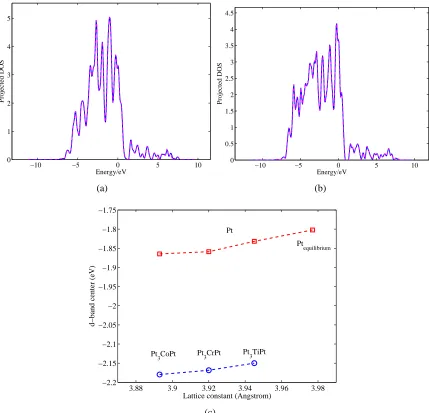
3.15 Projected density of states of Pt atoms at the top layer of Pt(a), Pt3CoPt(b)
(111) surfaces, where solid lines stand for spin-up d-band and dashed line
for spin-down d-band, and zero point means Fermi energy level. (c) shows
the shift of d-band center for these alloys surface and pure Pt surface with
the same lattice constant of the corresponding alloy. . . 55
4.1 (a) Configurations of two chemisorbed O2molecular precursors at the bridge
4.2 Charge/spin-charge difference density ∆ρ/∆ρσ along the surface normal
direction z for O∗2 at bridge (a) and fcc hollow (b) site on Pt (111)
sur-face. Black squares/circles stand for the z-coordinates of Pt/oxygen atoms
and vertical dash lines stand for the middle position between highest Pt
and lowest O atoms. The isosurfaces of ∆ρ↑ and ∆ρ↓ are plotted inside
each sub-figure using XCySDen[62], where yellow and blue means
posi-tive and negaposi-tive change respecposi-tively. The isovalues for all the isosurfaces
are±0.04 e ˚A−3. . . 72
4.3 Projected DOS of O∗2at bridge (a) and fcc hollow (b) sites on Pt (111)
sur-face. Fermi energy is zero and spin-down states are plotted as negative.
Isosurfaces of the real part of Bloch eigenfunctions Re(ψn~k)at~k= [18 1 80]
of the first Brillouin zone are plotted for certain unoccupied peaks, as
la-beled in each subfigure. The absolute isovalues for all the isosurfaces are
1
3 of the maximum absolute values of Re(ψn~k)and yellow/blue means pos-itive/negative value. For bridge-site case (a), the isosurfaces of ψ1(n=90,
ε=0.54 eV) and ψ3(n=89, ε=0.65 eV) behave as spin-up/down π⊥⋆, while
spin-downψ2(n=90,ε=0.32 eV) has the shape ofπk⋆. For fcc-site case (b),
isosurface ofψ1/ψ3(n=89,ε=0.35 eV) behaves as spin-up/downπk⋆, while
ψ2/ψ4(n=90,ε=0.52 eV) is similar to spin-up/downπ⊥⋆. . . 74
4.4 Electron transfer∆N and induced dipole Pzof O∗2at bridge site versus (111)
surface workfunction of different metals. The bond length of O∗2 and its
distance to the top surface layer are fixed as the optimized values on Pt(111). 75
4.5 The integration and contours of charge/spin-charge difference density∆ρ/∆ρσ
for ORR intermediates on Pt(111) surface. (a) OOH∗at top site; (b) H2O∗2
at top site. Meanings of difference signs are explained in the caption of Fig.
4.6 The integration and contours of charge/spin-charge difference density∆ρ/∆ρσ
for ORR intermediates on Pt(111) surface. (a) OH∗ at top site; (b) O∗ at
fcc hollow site. Meanings of difference signs are explained in the caption
of Fig. 4.2 . . . 81
4.7 Projected DOS of OOH∗(a) and OH∗at top site on Pt (111) surface.
Mean-ings of difference signs are explained in the caption of Fig. 4.3. Isosurfaces
of the real part of Bloch eigenfunctions Re(ψn~k) at~k= [18180] of the first Brillouin zone are plotted for certain unoccupied peaks, as labeled in each
subfigure. For OOH∗case (a), the isosurfaces ofψ1(n=90,ε=0.40 eV) and
ψ2(n=90, ε=0.40 eV) behave as spin-up/down π⋆ on two oxygen atoms.
For OH∗case (b), isosurface ofψ1/ψ3(n=89,ε=0.96 eV) andψ2/ψ4(n=90,
ε=1.10 eV) are spin-up/down p orbitals of oxygen atom with component
both perpendicular and parallel to Pt surface. . . 82
4.8 (a) Difference contours for total charge density∆ρ, spin-up charge density
∆ρ↑and spin-down charge density∆ρ↓(from left to right) in the adsorption
process of oxygen atom at fcc hollow site on Pt (111) surface. (b)
Integra-tion of∆ρ,∆ρ↑and∆ρ↓in spherical shape with O∗’s position as the center.
x axis stands for the change of integration radius and y axis shows total
integration charge amounts. . . 84
4.9 (a) Configurations of the hexagonal mixed network monolayer of OH +
H2O monolayer [31, 111]. (b) Charge/spin-charge difference density∆ρ/∆ρσ
along the surface normal direction for OH + H2O monolayer. Meanings of
4.10 Changes of total charge transfer∆N (a) and induced dipole moment pZ (b)
with external electric field for ORR intermediates, where positive/negative
field means to increase/decrease electrostatic potential far away from the
surface with adsorbates. . . 89
4.11 Two structural models for hydronium. (a) an H9O+4 complex proposed by
Eigen[26]. (b) an H5O+2 complex proposed by Zundel[156]. . . 92
4.12 Side (a) and top (b) views of the coexistence of an H7O3 “hydronium”
on top of Pt (111) surface and an O∗2 nearby. (c)/(d) is the top view the
coexistence of an H7O3“hydronium” and an O∗/OH∗. All of them are used
as initial configurations to study PCET near Pt (111) surface. . . 94
4.13 From (a) to (f): the minimum energy path of O∗2+H++e− → OOH∗near Pt (111) surface, where (b) is the configuration of transition state. . . 96
4.14 From (a) to (f): the minimum energy path of O∗+H++e− → OH∗near
Pt (111) surface, where (d) is the configuration of transition state. . . 97
4.15 From (a) to (f): the minimum energy path of OH∗+H++e− → H2O near
Pt (111) surface, where the energy of each configuration keeps decreasing
from initial (a) to final (f) state. . . 98
4.16 Reaction path of proton-coupled electron transfer (PCET) A∗+ H++ e−→
AH∗. Here QPTis the activation free energy for proton transferred from the
hydronium in the bulk electrolyte to the hydronium near electrode surface;
δG is the reaction free energy of the whole reaction; H+∗means proton is
in the hydronium close to the electrode surface;β is symmetric factor and
4.17 (111) surface of noble metal alloys with alloying atom at (a) top layer and
(b) second top layer. In a (√3×2) unit cell there are four (111) layers and
16 atoms in total; 15 of them are basis element atoms in light color, the left
one is the alloying atom in dark color. . . 103
4.18 The activity and stability of (a) Pt and (b) Pd alloys in the structure of Fig.
4.17. The activity is shown along x-axis by the activation energy Ea of
ORR when U = 0.9 vs. SHE, and the stability is shown along y-axis by Ueq
for the corrosion of alloying element atoms. . . 106
4.19 The activity and stability of (a) Au and (b) Ag alloys in the structure of
Fig. 4.17. The activity is shown along x-axis by the activation energy Ea
of ORR when U = 0.9 vs. SHE, and the stability is shown along y-axis by
Ueqfor the corrosion of alloying element atoms. . . 107
4.20 Au clusters on Pt (111) surface. (a)∼(d) are (3×3) super cell of Pt (111)
surface with Au clusters composed of 3, 4, 7 and 10 Au atoms, respectively.
(e)∼(f) are the configurations of the adsorption of oxygen atom on those
Au clusters. . . 109
4.21 Au steps on Pt (111) surface. (a) oxygen atom is adsorbed on Pt surface
near Au steps, (b) oxygen atom is adsorbed Pt surface far from Au steps. . . 111
5.1 The relation between O2 adsorption energy E
O∗2
ads and O adsorption energy
EadsO∗ from DFT calculations. . . 128
5.2 (a) Surface coverage of ORR intermediates vs. electrode potential U on Pt
(111) surface at steady states. (b) Kinetic current density jk vs. electrode
5.3 (a) The ratio between reaction rate of each elementary step and that of
hy-droxyl protonation (HP) at steady states on Pt (111) surface at different U .
Activation free energy for each elementary step at (b) zero surface coverage
and (c) steady states on Pt (111) surface are also shown. . . 133
5.4 The reaction paths of ORR in different mechanisms by (a) O∗2direct
disso-ciation (DD) and (b) O∗2 associated dissociation (AD) on Pt (111) surface
at different electrode potentials (U = 0.7, 0.8 and 0.9 V, respectively.). The
dashed curves are the reaction paths at zero surface coverage, and solid
curves are paths at steady states. . . 135
5.5 (2×2) unit cell of Pt (100) surface with (a) O∗2, (b) O∗and (c) OH∗at the
bridge site. . . 136
5.6 (a) Kinetic current density jk vs. electrode potential U on Pt (100) surface
at steady states. (b) Surface coverage of ORR intermediates vs. electrode
potential U on Pt (100) surface at steady states. . . 138
5.7 (a)Simulated current density j=1/(1
jk+
1
jd)on Pt (111) and (100) surfaces under the diffusion-limited current density jd= 5 mA·cm−2. (b) The ratios
of jk and j between Pt (111) and Pt (100) surfaces. . . 139
5.8 The reaction paths of ORR in different mechanisms by (a) O∗2direct
disso-ciation (DD) and (b) O∗2 associated dissociation (AD) on Pt (100) surface
at different electrode potential (U = 0.7, 0.8 and 0.9 V respectively.). The
dashed curves are the reaction paths at zero surface coverage, and solid
5.9 Sensitivity of kinetic current density jkon adsorption energy of ORR
inter-mediates O∗and OH∗(a) without considering their lateral interactions (ζij∗∗
= 0 and[E]=[0]) and (b) considering their lateral interactions (ζij∗∗ 6=0 and
[E] 6= [0]). Here “A” means analytical results from Eq. 5.67, “N” means numerical results by calculating steady states at different h0i∗. . . 148
5.10 Maximum absolute value of elements in vector
∂~rI
∂h0i∗
relative to total
ORR rate ( jk·S0/e) for (a) no-enthalpic-interaction cases ([E]=0) and (b)
enthalpic-interaction cases ([E]6=0). . . 150 5.11 5 elements of 5×5 diagonal matrix [S] in Eq.5.77 for (a)
no-enthalpic-interaction cases ([E]=0) and (b) enthalpic-no-enthalpic-interaction cases ([E]6=0). . . 152 5.12 First two elements in vector[V]T
∂~rI
∂h0
i∗
relative to total ORR rate ( jk·S0/e)
for (a) no-enthalpic-interaction cases ([E]=0) and (b) enthalpic-interaction
cases ([E]6=0). . . 153 5.13 Magnitude of last three elements in vector[V]T
∂~rI
∂h0i∗
relative to total ORR
rate ( jk·S0/e) for (a) no-interaction cases ([E]=0) and (b)
enthalpic-interaction cases ([E]6=0). . . 154 5.14 Kinetic Monte Carlo (kMC) simulation of anodic polarization on Pt (111)
surface: (a) total integrated charge density vs. electrode potential. (b)
(√3×√3)lattice of O∗on Pt (111) surface, corresponding to the configu-ration when U ≈0.8∼1.0 V. (c) “Graphene-like” lattice of O∗on Pt (111)
surface, corresponding to the configuration when U ≈1.1∼1.3 V. . . 158
5.15 The symmetrical configuration of Pt-H2O interfaces to simulate the
5.16 Average (a) electron density and (b) electrostatic potential energy
differ-ences at certain excess surface electron densityσM along z-direction for
the 2-layer H2O configuration in Fig. 5.15. Here the green diamonds stand
for z-coordinates of Pt atoms at neutral system, while magenta circles stand
for z-coordinates of oxygen atoms at neutral system. . . 163
5.17 (a) Electrode potential changes∆U as function of excess surface electron
density σM. Here compact layer contribution ∆UH is calculated by DFT
methods from 2-layer H2O configuration in Fig. 5.15, and diffusion layer
contribution ∆UGC is calculated by Gouy-Chapman theory for the
com-pletely dissociated 1-1 electrolyte with the ion concentration varying from
1 M to 0.001 M. (b) The corresponding differential capacitance Cd. . . 165
5.18 The symmetrical configuration of interfaces between Pt (111) surface and
several layers of water molecules. . . 168
5.19 The functions of current density j from electrode reaction and incoming
electron flux jIfrom external circuit as electrode potential U . jsand Usare
the output of this electrode at a steady state. . . 170
5.20 A self-consistent simulator for a fuel cell system. σMa/σMc is the
ex-cess surface electron density on anode/cathode; Ua/Uc is the potential for
anode/cathode; ja/ jc is the current density from anode/cathode reaction;
UO/ jOis the output potential/current of the fuel cell; t is time. . . 172
6.1 Lattice structures for different types of Pt oxides. (a) PtO in tetragonal
lattice. (b)α-PtO2in hexagonal lattice. (c)β-PtO2in tetragonal lattice. . . 175
6.3 Changes of EdiffO / UdiffO for oxygen adsorption/absorption on Pt (111) surface
with oxygen coverageθO∗. The values of EdiffO and UdiffO are shown on the left
and right y-axis, respectively. (a) Adsorption/absorption of oxygen atoms
on (2×2) Pt (111) surface. The corresponding atomic configurations are
shown in Fig. 6.4. (b) Adsorption/absorption of oxygen atoms on (3×3) Pt
(111) surface. The corresponding atomic configurations are shown in Fig.
6.5. . . 183
6.4 Configurations of adsorption/absorption of oxygen atoms on (2×2) Pt (111)
surface. (a)-(d) Oxygen adsorption configurations whenθO∗ = 14,12,34 and 1
ML. (e)-(h) Absorption of one oxygen atom into tetrahedral site below the
top hcp hollow site whenθO∗ = 14,12,34 and 1 ML. . . 184
6.5 Configurations of adsorptions of oxygen atoms on (3×3) Pt (111) surface
whenθO∗ = 19, 13, 49, 23, 79 and 1 ML as shown from (a) to (f). . . 185
6.6 Epitaxial Oxide Layer on Pt (111) Surface. (a)-(b) top and side view of a
thin oxide layer on Pt (111) surface with 12 ML on fcc sites and 12 ML at
tetrahedral sites below the hcp sites. (c)-(d) top and side view of a thin
ox-ide layer on Pt (111) surface with 1 ML on fcc site and 1 ML at tetrahedral
sites. . . 187
6.7 Changes of EO
diff/ UdiffO for oxygen adsorption/absorption at Pt (100) surface
with oxygen coverageθO∗. The values of EdiffO and U O
diffare shown on the left
and right y-axis, respectively. (a) Adsorption/absorption of oxygen atoms
on (2×2) Pt (100) surface. The corresponding atomic configurations are
shown in Fig. 6.8. (b) Adsorption/absorption of oxygen atoms on (3×3) Pt
(100) surface. The corresponding atomic configurations are shown in Fig.
6.8 Configurations of adsorption/absorption of oxygen atoms on (2×2) Pt (100)
surface. (a)-(e) Oxygen adsorption configurations whenθO∗=14, 12, 34, 1 and
5
4ML. (f)-(j) Absorption of one oxygen atom into tetrahedral site below the
top hcp hollow site whenθO∗ = 14, 21, 34, 1 and 54 ML. . . 191
6.9 Configurations of adsorptions of oxygen atoms on (3×3) Pt (100) surface
whenθO∗ = 19, 13, 94, 23, 79, 1 and 109 ML as shown from (a) to (g). . . 192
6.10 Epitaxial Oxide Layer on Pt (100) Surface. (a)-(b) top and side view of a
thin oxide layer on Pt (100) surface with 1 ML at bridge sites and 1 ML at
tetrahedral sites just below the oxygen atoms on top layer. . . 194
6.11 Lattice structures of Pt (210) surface. (a) Side view of Pt (210) surface,
composed of small Pt (100) facets. (b) Top view of Pt (210) surface, where
√
5×2 unit cell is shown in solid-line rectangle. There are also signs for
Pt surface atoms with different CNs: A with CN = 6, B with CN = 9 and C
with CN = 11. . . 195
6.12 Configurations of adsorptions of oxygen atoms on (√5×2) Pt (210)
sur-face. (a)-(l) Oxygen adsorption configurations when θO∗ increase from 14
to 3 ML by constant increment of 14ML. . . 196
6.13 Changes of EO
diff/ UdiffO for oxygen adsorption at Pt (210) surface with oxygen
coverage θO∗. The values of EdiffO and UdiffO are shown on the left and right
y-axis, respectively. The corresponding atomic configurations are shown
in Fig. 6.12. . . 197
6.14 Curves of total charge transfer Q vs. electrode potential U on different Pt
surfaces. U reaches the starting point of bulk oxide formation on Pt (111)
and (100) surfaces; on Pt (210), even when U = 1.4 V, oxygen adsorption
6.15 Minimum energy path of Pt adatom diffusion on clean Pt (111) surface.
The curved arrows in the initial configuration shows the diffusion path of
Pt atom from one fcc hollow site to a nearby fcc site. . . 202
6.16 Minimum energy path of Pt adatom diffusion on Pt (111) surface with 14
Chapter 1
Introduction
1.1
Background
A fuel cell is an electrochemical energy conversion device. It produces electricity from
chemical reaction energy of fuels on the anode side and oxidants on the cathode side. Fuel
cells have several prominent advantages compared with other energy conversion systems,
such as combustion engines[98]. First, because they are not heat engines under the
limita-tion of Carnot cycle, they usually have very high fuel efficiency (>50%). Second, they can
use different types of renewable fuels, such as methanol, ethanol and hydrogen gas, other
than fossil fuels with limited and nonrenewable sources. Third, because of high reaction
efficiency and/or choices of clean fuels, they usually have less or even no output of
green-house gas or other pollutants, such as carbon dioxide (CO2) and nitrous oxide (N2O). For
these reasons, they provide promising technologies to help us solve the serious energy and
environmental problems in modern society.
There are several types of fuel cells with different choices of fuels, oxidants and
mem-branes, which are used to conduct ions between two electrodes. Among them, the proton
reactions are shown as following:
Hydrogen Oxidation Reaction (HOR) on anode: H2 → 2H++2e− (1.1)
Oxygen Reduction Reaction (ORR) on cathode: O2+4H++4e− → 2H2O (1.2)
Here both H2 and O2 are in gas states with partial pressure ∼ 1 atm, and both reactions
occur at room temperature (∼ 300 K) in the electrolyte with H2O as solvent molecules.
The proton involved in these reactions exists in the electrolyte as a hydrated state by
com-bining with nearby water molecules; polymer membranes (NafionR) are used to transport
these hydrated protons between anode and cathode. The electrons involved in HOR and
ORR come from the anode and cathode, respectively, and their free energies depend on
electrode potentials. In addition, because there are large activation energy barriers for both
HOR and ORR performing in homogeneous electrolyte phases, certain catalysts on the
electrodes have to be used in order to make both reactions occur fast and smoothly at room
temperature. The catalysts work by providing their surfaces as active reaction sites, where
the activation energies significantly decrease, resulting from surface adsorption and
disso-ciation of certain reactant atoms and molecules. In general, because of its low operation
temperature and compact size, PEM fuel cell is a prime candidate for vehicles and other
mobile applications, which need to be turned on/off frequently[6].
However, there are still many obstacles for the practical application of PEM fuel cell,
especially in its catalysts. Currently, all high-performance catalysts for PEM fuel cell are
made of precious Pt or Pt alloys; there are also technical problems for these expensive
materials to perform as highly efficient and stable catalysts. First, on the anode side, the
impurity in the fuel, such as carbon monoxide (CO), can poison the catalyst by strong
ad-sorption at active reaction sites on Pt surface, which decreases the catalytic activity of Pt
Pt mass activity, defined as the ORR rate by using unit mass of Pt as catalysts, so that the
total amount of Pt used is quite large and significantly increases the cost for its commercial
applications[33]; third, all catalysts are deposited on electrodes in the form of nanocrystals
to increase electrochemical active surface area (ECSA), but corrosion and coarsening
grad-ually occur and result in catalytic performance degradation[119]. My research is mainly
focused on the last two problems: the activity and durability of catalysts used on the
cath-ode of PEM fuel cell, because ORR on the cathcath-ode has much smaller activity than HOR on
the anode, which makes ORR the rate-determining step in the whole fuel cell reaction, and
corrosion also occurs much faster on the cathode, which has higher electrode potential U
than the anode.
In experiments, the activity and durability of catalysts can be evaluated by measuring
electric current I and electrode potential U with different techniques, such as Tafel plot,
cyclic voltammetry (CV) and Levich-Koutecky plot with rotating disk electrode (RDE)[7].
These measurements can also be used to investigate the reaction mechanisms based on
assumptions of surface reaction models[22, 116, 78, 79]. However, there are still many
controversies and uncertainties for mechanisms of both ORR and catalyst degradation.
These uncertainties mainly result from two factors. First, unlike surface reactions under
ultra-high vacuum (UHV) conditions where characterization techniques are abundant[63],
it is still quite difficult to accurately obtain electronic and atomic information of
electro-chemical surface reaction because of the existence of liquid electrolyte. Second, both ORR
and Pt corrosion are reactions with complex dynamics: ORR is a multiple-electron
trans-fer process and consists of several elementary reaction steps with many possible reaction
intermediates; Pt corrosion is a relatively slow process but can be accelerated by electrode
potential cycling and corresponding Pt oxidation/reduction, which involve intricate Pt
lat-tice distortions and reconstruction. For these reasons, theoretical studies are needed to
and durability.
There are several general types of theoretical and computational tools for materials
sci-ence, such as classical molecular dynamics, Monte Carlo methods, kinetic Monte Carlo
and first-principles methods[121, 71]. Density functional theory (DFT), a widely used
first-principles method, provides a theoretical tool to study the physical and chemical
prop-erties of certain materials accurately and efficiently[101, 81]. In principle, DFT calculation
is a quantum mechanical method depending only on the some universal constants such
as Planck constant, speed of light, mass of ions and electrons (practically, it needs some
material-independent parameters for the electron density functional and pseudopotentials
of ions plus core electrons.). Its results are usually very accurate without the help of
ex-perimental measurements. In addition, because the degrees of freedom are single-electron
wavefunction (Kohn-Sham) and electron density rather than many-body wavefunction in
quantum chemistry methods, DFT can calculate larger systems with reasonable time and
computer power consumption. For these reasons, DFT has been widely used in studies of
surface reactions on the catalysts[44].
However, DFT methods alone are not enough to determine the whole picture of an
electrochemical surface reaction such as Eq. 1.2. As a quantum mechanical method, DFT
calculation is still very expensive so that it is usually used to deal with a system of∼100
atoms with the size of ∼30 ˚A; on the other hand, an electrochemical surface reaction is
affected by factors at different scales: on the catalyst surface the elementary reaction steps
compete with each other for the limited reaction sites, so that statistical mechanical models
are needed to consider these lateral interactions (catalysis model); away from the surface
there are long-range diffusion layers of reactants and ions (100∼10000 ˚A), which result
in an electric field and its integral effect–electrode potential U ; the surface reaction
ki-netics has a self-consistent relation with the diffusion layers so that multiscale models are
(electrocatal-ysis model).
1.2
Detailed Outline
In Chapter 2, there is short introduction on the basic concepts and theories frequently used
in my thesis. First, a short introduction is given on the subject of surface structure models.
Then there are some fundamental theories in electrochemistry, such as electrode potential
references, electrical double layer structures, Gouy-Chapman theory in charge-potential
relation, electrode reaction kinetics and overpotentials. Finally some methodologies of
simulation techniques, such as DFT and kinetic Monte Carlo, are briefly reviewed.
In Chapter 3, we start DFT studies of oxygen reduction by hydrogen molecule at ultra
high vacuum (UHV) conditions, as shown in the following:
O2+2H2 → 2H2O (1.3)
Although it is different from electrochemical ORR of Eq. 1.2 in both the reactant (H2
vs. H++e−) and reaction environment, there are still several similarities. First, their final
products are both H2O molecules; second, the strong covalent bond of O2has to be broken
in both reactions; third, Pt is the effective catalyst for both reactions. Besides these
simi-larities, reaction in Eq. 1.3 is relatively easy to study by DFT, because there are only gas
molecules and solid surface involved. The purpose of this study is to use a simple model
reaction to understand the origin of catalytic activity in oxygen reduction on different
sur-faces, so DFT calculations are performed on (111) surfaces of different metals (Pt, Cu, Au
and Pt alloys).
In Chapter 4, the topic is changed from ORR at UHV conditions of Eq. 1.3 back into
ORR path, which can be accomplished by numerous combinations of possible elementary
steps depending on the charge states of ORR intermediates, it is essential to understand
its detailed reaction mechanism before we build any accurate kinetic model. Thus, we
use DFT methods to study electronic structure of every possible reaction intermediate,
such as adsorbed oxygen molecule, in order to clarify the corresponding electron transfer
sequence. After that, we also use DFT to study the dynamics of these electron transfer
processes near electrode surfaces, so that we can obtain their activation barriers, which
are useful for the kinetic studies in the next step. Meanwhile, because there is some
sim-ple ORR kinetic model whose input parameters are just the adsorption energies of critical
ORR intermediates[94], we also use it to discover new catalysts for ORR by theoretically
designing atomic structures and calculating their adsorption energies. Although it is not
very accurate, it can be used as a quick and coarse filtering method to pick up possible
candidates of better activity for detailed studies by more accurate kinetic models.
Chapter 5 illustrates the procedures to build a multiscale and self-consistent model of
electrochemical ORR on catalyst surface. First, based on the reaction mechanisms and
cor-responding dynamics found in Chapter 4, we build a reaction network on limited surface
sites. Here we do not only consider the competitions of reaction sites between elementary
steps (entropic interaction), but also the repulsive interactions between ORR intermediates
on the surface (enthalpic interaction). In mean-field approximation, the steady states of the
reaction network can be numerically solved in order to obtain ORR rate and current density
j at given U . Based on this model, we build a mathematical framework to perform the
anal-yses on how each input parameter, such as adsorption energy of certain intermediate, can
affect the final output of this reaction network. Besides mean-field results, the advantages
of discrete model to accurately describe the lateral interactions and site competitions are
also discussed. Second, the electrode-electrolyte interface, so called double layer structure,
as a function of excess surface electron density σMon metallic electrode, and the results
can also be used to calculate the differential capacitance Cd, which is directly comparable
with experiments. Finally, becauseσM depends on both the electron consumption rate by
electrochemical surface reactions and the supply rate by current I from external circuit, we
discuss the principles to achieve a self-consistent multiscale ORR model to output both U
and I, such that a PEM fuel cell simulator in silico can be constructed.
In Chapter 6, the topic is changed to the durability of catalyst. The degradation of
catalyst performance results from two mechanisms: the corrosion and coarsening of Pt
nanocrystals. The corrosion is usually accelerated by Pt oxidation/reduction cycling, so the
formation mechanisms of thin oxide layer on various Pt surfaces (low index facets such as
(111) or (100), and high index facets such as (210)) are studied in order to find a possible
method to impede oxidation process and subsequent corrosion. The coarsening is found by
experiments to be accomplished by Pt adatom diffusion between Pt grains[153], so that Pt
adatom diffusion is theoretically studied on Pt (111) surface with various surface adsorbates
in order to explain potential-dependent coarsening rates and design special structures to
deactivate this process.
Chapter 7 summaries all the results in my thesis and proposes some directions for future
Chapter 2
Fundamental Concepts and Modeling
Methodologies
2.1
Models of Solid Surface
Surface of solid is inherently different than the rest of the solid (the bulk): because there are
less coordination numbers for the atoms on the surface than those in the bulk, the bonding
at the surface is different than those in the bulk, resulting in various physical and chemical
properties. In this thesis, all the (electro-)chemical reactions occur on the surface of certain
solid material at gas-solid or liquid-solid interface, so it is essential to choose some proper
models to describe the atomic structures of solid surface.
In general, there are two types of surface models:
• Cluster model, which uses a cluster composed of limited number of atoms, as shown
in Fig. 2.1 (a).
• Slab model, where the surface is described as a slab with periodic boundary
(a) (b) (c)
Figure 2.1: Models of solid surface. (a) Example of a cluster model, a 55-atom Pt cluster in FCC lattice structure, where both (100) and (111) facets are shown. (b) and (c): Top and side view of a slab model, a (4×4) Pt (111) surface in FCC lattice structure composed of 4 (111) layers.
In practical simulations, because of computational power limitation, a surface model
can only have a small number of atoms (usually<100). Thus, the cluster model has very
small size and there may be several types of atoms with different coordination numbers,
which result in various chemical properties at different surface sites. The heterogeneity
of surface sites may increase our difficulty to compare the simulation results with the
ex-perimental measurements, where the real surface has much larger size and more uniform
properties (the real surface still has many types of reactions sites such as steps and kinks,
but not so high density as the cluster model in Fig. 2.1 (a)). Meanwhile, the electronic
structures of the isolated clusters may be different from the surface of bulk solids. For
these reasons, we usually apply slab model to study the (electro-)catalytic reaction on the
2.2
Fundamental Concepts in Electrochemistry
2.2.1
Electrode Potential
A chemical reaction in which there are electrons provided or taken by an external source,
such as HOR in Eq. 1.1 and ORR in Eq. 1.2, is called electrochemical reaction or electrode
reaction, and the external electron source is called electrode. To calculate the free energy
changes in an electrode reaction, an electron in the electrode should be assigned its own free
energy and corresponding chemical potential, which can be quantitatively described only
if a well-defined reference system, so-called reference electrode, is given. Thus electrode
potential U of this electrode is defined as the free energy change to move one electron from
the reference electrode to the studied electrode divided by electron charge−e, where e is
the elementary charge equal to 1.6021×10⁻¹⁹ C; it is also the difference of Fermi level EF
between two electrodes divided by−e.
A common accepted reference is the standard hydrogen electrode (SHE), also called
normal hydrogen electrode (NHE)[5, 7]. In SHE, electrons have the free energy so that the
following HOR
H2(gas, aH2=1)↔2H
+(aqueous, a
H+=1) +2e− (2.1)
is at thermodynamic equilibrium. Here aH2and aH+is the activity for hydrogen gas molecule
and hydrate proton, respectively, defined as the following:
agas= pgas
p0
, aH+ = fH+
cH+
c0
(2.2)
where p0= 105Pa and c0= 1 mol/L as the references, and fH+ = 1 for the strong acid that
speed up the reaction rate to reach equilibrium. In this thesis, if not specially mentioned,
all electrode potentials are relative to SHE. Using SHE, if electrons from an electrode can
make the following ORR in thermodynamic equilibrium at room temperature (T = 298.15
K):
O2(gas, aO2=1) +4H
+(aqueous, a
H+=1) +4e−↔2H2O(aqueous) (2.3)
the corresponding electrode potential U = +1.23 V vs. SHE. This value is obtained from
the Gibbs free energy change of the reaction 2H2(gas, aH2 = 1) +O2(gas, aO2 =1)→
2H2O(aqueous)divided by−4e[5].
Figure 2.2: Illustration of electrode potential and absolute electrode potential. Here Fermi level of the electrode, EF, equals the energy level of highest occupied molecular orbital
(HOMO) of A, so reaction of A++e− ↔A is at thermodynamic equilibrium. Estatic is the
average electrostatic energy of an electron in the electrolyte and vacuum, respectively.
ordinary microscopic simulation methods, so it is better to find a reference system for
a single electrode for theoretical studies. A good choice is absolute electrode potential
Uabs[135], which is defined as the free energy change to move one electron from the vacuum
area just outside the electrolyte-vacuum interface to the electrode divided by−e, as shown
in Fig. 2.2. For an isolated electron in vacuum, its free energy only comes from the
electrostatic potential, thus
Uabs=−(EF−Estatic)/e (2.4)
where EFis Fermi level of the electrode and Estaticis electrostatic energy of one electron in
the vacuum just outside the electrolyte-vacuum interface[131]. Meanwhile, experimental
results show that Uabs of SHE is 4.6±0.2 V[135, 136], providing a conversion method
between the absolute electrode potential of certain electrode and its counterpart relative to
conventional reference systems, such as SHE.
2.2.2
Electrical Double Layer
Physically, electrode potential U results from the opposite excess charges accumulated
on the two sides of electrode-electrolyte interface. This interface behaves like a
capac-itor, where there are excess electrons, qM, on the metal electrode, and opposite charges,
qS=−qM, in the electrolyte. Here qMcan be either negative, meaning there are more
elec-trons than the positive charges of metallic ions, or positive, meaning less elecelec-trons than
the metallic ions’ charge. They are distributed in a very thin layer (<∼1 ˚A) on the metal
surface. The charges in electrolyte, qS, result from excess of either cations or anions in the
vicinity of the electrode surface (10∼104A from the surface). Usually q˚ Mand qSare
ex-pressed by excess surface electron/charge densities, such asσM=qM/A in unit ofµC/cm2, where A is the surface area. The whole structure of the excess/deficient charge species on
Figure 2.3: Illustration of electrical double-layer structure under conditions where anions are specifically adsorbed, copying from Fig. 1.2.3 in reference [7].
Both thermodynamics and kinetics of interfacial electrochemistry are affected by
elec-trical double layer, which has complex structure, as shown in Fig. 2.3. On the metal
electrode side, the distribution of excess/deficient electrons on the surface is different from
metal-vacuum interface because of dielectric properties of the electrolyte near the surface.
The electrolyte side can be conceptually divided into several “layers”. Closest to the
elec-trode, it is the inner layer or compact layer, which contains solvent molecules adsorbed on
the surface in a compact arrangement and sometimes other specifically adsorbed species
(ions or molecules). The locus of the electrical centers of specifically adsorbed ions is
called the inner Helmholtz plane (IHP), which is at a distance of x1to the electrode surface.
The total charge density from specifically adsorbed ions in the inner layer isσi(µC/cm2).
can only approach the metal to a distance x2 >x1, and there are only electrostatic
inter-actions between the charged electrode and these solvated ions, which can also be called
non-specifically adsorbed ions. The locus of the electrical centers of the non-specifically
adsorbed ions in their position of closest approach is called outer Helmholtz plane (OHP).
The non-specifically adsorbed ions are distributed in the region extended from OHP into
the bulk of electrolyte, which is called diffusion layer. The excess charge density in the
dif-fusion layer isσd. Thus, the total excess charge density on the electrolyte side of electrical
double layer,σS, is given by
σS=σi+σd=
−σM (2.5)
Gouy-Chapman Theory
Besides the graphical model of double layer structures, we need a theory to quantitatively
describe how the electrode potential is generated by excess electron/charge density on two
sides of double layer. A simple model for this metal-electrolyte interface was developed by
Gouy [38] and Chapman [18] as early as 1910. The basic idea is to consider the electrode
as a perfect conductor and the electrolyte as point ions distributed in the dielectric
contin-uum, and the detailed distributions of ions satisfy with basic electrostatics and Boltzmann
statistics. If we choose the coordinate system so that a planar electrode is at the place of
x=0 for simplification, we can get Poisson-Boltzmann equation:
d2φ dx2 =−
e
εε0
∑
in0iziexp
−zieφ
kBT
(2.6)
where φ is electrostatic potential measured with respect to the bulk electrolyte far away
from the electrode;ε0is vacuum permittivity;ε is dielectric constant of the electrolyte; n0i
is bulk concentration of ion i far away from electrode; zi is the charge number for ion i;
charge number+z/−z in the electrolyte, Eq. 2.6 can be rewritten as d2φ
dx2 =− zen0
εε0
exp
−zekφ(x)
BT
−exp
zeφ(x)
kBT
(2.7)
If the ion concentration is very low so that the potential fluctuation is very small (zekφ(x)
BT ≪
1), Eq. 2.7 can be simplified as linear equation (Debye-H ¨uckel limit[14]):
d2φ dx2 =≈κ
2φ(
x) (2.8)
whereκ is defined as Debye inverse length:
κ=
2(ze)2n0
εε0kBT
12
(2.9)
which semi-quantitatively shows the thickness of diffusion layer in the electrolyte with
varying ion concentration, as shown in Table 2.1.
Table 2.1: Debye length for an aqueous solution with completely dissociated 1-1 electrolyte at room temperature T = 300 K andε =78.4. Copying from Table 3.1 in reference [115].
Concentration n0[mol/L] 10−4 10−3 10−2 10−1
Debye Length 1/κ [ ˚A] 305.0 96.4 30.5 9.6
Considering the boundary conditionφ(+∞) =0 and charge balance condition of Eq.
2.5, solutions of Eq. 2.8 can be:
φ(x) = σ
M
εε0κ
exp(−κx) (2.10)
ρ(x) =−σMκexp(
−κx) (2.11)
Poisson-Boltzmann equation 2.7 can also be solved explicitly, and the result is
tanh
zeφ(x)
4kBT
=
p
1+α2(σM)2−1
ασM exp(−κx) (2.12)
whereα = (8kBT n0εε0)−
1
2. And the differential capacitance, defined as Cd ≡∂σM
∂φ , is
Cd=εε0κcosh
zeφ(0)
2kBT
(2.13)
Whenφ(0) =0, the electrode carries no excess electrons, and the corresponding electrode potential is called potential of zero charge(PZC). So the differential capacity is
Cd=εε0κcosh
ze(U−PZC)
2kBT
=
2(ze)2εε0n0 kBT
12
cosh
ze(U−PZC)
2kBT
(2.14)
which is called Gouy-Chapman capacitance. It has a minimum value at PZC and goes into
infinity when U → ±∞. This V-shaped capacitance function resembles the experimental
behaviors at low ion concentrations and at potentials not far away from the PZC[7, 115].
However, Gouy-Chapman theory is known to strongly overestimate ionic
concentra-tions close to charged surfaces. The main reason for inaccuracies results from the finite
size of ions in the electrolyte. The ions have finite sizes, which are larger than the isolated
ions in vacuum because of the primary solution sheath, so they can not approach the surface
any closer than the ionic radius, as shown in Fig. 2.3. Ideally, there are no ionic charges
from the electrode surface to OHP if there are no specifically adsorbed ions on the electrode
surface, so the electrostatic potential in the compact layer is assumed to behave like a linear
function, as shown in Fig. 2.4, and its contribution to the total differential capacitance Cd
bulk electrolyte, Cd can be calculated as following:
1
Cd
= x2
εε0
+ 1
(2(ze)2εε0n0
kBT )
1
2cosh[ze(U−PZC)
2kBT ]
= 1
CH
+ 1
CD
(2.15)
where x2is the distance between OHP and electrode surface, and the Helmholtz capacitance
CH corresponds to the capacitance contributed by compact layer inside OHP. This model,
known as Gouy-Chapman-Stern(GCS) model, predicts the behaviors closer to real systems.
Figure 2.4: Potential distribution of electrical double layer by Gouy-Chapman-Stern (GCS) model. Meanings of difference signs are explained in the caption of Fig. 2.3.
Based on these theories, there are at least two more things we can improve further.
First, in the real electrode-electrolyte interface, the dielectric constant in compact layer
is different from bulk electrolyte because of the effect from electrode[114], so we want
to build a multiscale model, which combines quantum mechanical methods and statistical
GCS model, electrode potential U is measured with respect to PZC, which is a variable
depending on detailed electrode-electrolyte interface, so we need to obtain U relative to a
fixed reference system, which is experimentally measurable, such as SHE. Both of them
will be discussed in Section 5.2.
2.2.3
Electrode Reaction
For a general electrode reaction, O + ne− →R, it can be accomplished by several steps, as
shown in Fig. 2.5. First, the reactant O should move from bulk electrolyte to the area near
electrode by mass transfer. There are three different modes of mass transfer:
• Migration. Movement of a charge body caused by an electric field.
• Diffusion. Movement of a species under the influence of a chemical potential
gradi-ent (usually it is concgradi-entration gradigradi-ent.).
• Convection. Bulk movement of fluid accompanied by the transfer of species inside.
Second, when the reactant is close to the surface, it may need to be adsorbed on the
electrode surface, marked as O∗. Third, electrons are transferred to O∗, accompanied by
some other possible surface reactions, such as molecular dissociation and/or recombination,
so O∗ is transformed into R∗adsorbed on the surface. Finally, R∗departs from the surface
to the bulk electrolyte by desorption and various mass transfer modes. It is also possible
that neither O nor R needs to be adsorbed on the surface; they may gain or lose electrons
and transform into each other once they are close to the electrode surface. As shown in Fig.
2.5, this reaction can also occur in a reverse direction by similar mechanisms.
In such a complex reaction pathway, each elementary step may contribute some barrier
to impede the electrode reaction. For example, there may be a high free energy barrier, Qeq,