Cost-effectiveness Analysis of the National Perinatal
Hepatitis B Prevention Program
WHAT’S KNOWN ON THIS SUBJECT: Infant postexposure prophylaxis prevents perinatal hepatitis B (HepB) virus transmission and mortality and morbidity caused by chronic HepB virus infection. The US Perinatal Hepatitis B Prevention Program (PHBPP) identifies and manages infants born to HepB surface antigen–positive women.
WHAT THIS STUDY ADDS: It presents thefirst estimates of the long-term costs and outcomes of postexposure prophylaxis with the PHBPP. It analyzes the effects of the PHBPP, and alternative immunization scenarios, on health and economic outcomes for the 2009 US birth cohort.
abstract
OBJECTIVE:To analyze the cost-effectiveness of the national Perinatal Hepatitis B Prevention Program (PHBPP) over the lifetime of the 2009 US birth cohort and compare the costs and outcomes of the program to a scenario without PHBPP support. PHBPP’s goals are to ensure all infants born to hepatitis B (HepB) surface antigen–positive women receive timely postexposure prophylaxis, complete HepB vaccine series, and obtain serologic testing after series completion.
METHODS: A decision analytic tree and a long-term Markov model represented the risk of perinatal and childhood infections under dif-ferent prevention alternatives, and the long-term health and economic consequences of HepB infection. Outcome measures were the number of perinatal infections and childhood infections from infants born to HepB surface antigen–positive women, quality-adjusted life-years (QALYs), lifetime costs, and incremental cost per QALY gained. The health outcomes and total costs of each strategy were compared incrementally. Costs were evaluated from the health care system perspective and expressed in US dollars at a 2010 price base.
RESULTS:In all analyses, the PHBPP increased QALYs and led to higher reductions in the number of perinatal and childhood infections than no PHBPP, with a cost-effectiveness ratio of $2602 per QALY. In sensitivity analyses, the cost-effectiveness ratio was robust to variations in model inputs, and there were instances where the program was both more effective and cost saving.
CONCLUSIONS:This study indicated that the current PHBPP represents a cost-effective use of resources, and ensuring the program reaches all pregnant women could present additional public health benefits.
Pediatrics2014;133:243–253
AUTHORS:Carolina Barbosa, PhD,aEmily A. Smith, MPH,b
Thomas J. Hoerger, PhD,aNancy Fenlon, RN, MS,cSarah F.
Schillie, MD, MPH, MBA,bChristina Bradley, BS,aand Trudy
V. Murphy, MDb
aRTI International, Chicago, Illinois; andbDivision of Viral Hepatitis, National Center for HIV/AIDS, Viral Hepatitis, STD and TB Prevention, andcImmunization Services Division, National Center for Immunization and Respiratory Diseases, Centers for Disease Control and Prevention, Atlanta, Georgia
KEY WORDS
cost-effectiveness, QALY, cost, perinatal, infection, hepatitis B, immunization programs
ABBREVIATIONS
ACIP—Advisory Committee on Immunization Practices CDC—Centers for Disease Control and Prevention CEAC—cost-effectiveness acceptability curve CI—confidence interval
HBIG—hepatitis B immune globulin HBsAg—hepatitis B surface antigen HBV—hepatitis B virus
HepB—hepatitis B
ICER—incremental cost-effectiveness ratio PEP—postexposure prophylaxis
PHBPP—Perinatal Hepatitis B Prevention Program PVST—postvaccination serologic testing QALY—quality-adjusted life-year
Dr Barbosa participated in the concept and design of the study; the collection, analysis, and interpretation of data; and drafted and revised the manuscript. Ms Smith, Ms Fenlon, Dr Schillie, and Dr Murphy participated in the concept and design of the study; the collection, analysis, and interpretation of data; and revised the manuscript. Dr Hoerger participated in the concept and design of the study, the analysis and interpretation of data, and drafted and revised the manuscript. Ms Bradley participated in the collection of data and revised the manuscript. All authors approved the manuscript as submitted.
www.pediatrics.org/cgi/doi/10.1542/peds.2013-0718
doi:10.1542/peds.2013-0718
Accepted for publication Nov 1, 2013
Address correspondence to Carolina Barbosa, PhD, RTI International, 230 West Monroe St, Ste 2100, Chicago, IL 60606-4901. E-mail: cbarbosa@rti.org
Each year, an estimated 25 000 infants are born to hepatitis B surface antigen (HBsAg)-positive women in the United States.1 With no intervention, these
infants have a 40% to 90% risk of hep-atitis B virus (HBV) infection.2,3
Ap-proximately 90% of infected infants develop chronic HBV infection, which carries a 25% risk of premature death from progressive damage to the liver, leading to cirrhosis, or cancer of the liver.4Postexposure prophylaxis (PEP),
consisting of hepatitis B immune globulin (HBIG) and hepatitis B (HepB) vaccine administered at birth, followed by completion of a 3-dose HepB vaccine series is 85% to 95% effective in pre-venting perinatal HBV infection.4
The Advisory Committee on Immuniza-tion Practices (ACIP) of the Centers for Disease Control and Prevention (CDC) recommends that all pregnant women receive HBsAg screening to ensure that infants of HBsAg-positive women receive PEP.4ACIP recommends that infants of
HBsAg-positive women receive HBIG and HepB vaccine within 12 hours of birth, complete the HepB series, and receive serologic testing (HBsAg and antibody to HBsAg) 1 to 2 months after completing the HepB vaccine series to determine outcomes (HepB immunity by vaccina-tion, nonresponse to vaccinavaccina-tion, or chronic HBV infection) and future management. ACIP also recommends that the small percentage (5%) of infants who fail to respond to an initial HepB vaccine series and remain un-infected receive an additional HepB vaccine series and repeat post-vaccination serologic testing (PVST).
In 1990, the CDC began funding Perinatal Hepatitis B Prevention Programs (PHBPP) in all 64 immunization grant-ees through the 317 program. PHBPP’s goals are to ensure all infants born to HBsAg-positive women receive timely PEP, complete HepB vaccine series, obtain PVST after series completion, and continue medical care appropriate
to their outcomes. These goals are ac-complished through case management activities. Programs report outcomes annually to the CDC.1,4 In 2008,
pro-visional estimates were that 48% of the 25 600 annual estimated births to HBsAg-positive women were identified and case-managed by PHBPP.1 Most
HBsAg-positive women and infants case-managed by PHBPP receive med-ical care funded by private insurance or Medicaid, although data on the exact proportions of each have not been collected.1More information on PHBPP
activities is described in Appendix A of the Supplemental Information.
Although economic analyses of the burden and prevention impact of HBV transmission have been conducted,2,5–10
no study has focused on the long-term costs and outcomes of PEP through the current national PHBPP. This study analyzes the effects of the PHBPP on health and economic outcomes attrib-utable to perinatal and early childhood infection (postnatal infection, before age 5 years), determined over the life-time of the 2009 US birth cohort. Costs and outcomes of the current PHBPP (“PHBPP” strategy) are compared in-crementally to a strategy represented by the ACIP recommendations without PHBPP support (“No PHBPP” strategy). The study’s main hypotheses were as follows1: the number of perinatal and
childhood infections will be lower in the PHBPP strategy,2 the higher
quality-adjusted life-years (QALYs) gained with PHBPP will justify the higher program costs, and the program will be cost-effective when compared with the No PHBPP strategy.
METHODS
Overview
Economic evaluation provides a frame-work to allocate resources to effective strategies. Full economic evaluations are evaluations where the costs and con-sequences of at least 2 strategies are
compared and can help with un-derstanding the value for money of each strategy.11,12Where 1 strategy does not
dominate (ie, is not both more effective and less costly), costs and effects are combined in the form of incremental cost-effectiveness ratios (ICERs),
de-fined as the difference in costs (C) di-vided by the difference in mean effectiveness (E), (Cj2Ci)/(Ej2Ei), where j is a more costly strategy than i. The ICER represents the additional cost required to achieve 1 additional unit of outcome. An optimal intervention is one with an ICER that is not more than the decision maker’s intrinsic valuation for an additional unit of the outcome.11,12
In a cost-effectiveness analysis, health benefits associated with the strategies under comparison can be measured and valued by using natural units of outcome (eg, life-years), number of infections, or they can reflect the value individuals place on their health, called utilities. QALYs are a widely used measure of health benefits that incorporate mor-tality and morbidity estimates in a single index. Cost per QALY estimates allow a comparison between different health care interventions that compete for the same pool of resources.
This cost-effectiveness analysis com-pared 2 strategies. In the base-case analysis, the No PHBPP strategy assumes that there is no program targeted at identification and man-agement of infants born to HBsAg-positive mothers and that infants do not receive HBIG or PVST. In the PHBPP strategy, a proportion of the infants born to HBsAg-positive mothers are identified prospectively and managed through the national PHBPP. Those not captured by the PHBPP follow the No PHBPP strategy.
long-term Markov model, both follow-ing a cohort simulation approach.13,14
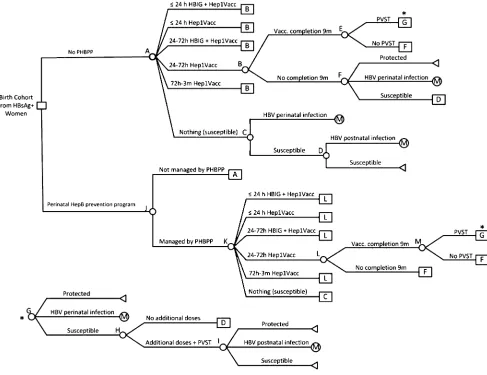
Decision Analytic Tree
The decision tree estimated the expected number of infants, born to HBsAg-positive women, who were perinatally and postnatally infected and was used in all cost-effectiveness analyses. The de-cision tree was built in TreeAge Pro 2011 (TreeAge Software, Inc, Williamstown, MA) (Fig 1). All infants born to HBsAg-positive women follow either the No PHBPP or the PHBPP strategy. Four mutually exclusive outcomes were modeled: seroprotection, susceptibility, perinatal infection, and childhood
infection. The cost-effectiveness analy-sis focused on the last 2 outcomes and QALYs lost with each type of infection.
The decision tree model base-case parameters and sources are summa-rized in Table 1. The 24 784 cohort considered in this analysis was the estimated number of infants born to HBsAg-positive mothers in 2009.1,15,16
More than 95% of women were screened for HBsAg in the United States in 2003–2004.4,15 Consistent with this
estimate, and so that all infants born to HBsAg-positive women are modeled, both strategies assume a 100% screen-ing coverage. Vaccine efficacy is as-sumed to confer immunity to chronic
and acute HBV infection acquired peri-natally and during childhood before age 5 years. Efficacy varies by the time offirst dose of HBIG and HepB vaccine admin-istration, or HepB vaccine without HBIG, and by completion of vaccine series within 9 months or longer periods. The major determinant of the effectiveness of PEP for infants of HBsAg-positive mothers is on-time administration of the initial dose of HepB vaccine and HBIG.17Because most available data use
,24 hours of life as the optimal timing for administering thefirst dose of HepB vaccine and HBIG, we also use,24 hours rather than the ACIP-recommended#12 hours. Infants born to HBsAg-positive
FIGURE 1
TABLE 1 Model Parameters: Base-Case Values and Their Sources, Variations in Sensitivity Analysis and Assumptions, and Probabilistic SA Distributionsa
Parameter Name, Reference No.
Base-Case SAb
Probabilistic SA
Upper Value
Lower Value
Assumption Distribution SE a b
Population and risk of infection Births per year16
4 130 665 — — — — — — —
P mother is HBsAg+1,15 0.006 0.008 0.004 CI in ref 15 b 0.00392 2 385
Ninfants to HBsAg+ mother 24 784 — — — — — — —
P HBsAg+ mother is HBeAg+38
0.3 0.36 0.24 620% b 0.1176 4 10
P transmission HBeAg+3,39-42 0.832 1 0.734 Highest and lowest value from 5 studies b NA 154 31
P transmission HBeAg-3,39-42 0.153 0.314 0.037 Highest and lowest value from 5 studies b NA 33 183
P of transmission HBsAg+c 0.3567 0.5610 0.2043 Calculated with upper and lower
values of seroprevalence and transmission estimates
— — — —
P of childhood infection among not seroprotected2
0.3 0.36 0.24 620% b 0.1176 4 10
Vaccination coverage for No PHBPP
P Hep1Vacc#24 h27,28 .544 .544 0 Variable set as: 0.5442P
Hep1Vacc+HBIG#24 h
dirichlet NA 18 556 15 555
P Hep1Vacc+HBIG#24h 0 0.544 0 Upper value assumes all infants
receivingfirst dose within 24 h in NIS27,28data also receive HBIG
— — —
P Hep1Vacc 24–72 h27,28
0.081 0.081 0.000 Variable set as: 0.0812P
Hep1Vacc+HBIG 24–72 h
dirichlet NA 2746 31 365
P Hep1Vacc+HBIG 24–72h 0 0.081 0 Variable set as: P Hep1Vacc+HBIG
#24 h*(0.081/0.544)
— — —
P Hep1Vacc 72 h–3 mo27,28 0.313 — — — dirichlet NA 10 677 23 434
P no dose27,28 0.063 — — — dirichlet NA 2132 31 979
P completion in 9 mo29 0.639 0.626 0.652 CI in Smith 20121 b NA 10 734 6064
P PVST 0 0.560 0 Upper value assumes PVST rates equal
to those under program support
— — —
Vaccination coverage for PHBPP
P Hep1Vacc+HBIG#24h1 0.855 — — — dirichlet NA 4339 736
P Hep1Vacc#24 h 0.032 — — — dirichlet NA 162 4913
P Hep1Vacc+HBIG 24–72 h 0.104 — — — dirichlet NA 528 4547
P Hep1Vacc 24–72 h 0.001 — — — dirichlet NA 5 5070
P Hep1Vacc 72 h–3 mo 0.001 — — — dirichlet NA 5 5070
P no dose 0.007 — — — dirichlet NA 36 5039
P completion in 9 mo 0.723 0.868 0.578 620% b NA 3669 1406
P PVST 0.560 1 0.448 220% to 1 b NA 6697 5336
P HBs+ woman is identified and captured by PHBPP
0.479 1 0.479 Assumed base value as lower bond and
100% coverage for upper bond
b NA 12 033 13 088
Efficacy of HBV vaccine and HBIG by time of administration and completion of vaccination series HBIG+Hep1Vacc#24 h and
remaining doses on time26
0.920 0.970 0.830 Upper and lower values from CI in Lee
et al 200626
for HBIG+vaccine on time
b 0.1372 3 0
HBIG+Hep1Vacc#24 h and remaining doses not on timed
0.830 0.970 0.830 Upper and lower values from CI in Lee
et al 200626for HBIG+vaccine on time
b 0.1372 5 1
HBIG+Hep1Vacc 24–72 h and remaining doses on timee
0.616 0.828 0.460 Assuming only 10% cut on efficacy as
upper value (0.92*0.9). Lower value is a conservative assumption of cutting efficacy in half (0.92/2)
— — — —
HBIG+Hep1Vacc 24–72 h and remaining doses not on timef
0.556 0.747 0.415 Assuming only 10% cut on efficacy as
upper value (0.83*0.9). Lower value is a conservative assumption of cutting efficacy in half (0.83/2)
— — — —
Hep1Vacc#24 h and remaining doses on time26
0.720 0.800 0.600 Upper and lower values from CI in Lee
et al 200626
for vaccine on time
b 0.196 3 1
Hep1Vacc#24 h and remaining doses not on timeg
0.600 0.800 0.600 Upper and lower values from CI in Lee
et al 200626
for vaccine on time
b 0.196 3 2
Hep1Vacc 24–72 h and remaining doses on timeh
0.482 0.648 0.360 Assuming only 10% cut on efficacy as
upper value (0.72*0.9). Lower value is a conservative assumption of cutting efficacy in half (0.72/2)
TABLE 1 Continued
Parameter Name, Reference No.
Base-Case SAb
Probabilistic SA
Upper Value
Lower Value
Assumption Distribution SE a b
Hep1Vacc 24–72 h and remaining doses not on timei
0.402 0.540 0.300 Assuming only 10% cut on efficacy as
upper value (0.6*0.9). Lower value is a conservative assumption of cutting efficacy in half (0.6/2)
— — — —
Hep1Vacc 72 h–3 mo and remaining doses on timej
0.323 0.648 0.241 Assuming same SA values as when
first dose is given 24–72 h
— — — —
Hep1Vacc 72 h–3 mo and remaining doses not on timek
0.269 0.540 0.201 Assuming same SA values as when
first dose is given 24–72 h
— — — —
Cost parameters Cost per 1 vaccine dose43
$22 — — — — — — —
Administrative costs for 1 vaccine dose44
$14 — — — — — — —
Cost of HBIG45
$121 $146 $97 620% — — — —
Cost of anti-HBsAg Test46
$15 — — — — — — —
Blood drawn cost46 $3 — — — — — — —
Cost of HBsAg screening test46 $15 — — — — — — —
Cost of outpatient consultation47 $61 — — — — — — —
Cost of identification in PHBPP per infantl
$783 $929 $472 For upper value the bootstrapped of
CI used, for lower value the total cost for all grantees divided by the total number of infants was used
g 75 110 7
Cost of management in PHBPP per infantl
$769 $890 $552 g 62 154 5
Markov model inputsm Cost due to HBV perinatal and
childhood infection Cost of perinatal infection
diagnosed at infection
$24 117 $28 941 $19 294 620% g 9454 7 3706
Cost of perinatal infection not diagnosed at infection
$9831 $11 797 $7865 620% g 3854 7 1511
Cost of childhood infection diagnosed at infection
$11 643 $13 972 $9315 620% g 4564 7 1789
Cost of childhood infection not diagnosed at infection
$3713 $4455 $2970 620% g 1455 7 570
QALYs loss due to HBV perinatal and childhood infection QALY loss due to perinatal
infection diagnosed at infection
0.7656 0.9187 0.6125 620% g 0.3001 7 0.1
QALY loss due to perinatal infection not diagnosed at infection
1.1851 1.4221 0.9481 620% g 0.4646 7 0.2
QALY loss due to childhood infection diagnosed at infection
0.2560 0.3072 0.2048 620% b 0.1003 5 13
QALY loss due to childhood infection not diagnosed at infection
0.5161 0.6193 0.4129 620% b 0.2023 3 2
HBeAg+, hepatitis B e antigen positive; HBsAg+, hepatitis B surface antigen positive; Hep1Vacc,first dose of HepB vaccine; NA, not applicable; NIS, National Immunization Survey; P, probability; SA, sensitivity analysis;—, no value was assumed in the sensitivity analysis or no distribution was assigned to the parameter.
aCalculation of all inputs detailed in Appendix A of the Supplemental Information.
bUpper and lower values for sensitivity analyses were informed by the CI of the parameter estimate or if CIs were not available, upper and lower values were set at620% of the base value. For
other variables, upper and lower values were based on previous studies and educated guesses.
cCalculated as (P transmission HBeAg+*P HBsAg+mother HBe+) + (P transmission HBeAg-*(12P HBsAg+mother HBe+)). dAssuming low end of Lee et al26CI for HBIG+Hep1Vacc#24 h and remaining doses on time.
eCalculated as 0.92*0.67, assuming a decrease in efficacy of 33%.17,18 fCalculated as 0.87*0.67, assuming a decrease in efficacy of 33%.17,18
gAssuming low end of Lee et al26CI for Hep1Vacc#24 h and remaining doses on time. hCalculated as 0.72*0.67, assuming a decrease in efficacy of 33%.17,18
iCalculated as 0.6*0.67, assuming a decrease in efficacy of 33%.17,18 jCalculated as 0.4824*0.67, assuming a decrease in efficacy of 33%.17,18 kCalculated as 0.402*0.67, assuming a decrease in efficacy of 33%.17,18
lAuthors’calculations by using self-reported grantee data to CDC from PHBPP grantees in 49 US states (excluding Alaska), 5 cities (Chicago, Houston, New York City, Philadelphia, San Antonio),
and the District of Columbia. CIs around individual cost estimates were calculated by using bootstrapping.48
women who do not complete the HepB vaccine series, or who have delays in completing the series, are significantly more likely to develop chronic infection than infants who receive timely PEP.18,19
The number of children receiving PHBPP services was calculated from PHBPP data reported to the CDC (infants born in 20081and 2009, CDC unpublished data),
which included the number of identified and case-managed infants born to HBsAg-positive women and the number receiving HBIG and HepB vaccine.1Unit
costs included HepB vaccine dose, vaccine administration, program costs, screening all pregnant women, HBIG, and PVST with outpatient consultation.
Markov Model
A Markov model of disease progression was used to estimate the HepB-related lifetime medical costs and QALY losses associated with perinatal and child-hood HBV infections. These were then used as inputs to the decision tree. The Markov model was built in Microsoft Visual Studio 2008.
We defined early diagnosis as diagnosis of infection soon after infection (100% probability of diagnosis for infants who are serologically tested) and late di-agnosis as detection of infection at a 1% annual rate,20–22 or when the infection
becomes symptomatic. We estimated hepatitis-related costs and QALY loss for early and late diagnosis and for perina-tal and childhood infection. Table 1 shows that perinatal infections have higher costs and greater QALY losses than childhood infections, because chronic HBV infection is more common after perinatal infection (90% vs 30%).4
For both types of infections, early di-agnosis leads to earlier and more mon-itoring, and more effective treatment than late diagnosis, resulting in higher costs but lower QALY loss. Appendices A and B in the Supplemental Information provide detailed explanations of the cal-culation of each parameter in Table 1 and
a detailed description of the Markov model, respectively.
Analysis Outcomes
The combined decision tree and Markov models quantified the number of peri-natal and early childhood infections from infants born to HBsAg-positive women. The other main outcome measures were QALYs, lifetime costs, and incremental cost per QALY gained. Costs were evalu-ated from the health care system per-spective and expressed in 2010 US dollars. Future costs and QALYs were discounted at a 3% annual rate.11,12
For each strategy, expected health outcomes were the number of perinatal and childhood infections and QALYs lost with infection. Expected total costs were the sum of strategy costs and the present value of discounted future health care costs associated with monitoring and treating HBV infection and its complications.
Cost-effectiveness Analysis
ICERs were estimated.23The ICER
rep-resents the additional cost to achieve 1 less QALY loss due to infection. The preferred strategy is determined by comparing the ICER to what decision makers are willing to pay for an addi-tional QALY. No consensus has been reached on decision makers’ willing-ness to pay in the United States, al-though a $50 000/QALY benchmark has been used in several studies.24
Proba-bilistic sensitivity analysis was con-ducted to incorporate uncertainty in model parameters. Monte Carlo simu-lation was used to calculate the com-bined impact of the model’s various uncertainties.25The distributions used
are presented in Table 1. Uncertainty in the model was described using a cost-effectiveness acceptability curve (CEAC)23
to graphically show the probability that 1 strategy is more cost-effective than the other based on decision makers’ will-ingness to pay for an additional QALY.11,23
Sensitivity Analyses
One-way sensitivity analyses were conducted to estimate the impact of changing each key parameter in-dividually. A series of multiway sensi-tivity analyses changed several variables simultaneously to create 6 hypothetical scenarios: (1) pessimistic and optimistic vaccine efficacy sce-narios, using lower or upper bounds of the confidence interval (CI) from Lee et al26forfirst dose of vaccine and HBIG
and 50% or 10% cut in the remaining variables’efficacy, respectively; (2) no maternal screening cost: the cost of screening all pregnant women in both strategies was excluded; (3) same di-agnosis probability: assumed all peri-natal and childhood infections were diagnosed at infection (early di-agnosis); (4) perfect PHBPP: assumed that all infants born to HBsAg-positive women were identified and managed by a perfect program (100% coverage), all infants received HBIG and HepB vaccine within 24 hours and completed all doses within 9 months, and all infants were serologically tested post-vaccination; (5) No PHBPP, where all
HBIG. Scenario 6 also assumed that PVST would be done at the same rate as in the program strategy.
Because program costs relied on self-reported data (as detailed in Appen-dix A in the Supplemental Information), which might not have captured all the identification and management-related costs, a threshold analysis on program costs was conducted.
RESULTS
Base-Case Results
Table 2 presents the cost-effectiveness results for the base-case analysis. The lifetime costs for the No PHBPP strategy were the costs of screening all pregnant women ($60 018 562), the cost of rou-tine vaccination ($1 943 035), and the long-term medical costs associated with late diagnosis of perinatal and childhood infections ($52 364 741). The PHBPP had higher lifetime costs ($120 319 857) and better health out-comes relative to No PHBPP. The life-time costs of the PHBPP included the costs of screening all pregnant women ($60 018 562), identifying in-fants born to HBsAg-positive women ($9 304 521), managing those infants ($8 977 101), the cost of PEP with HBIG and HepB vaccine, with additional HepB series and PVST for infants who failed to respond to the initial HepB vaccine se-ries ($4 221 035), and long-term HepB-related medical costs ($37 798 101). Compared with No PHBPP, the PHBPP was associated with 2351 fewer total infections (1485 perinatal and 866 childhood), 2304 less QALYs lost, and an ICER of $2602 per QALY. Hence, if decision
makers are willing to pay at least $2602 per QALY gained, the PHBPP can be con-sidered cost-effective.
Figure 2 presents the CEAC. The prob-ability that the PHBPP is cost-effective increases as health gains are more highly valued; if decision makers are willing to pay∼$6000 for an additional QALY, the PHBPP is cost-effective.
Sensitivity Analyses
Figure 3 shows the effect of the 1-way sensitivity analyses on the ICERs. The probability of HBV transmission had the highest impact on the ICER. With higher transmission probabilities, the program was more cost-effective, and with lower transmission probabilities, the ICER was higher. Overall, changing each variable had a moderate to small
effect, and the ICER never surpassed $6500 per QALY.
Table 3 presents the results of the multiway sensitivity analyses. Under a pessimistic vaccine efficacy scenario, the PHBPP was slightly more costly and less effective than in the base-case scenario, with a slightly higher ICER ($3060 per QALY). Under the optimistic vaccine efficacy scenario, the PHBPP had lower costs and higher QALYs gained than in the base-case scenario. Excluding the cost of screening all pregnant women did not have an im-pact on the ICER. With early diagnosis of all infections, the PHBPP was cost-saving (less costly and more effective than vaccination only). This is caused by the higher cost and lower QALY loss related to early diagnosis of perinatal
TABLE 2 Base-Case Estimates of Lifetime Costs, Infections, Perinatal Infections, Childhood Infections, and QALYs Lost for No PHBPP and PHBPP, Together With Incremental Analysis
Total Costa Total
Infections
Perinatal Infections
Childhood Infections
Total QALYs Losta
ICER ($/ QALY)
No PHBPP $114 325 741 6816 4423 2393 6476
PHBPP $120 319 857 4464 2938 1527 4173
PHBPP Versus No PHBPP $5 994 115 22351 21485 2866 22304 $2602
aCosts and QALYs are discounted at a 3% annual rate. Costs in US dollars at a 2010 price base.
FIGURE 2
FIGURE 3
Sensitivity analysis. Shows the range of ICERs (horizontal axis; $/QALY) for lower and upper bound input values (vertical axis), when the PHBPP is compared with no program. For example, higher transmission rate leads to a more cost-effective program and vice versa.
TABLE 3 Multiway Sensitivity Analysis: What-If Scenarios
Total Cost, $a Total
Infections
Total Perinatal Infections
Total Childhood Infections
Total QALYs Losta
ICER, $ ($/QALY)
(1a) Pessimistic vaccine efficacy scenario
No PHBPP 124 070 020 8084 5246 2838 7681
PHBPP 131 789 282 5571 3682 1889 5159 3060
(1b) Optimistic vaccine efficacy scenario
No PHBPP 95 993 164 4430 2874 1555 4209
PHBPP 104 482 875 2669 1752 918 2509 4994
(2) No maternal screening cost
No PHBPP 54 307 179 6816 4423 2393 6476
PHBPP 60 301 294 4464 2938 1527 4173 2602
(3) Same diagnosis probability (all diagnosed at infection)
No PHBPP 196 488 335 6816 4423 2393 3998
PHBPP 170 959 339 4414 2938 1476 2627 Cost saving
(4) Perfect PHBPP
No PHBPP 114 325 741 6816 4423 2393 6476
PHBPP 133 862 135 1257 1109 148 922 3517
(5) No PHBPP where allfirst HepB doses#72 h are given with HBIG, no PVST
No PHBPP 103 458 773 5098 3308 1790 4844
PHBPP 114 658 166 3570 2357 1212 3322 7358
(6) No PHBPP where allfirst HepB doses#72 h are given with HBIG, with PVST
No PHBPP 119 464 037 4941 3308 1632 4297
PHBPP 122 996 909 3487 2357 1130 3037 2804
and childhood infections. Under the assumption of a perfect program, the higher costs of the program ($133 862 135 vs $120 319 857 in the base-case) led to many more infections avoided and hence, less QALYs lost. Under this as-sumption, there were only 1257 infec-tions and the ICER was $3517 per QALY. Providing HBIG to all infants who received afirst dose of HepB within 72 hours in the No PHBPP strategy resulted in an ICER of $7358 per QALY. This is related to the higher impact of this assumption in the No PHBPP strategy where the higher costs related to HBIG administration are offset by lower future complication costs and QALYs lost related to HepB infections. However, also providing PVST in the No PHBPP strategy reduced the ICER of sce-nario 5 to $2804 per QALY because PVST leads to earlier treatment but reduces only childhood infections and not peri-natal infections, which are associated with higher future costs.
The threshold analysis on the program costs showed that assuming a $50 000 per QALY maximum willingness to pay, the cost of PHBPP identification could be up to $54 000 per infant and the costs of PHBPP management could be up to $68 000 per infant. This is well above the base-case values of $783 and $769 for the costs of identification and management per infant.
DISCUSSION
When the PHBPP is compared with a strategy that follows ACIP recom-mendations without the support of the program, the ICER is $2602 per QALY, and when this strategy also considers HBIG and HBIG with PVST, the ICER is between $7358 and $2804 per QALY, which by most standards suggests that the PHBPP is cost-effective in avoiding perinatal and childhood infections.30,31
The costs and outcomes of immuniza-tion strategies to prevent HBV trans-mission in the United States have been evaluated.2 Comparing prevention of
perinatal HBV infection with a situation of no immunization, in 1991 Margolis et al2reported a total of 4703 perinatal
and childhood infections prevented from 11 400 HBsAg-positive women. To understand our results within the context of those presented by Margolis et al,2we compared the PHBPP to a
hy-pothetical scenario of no vaccination in a separate analysis (results available on request). Scaled to our estimate of 24 784 HBsAg-positive mothers, the number of infections prevented in Margolis et al2would be analogous to
10 224 infections avoided, close to our estimate of 9159 infections prevented when the PHBPP is compared with a situation of no immunization. The slightly lower number of infections prevented in our models is caused by the use of a lower transmission rate (updated to take into account current seroprevalence estimates), and a slightly lower efficacy of PEP that takes into account current compliance rates by timing offirst and remaining doses of PEP doses. Margolis et al2 did not
account for PEP compliance (they as-sumed the same value as routinely administered vaccines) and did not cost a specific perinatal prevention program. Therefore, program cost estimates are not directly compara-ble. Margolis et al2presented
cost-effectiveness results from a third-part payer’s perspective in which only direct medical costs were included. They also presented net benefit estimates from a broader perspective in which medical direct costs and morbidity- and mortality-related work-loss costs were included. When a broader perspective was adopted, Margolis et al2reported
that the perinatal prevention strategy generated cost savings. Following our health care system perspective on costs and health economic guidelines that recommend that mortality-related productivity losses should not be in-cluded in cost-effectiveness studies with QALYs, we excluded mortality-related
work-loss costs.11,12 Thus, we do not
compare our ICER with that presented by Margolis et al,2because the authors
did not present ICERs in the form of cost per QALYs and included different cost categories.
Other data limitations could have af-fected the results. The HepB vaccine efficacy with HBIG starting within 24 hours of birth was taken from a recent meta-analysis based on 3 trials, and HepB vaccine efficacy without HBIG was based on 4 trials.32Despite the small
number of studies, the estimates are within the range of results from studies not included because they were not randomized controlled trials.33,34 The
efficacy of HepB vaccine and HBIG when the first dose is delayed and when all vaccine doses are not completed on time was determined by the authors’ calculations relying on 2 studies.17,18
These areas of uncertainty were con-sidered in the probabilistic and multi-way sensitivity analyses.
Another important data limitation relates to the cost of the PHBPP. Program costs were based on aggregate data reported by PHBPP grantees. We ex-cluded outliers and used bootstrap techniques to account for imperfections of the data. However, it is possible that cross-subsidies (eg, office space, utili-ties, shared equipment, hospital per-sonnel time for communication, and liaising with PHBPP staff) were not captured in the reports. More accurate costs are needed for future analyses.
In addition to the data limitations, more general issues remain. Some benefits of the PHBPP have been underestimated. Recent evidence suggests vaccination confers immunity into early adulthood.35–37
herd immunity, which would require a dynamic transmission model approach in which the risk of infection changes over time. Our results showed that the program is a potentially cost-effective intervention, even without the additional benefits that would accrue from dynamic effects like herd immunity. A dynamic transmission model might further en-hance this result. Finally, the benefits of PHBPP might have been further un-derestimated because we did not include maternal evaluation and management of household and sexual contacts.
CONCLUSIONS
This study presents the first cost-effectiveness analysis of the US PHBPP. The simulation of a perfect PHBPP sce-nario showed that an expansion of the current recommendations to all infants at risk would lead to a reduced number of perinatal and childhood infections, with an ICER of $3517 per QALY. Our model pre-dicted that the current PHBPP represented a cost-effective use of resources, and that expansion of the program could represent an economically efficient method to pre-vent further morbidity and mortality.
ACKNOWLEDGMENTS
We acknowledge the contributions by Perinatal Hepatitis B Prevention Coordi-nators Julie Lazaroff, New York City Department of Health and Mental Hy-giene, and Patrick Fineiis, Michigan De-partment of Community Health, for providing useful comments on the model; and by Qian Li from the CDC’s National Center for Immunization and Respira-tory Diseases who analyzed data from the 2010 National Immunization Pro-gram to determine HepB vaccine cover-age at intervals relevant to this analysis.
REFERENCES
1. Smith EA, Jacques-Carroll L, Walker TY, Sirotkin B, Murphy TV. The national Peri-natal Hepatitis B Prevention Program, 1994-2008.Pediatrics. 2012;129(4):609–616 2. Margolis HS, Coleman PJ, Brown RE, Mast EE, Sheingold SH, Arevalo JA. Prevention of hepatitis B virus transmission by immuni-zation. An economic analysis of current recommendations.JAMA. 1995;274(15):1201– 1208
3. Beasley RP, Trepo C, Stevens CE, Szmuness W. The e antigen and vertical transmission of hepatitis B surface antigen Am J Epi-demiol. 1977;105(2):94–98
4. Mast EE, Margolis HS, Fiore AE, et al; Advi-sory Committee on Immunization Practices (ACIP). A comprehensive immunization strategy to eliminate transmission of hep-atitis B virus infection in the United States: recommendations of the Advisory Com-mittee on Immunization Practices (ACIP) part 1: immunization of infants, children, and adolescents. MMWR Recomm Rep. 2005;54(RR-16):1–31
5. Goldstein ST, Zhou FJ, Hadler SC, Bell BP, Mast EE, Margolis HS. A mathematical model to estimate global hepatitis B dis-ease burden and vaccination impact.Int J Epidemiol. 2005;34(6):1329–1339
6. Hutton DW, Tan D, So SK, Brandeau ML. Cost-effectiveness of screening and vacci-nating Asian and Pacific Islander adults for hepatitis B. Ann Intern Med. 2007;147(7): 460–469
7. Pisu M, Meltzer MI, Lyerla R. Cost-effectiveness of hepatitis B vaccination of prison inmates. Vaccine. 2002;21(3-4):312– 321
8. Jacobs RJ, Saab S, Meyerhoff AS. The cost effectiveness of hepatitis immunization for US college students.J Am Coll Health. 2003; 51(6):227–236
9. Kim SY, Billah K, Lieu TA, Weinstein MC. Cost effectiveness of hepatitis B vaccination at HIV counseling and testing sites.Am J Prev Med. 2006;30(6):498–506
10. Krahn M, Guasparini R, Sherman M, Detsky AS. Costs and cost-effectiveness of a universal, school-based hepatitis B vaccination program.
Am J Public Health. 1998;88(11):1638–1644 11. Drummond M, Sculpher M, Torrance G,
O’Brien B, Stoddart G. Methods for the Economic Evaluation of Health Care Pro-grammes. 3rd ed. Oxford, UK: Oxford Uni-versity Press; 2005
12. Gold MR, Siegel JE, Russel LB, Weinstein MC.
Cost Effectiveness in Health and Medicine. New York, NY: Oxford University Press; 1996
13. Sonnenberg FA, Beck JR. Markov models in medical decision making: a practical guide.
Med Decis Making. 1993;13(4):322–338 14. Hunink M, Glaziou P, Siegel J, Weeks J,
Pliskin J, Elstein A. Decision Making in Health and Medicine. Integrating Evidence and Values. Cambridge, UK: Cambridge University Press; 2001
15. Koumans EHA, Rosen J, van Dyke MK, et al; ABC and DHAP/RTI teams. Prevention of mother-to-child transmission of infections during pregnancy: implementation of recommended interventions, United States, 2003-2004.Am J Obstet Gynecol. 2012;206(2):e1–, e11 16. Martin JA, Hamilton BE, Ventura SJ, et al.
Births:final data for 2009. Natl Vital Stat Rep. 2011;60(1):1–70
17. Marion SA, Pastore MT, Pi DW, Mathias RG. Long-term follow-up of hepatitis B vaccine in infants of carrier mothers. Am J Epi-demiol. 1994;140(8):734–746
18. Kohn MA, Farley TA, Scott C. The need for more aggressive follow-up of children born to hepatitis B surface antigen-positive moth-ers: lessons from the Louisiana Perinatal Hepatitis B Immunization Program. Pediatr Infect Dis J. 1996;15(6):535–540
19. Tharmaphornpilas P, Rasdjarmrearnsook AO, Plianpanich S, Sa-nguanmoo P, Poovorawan Y. Increased risk of developing chronic HBV infection in infants born to chronically HBV infected mothers as a result of delayed sec-ond dose of hepatitis B vaccination.Vaccine. 2009;27(44):6110–6115
20. Asian Liver Center. Hepatitis B statistics for Asians and Pacific Islanders. Stanford School of Medicine. Available at: http://liver. stanford.edu/Education/faq.html. Accessed September 9, 2012
21. Lin SY, Chang ET, So SK. Why we should routinely screen Asian American adults for hepatitis B: a cross-sectional study of Asians in California.Hepatology. 2007;46(4):1034–1040 22. Shuler CM, Fiore AE, Neeman R, et al.
Re-duction in hepatitis B virus seroprevalence among U.S.-born children of foreign-born Asian parents—benefit of universal infant hepatitis B vaccination. Vaccine. 2009;27 (43):5942–5947
23. Briggs A, Sculpher M, Klaxton C. Decision Modelling for Health Economic Evaluation. New York, NY: Oxford University Press; 2006
threshold.Expert Rev Pharmacoecon Out-comes Res. 2008;8(2):165–178
25. Doubilet P, Begg CB, Weinstein MC, Braun P, McNeil BJ. Probabilistic sensitivity analysis using Monte Carlo simulation. A practical ap-proach.Med Decis Making. 1985;5(2):157–177 26. Lee C, Gong Y, Brok J, Boxall EH, Gluud C. Hepatitis B immunisation for newborn infants of hepatitis B surface antigen-positive moth-ers.Cochrane Database Syst Rev. 2006;2006 (2):CD004790
27. Centers for Disease Control and Prevention (CDC). Estimated vaccination coverage for hepatitis B vaccine among children from birth to 3 days of age 2010. Available at: www2a. cdc.gov/nip/coverage/nis/nis_iap3.asp? fmt=v&rpt=tab03_antigen_state&qtr=Q1/ 2010-Q4/2010. Accessed September 4, 2012
28. Centers for Disease Control and Prevention (CDC). Estimated vaccination coverage for hepatitis B vaccine among children from birth to 3 days of age 2009. www2a.cdc.gov/ nip/coverage/nis/nis_iap2.asp?fmt=v&rpt= tab03_antigen_state&qtr=Q1/2009-Q4/2009. Accessed September 4, 2012
29. Centers for Disease Control and Prevention (CDC). Estimated vaccination coverage with individual vaccines by 3 months of age 2010. Available at: www2a.cdc.gov/nip/coverage/ nis/nis_iap3.asp?fmt=v&rpt=tab04_3mo_ iap&qtr=Q1/2010-Q4/2010. Accessed September 4, 2012
30. Braithwaite RS, Meltzer DO, King JT Jr, Leslie D, Roberts MS. What does the value of modern medicine say about the $50,000 per quality-adjusted life-year decision rule?
Med Care. 2008;46(4):349–356
31. Neumann PJ, Weinstein MC. Legislating against use of cost-effectiveness information.
N Engl J Med. 2010;363(16):1495–1497 32. Lee CF, Gong Y, Brok J, Boxall EH, Gluud C.
Effect of hepatitis B immunisation in new-born infants of mothers positive for hepati-tis B surface antigen: systematic review and meta-analysis.BMJ. 2006;332(7537):328–336
33. Beasley RP, Hwang LY. Postnatal infectivity of hepatitis B surface antigen-carrier moth-ers.J Infect Dis. 1983;147(2):185–190 34. Schillie SF, Murphy TV. Seroprotection after
recombinant hepatitis B vaccination among newborn infants: a review.Vaccine. 2013;31 (21):2506–2516
35. McMahon BJ, Dentinger CM, Bruden D, et al. Antibody levels and protection after hepatitis B vaccine: results of a 22-year follow-up study and response to a booster dose.J Infect Dis. 2009;200(9):1390–1396 36. Poovorawan Y, Chongsrisawat V, Theamboonlers
A, et al. Evidence of protection against clin-ical and chronic hepatitis B infection 20 years after infant vaccination in a high en-demicity region. J Viral Hepat. 2011;18(5): 369–375
37. Zhu C-L, Liu P, Chen T, et al. Presence of immune memory and immunity to hepa-titis B virus in adults after neonatal hep-atitis B vaccination. Vaccine. 2011;29(44): 7835–7841
38. Ott JJ, Stevens GA, Wiersma ST. The risk of perinatal hepatitis B virus transmission: hepatitis B e antigen (HBeAg) prevalence estimates for all world regions.BMC Infect Dis. 2012;12(1):131
39. Hwang LY, Roggendorf M, Beasley RP, Deinhardt F. Perinatal transmission of hepatitis-B virus- role of maternal HBeAg and anti-HBc IgM.J Med Virol. 1985;15(3): 265–269
40. Okada K, Kamiyama I, Inomata M, Imai M, Miyakawa Y, Mayumi M. e antigen and anti-e in thanti-e santi-erum of asymptomatic carrianti-er mothers as indicators of positive and negative transmission of hepatitis B virus to their infants.N Engl J Med. 1976;294(14): 746–749
41. Shiraki K, Yoshihara N, Sakurai M, Eto T, Kawana T. Acute hepatitis-B in infants born to carrier mothers with the antibody to hepatitis-B antigen. J Pediatr. 1980;97(5): 768–770
42. Stevens CE, Neurath RA, Beasley RP, Szmuness W. HBeAg and anti-HBe detection by radioimmunoassay—correlation with ver-tical transmission of hepatitis-B virus in Taiwan.J Med Virol. 1979;3(3):237–241 43. Centers for Disease Control and Prevention
(CDC). CDC vaccine price list. 2012. Avail-able at: www.cdc.gov/vaccines/programs/ vfc/awardees/vaccine-management/price-list/ index.html. Accessed September 4, 2012
44. Miriti MK, Billah K, Weinbaum C, et al. Economic benefits of hepatitis B vaccina-tion at sexually transmitted disease clinics in the US. Public Health Rep. 2008;123(4): 504–513
45. Centers for Medicare & Medicaid Services. Fee schedule reimbursement rate. 2012. Avail-able at: https://www.cms.gov/transmittals/ downloads/R1209CP.pdf. Accessed September 4, 2012
46. Centers for Medicare & Medicaid Services. Clinical diagnostic laboratory fee (CLAB). 2012. Available at: www.cms.gov/Medicare/Medicare-Fee-for-Service-Payment/ClinicalLabFeeSched/ index.html?redirect=/ClinicalLabFeeSched/ 02_clinlab.asp. Accessed September 4, 2012
47. Centers for Medicare & Medicaid Services. Physician fee schedule. 2012. Available at: https://www.cms.gov/apps/physician-fee-schedule/search/search-criteria.aspx. Accessed September 4, 2012
48. Briggs AH, Wonderling DE, Mooney CZ. Pulling cost-effectiveness analysis up by its bootstraps: a non-parametric approach to confidence interval estimation.Health Econ. 1997;6(4):327–340
49. Hoerger TJ, Wittenborn J, Uzunangelov V, Simpson S.Costs and Benefits Associated With Different Policy Approaches to Pre-venting and Controlling Viral Hepatitis: Fi-nal Report Prepared for the Department of Health and Human Services Office of the Assistant Secretary for Policy Evaluation. Research Triangle Park, NC: RTI Inter-national; 2012
(Continued fromfirst page)
PEDIATRICS (ISSN Numbers: Print, 0031-4005; Online, 1098-4275).
Copyright © 2014 by the American Academy of Pediatrics
FINANCIAL DISCLOSURE:The authors have indicated they have nofinancial relationships relevant to this article to disclose.
FUNDING:RTI International’s work on the project was supported by Centers for Disease Control and Prevention contract 200-2009-30991 TO3. Thefindings and conclusions in this article are those of the authors and do not necessarily represent the official position of the Centers for Disease Control and Prevention or the Agency for Toxic Substances and Disease Registry.
DOI: 10.1542/peds.2013-0718 originally published online January 6, 2014;
2014;133;243
Pediatrics
Schillie, Christina Bradley and Trudy V. Murphy
Carolina Barbosa, Emily A. Smith, Thomas J. Hoerger, Nancy Fenlon, Sarah F.
Program
Cost-effectiveness Analysis of the National Perinatal Hepatitis B Prevention
Services
Updated Information &
http://pediatrics.aappublications.org/content/133/2/243
including high resolution figures, can be found at:
References
http://pediatrics.aappublications.org/content/133/2/243#BIBL
This article cites 27 articles, 2 of which you can access for free at:
Subspecialty Collections
_sub
http://www.aappublications.org/cgi/collection/vaccine:immunization
Vaccine/Immunization
b
http://www.aappublications.org/cgi/collection/infectious_diseases_su
Infectious Disease
ne_sub
http://www.aappublications.org/cgi/collection/maternal_fetal_medici
Maternal and Fetal Medicine
http://www.aappublications.org/cgi/collection/gynecology_sub
Gynecology
following collection(s):
This article, along with others on similar topics, appears in the
Permissions & Licensing
http://www.aappublications.org/site/misc/Permissions.xhtml
in its entirety can be found online at:
Information about reproducing this article in parts (figures, tables) or
Reprints
http://www.aappublications.org/site/misc/reprints.xhtml
DOI: 10.1542/peds.2013-0718 originally published online January 6, 2014;
2014;133;243
Pediatrics
Schillie, Christina Bradley and Trudy V. Murphy
http://pediatrics.aappublications.org/content/133/2/243
located on the World Wide Web at:
The online version of this article, along with updated information and services, is
http://pediatrics.aappublications.org/content/suppl/2014/01/02/peds.2013-0718.DCSupplemental
Data Supplement at:
by the American Academy of Pediatrics. All rights reserved. Print ISSN: 1073-0397.