Use of Electronic Medical Record
–
Enhanced Checklist
and Electronic Dashboard to Decrease CLABSIs
abstract
OBJECTIVES: We hypothesized that a checklist enhanced by the elec-tronic medical record and a unit-wide dashboard would improve compliance with an evidence-based, pediatric-specific catheter care bundle and decrease central line–associated bloodstream infections (CLABSI).
METHODS:We performed a cohort study with historical controls that included all patients with a central venous catheter in a 24-bed PICU in an academic children’s hospital. Postintervention CLABSI rates, com-pliance with bundle elements, and staff perceptions of communication were evaluated and compared with preintervention data.
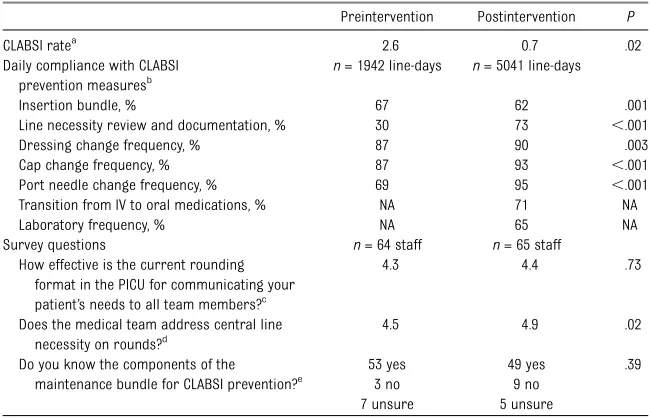
RESULTS:CLABSI rates decreased from 2.6 CLABSIs per 1000 line-days before intervention to 0.7 CLABSIs per 1000 line-days after intervention. Analysis of specific bundle elements demonstrated increased daily documentation of line necessity from 30% to 73% (P , .001), increased compliance with dressing changes from 87% to 90% (P= .003), increased compliance with cap changes from 87% to 93% (P,
.001), increased compliance with port needle changes from 69% to 95% (P , .001), but decreased compliance with insertion bundle documentation from 67% to 62% (P = .001). Changes in the care plan were made during review of the electronic medical record checklist on 39% of patient rounds episodes.
CONCLUSIONS:Use of an electronic medical record–enhanced CLABSI prevention checklist coupled with a unit-wide real-time display of adherence was associated with increased compliance with evidence-based catheter care and sustained decrease in CLABSI rates. These data underscore the potential for computerized interventions to promote compliance with proven best practices and prevent patient harm.Pediatrics2014;133:e738–e746
AUTHORS:Natalie M. Pageler, MD,a,bChristopher A.
Longhurst, MD, MS,b,c,dMatthew Wood, PhD,eDavid N.
Cornfield, MD,aJaap Suermondt, PhD,fPaul J. Sharek,
MD,d,eand Deborah Franzon, MDa
aCenter for Excellence in Pulmonary Biology, Divisions of Pulmonary, Asthma and Critical Care Medicine,cDivision of Systems Medicine, anddDivision of General Pediatrics, Department of Pediatrics, Stanford University Medical School, Stanford, California;bDepartment of Clinical Informatics, and eCenter for Quality and Clinical Effectiveness, Lucile Packard Children’s Hospital at Stanford, Stanford, California; andfHP Laboratories, Palo Alto, California
KEY WORDS
CLABSI, EMR, dashboard, evidence-based guidelines, maintenance bundle
ABBREVIATIONS
ARIMA—autoregressive integrated moving average CLABSI—central line–associated bloodstream infection EMR—electronic medical record
IV—intravenous
LPCH—Lucile Packard Children’s Hospital
NACHRI—National Association of Children’s Hospitals and Related Institutions
PRISM III—Pediatric Risk of Mortality III
Drs Pageler and Franzon conceptualized and designed the project, designed the data collection instruments, coordinated and supervised data collection, and drafted the initial manuscript; Drs Longhurst and Sharek conceptualized and designed the project, participated in designing the data collection instruments, and critically reviewed and revised the manuscript; Dr Wood carried out thefinal analyses and critically reviewed and revised the manuscript; Drs Cornfield and Suermondt conceptualized and designed the project and critically reviewed and revised the manuscript; and all authors approved thefinal manuscript as submitted.
www.pediatrics.org/cgi/doi/10.1542/peds.2013-2249
doi:10.1542/peds.2013-2249
Accepted for publication Dec 3, 2013
Address correspondence to Natalie M. Pageler, MD, Center for Excellence in Pulmonary Biology, Division of Pediatric Critical Care Medicine, Stanford University Medical School Medicine, 770 Welch Road, Suite 350, Stanford, CA 94304. E-mail:
PEDIATRICS (ISSN Numbers: Print, 0031-4005; Online, 1098-4275).
Copyright © 2014 by the American Academy of Pediatrics
In 1999 and 2001, the Institute of Med-icine published the landmark reports
To Err Is Human and Crossing the Quality Chasm, which highlighted the excessive number of preventable medical errors and called for urgent changes to our health care system to improve patient safety and quality of care.1,2Among the highly prevalent and preventable sources of patient harm are hospital-acquired infections, which increase morbidity, mortality rates, and health care costs in both adults and children.3–7An estimated 250 000 hospital-acquired bloodstream infec-tions occur each year,7 and central line–associated bloodstream infec-tions (CLABSIs) are the most common hospital-acquired infection in children admitted to the PICU.8,9Although many evidence-based interventions have been demonstrated to reduce patient harm, including CLABSIs,10 implementa-tion in critically ill patients is often con-founded by the sheer volume of tasks that must be completed for each patient throughout the day.11
To effectively address all the potential sources of patient harm, systems of care must be developed to standardize care, improve communication, and promote timely access to information at the point of care.12–16 The electronic medical record (EMR), with integrated nursing documentation, computerized physician order entry, and clinical de-cision support, has the potential to fa-cilitate achievement of these goals.14,17 With thoughtful design and imple-mentation, these tools can be used to automate practices and highlight compliance with interventions via continuously updated visual displays that extract the most up-to-date in-formation directly from the EMR.11
This study was designed to test the hypothesis that successful implementa-tion and adopimplementa-tion of an EMR-enhanced checklist tethered to a real-time unit-wide dashboard would decrease CLABSIs
in the PICU. The secondary hypothesis was that this intervention could im-prove care provider team communi-cation and knowledge.
METHODS
Setting
Lucile Packard Children’s Hospital (LPCH) is a 303-bed, freestanding, quaternary care academic children’s hospital with a 24-bed PICU. The PICU at LPCH cares for a wide range of critically ill patients, in-cluding solid organ and bone marrow transplant recipients, trauma patients, and a full complement of medical and surgical patients. Postoperative patients with congenital heart disease are man-aged in a separate cardiovascular ICU. There are∼1300 admissions per year in the PICU. The PICU has implemented an EMR (Cerner Corporation, Kansas City, MO) with nursing documentation, bio-medical device integration, physician documentation, and computerized pro-vider order entry (Healthcare In-formation and Management Systems Society level 6).18 This project was reviewed and approved by the Stanford University School of Medicine In-stitutional Review Board. We followed the Standards for Quality Improvement Reporting Excellence publication guide-lines for quality improvement in the implementation and reporting of this initiative.19
Prework
LPCH participated in the National As-sociation of Children’s Hospitals and Related Institutions (NACHRI) collabo-rative efforts to reduce CLABSI rates from June 2009 to November 2010. This included implementation of standard-ized central line insertion and mainte-nance bundles in the PICU.20 The collaborative showed that focused attention on adherence to pediatrics-specific central line insertion and main-tenance care resulted in significant
reductions in PICU CLABSI rates.21 Addi-tional institution-specific measures were implemented, including development of a PICU-based CLABSI prevention work-group, an executive oversight committee, and a process for root cause analysis of every CLABSI event. All CLABSIs were reviewed by the institutional infection control team.
Through the collaborative efforts, CLABSI rates in the PICU decreased to 2.4 per 1000 line-days, with a goal to reduce rates further. Institutional compliance with specific elements of the recommended central line maintenance bundle for catheter care remained as low as 30%, well below the collaborative goal of 80%. To increase the efficiency, sustainability, and educational impact of the CLABSI reduction efforts at LPCH, we developed the computerized intervention described in this study.
Intervention
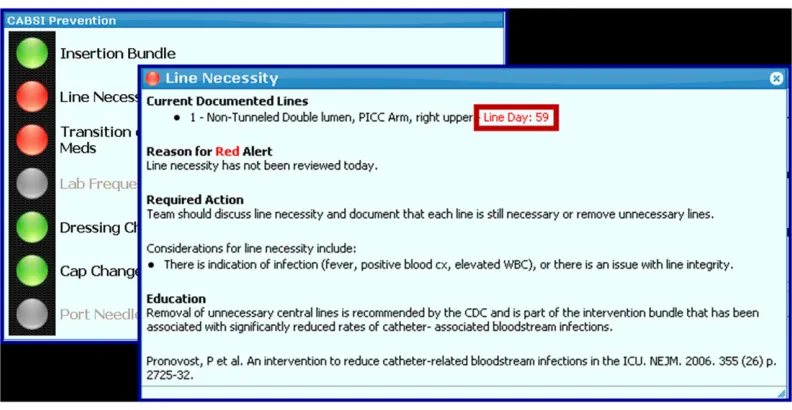
and port needle change information was displayed only when port needles were in place. The checklist was further en-hanced by the provision of pertinent in-formation and education to aid clinician decision-making (eg, number of line-days, links to institutional policy and relevant literature on dressing changes, intravenous medications for possible conversion to oral formulations) (Fig 2).
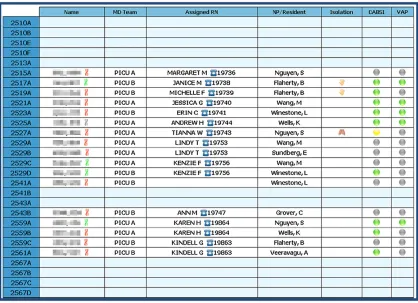
In addition, an electronic multipatient dashboard was displayed on a large monitor at a central location in the PICU (Fig 3). The dashboard provided a real-time unit-wide overview of critical
patient data, specifically highlighting compliance with the maintenance bundle for CLABSI prevention for all eligible PICU patients.
The EMR-enhanced checklist was de-signed for use during rounds on each patient. All PICU attending physicians, fellows, and nurses received training on the use of the EMR-enhanced checklists and unit-wide dashboard before imple-mentation. Throughout the implemen-tation period (May 1–August 31, 2011), PICU nurse practitioners served as unit-based champions to promote use of the EMR-enhanced checklists on rounds.
Study Design
To determine the effect of the inter-vention on compliance with evidence-based guidelines, we conducted a co-hort study using historical controls in the PICU at LPCH. Participants were included if they were admitted to the PICU during the preintervention or postintervention period. Data on compliance with the prevention bun-dle were collected during the pre-intervention period (November 1, 2010 to April 30, 2011). Data on CLABSI rates were consistently collected from the onset of LPCH participation in
FIGURE 1
enhanced checklist. A unique tab was developed in the EMR for each individual patient to highlight critical clinical data and display EMR-enhanced checklists to ensure adherence to evidence-based protocols.
FIGURE 2
the NACHRI collaborative, so the pre-intervention period for CLABSI rates was June 2009 to April 30, 2011. The post-intervention period was September 1, 2011 to December 31, 2012. The period from May 1, 2011 to August 31, 2011 was treated as the implementation rollout and optimization period and was not included in the analysis. CLABSI rates were included in the analysis starting June 1, 2009, when we began involvement with the NACHRI collaborative efforts to reduce CLABSI, so that the only major difference between the pre-evaluation and postevaluation period for CLABSI rates in this study was the implementa-tion of the EMR-based checklists and dashboard. CLABSI rate data and com-pliance with the prevention guidelines were collected from data documented in the EMR.
Outcome Measures
The primary outcome measures were CLABSI rates and compliance with ele-ments of the CLABSI prevention bundle. The CLABSI prevention best practices assessed were compliance with insertion bundle best practices (captured via a form in the EMR that is completed by provider after line insertion), documen-tation of line necessity, appropriate tim-ing of dresstim-ing changes, appropriate timing of cap changes, and appropriate timing of port changes. Two checklist items were added to those in the NACHRI insertion and maintenance bundles: evaluation of possible transition of in-travenous (IV) medications to oral medi-cations and evaluation of appropriateness of laboratory frequency. These issueswere not assessed before the intervention and
therefore were not compared before and after intervention.
Secondary outcome measures included perceptions of team communication and CLABSI prevention knowledge based on survey. The anonymous survey was administered to all nurses, at-tending physicians, and pediatric crit-ical care medicine fellows working in the LPCH PICU immediately before the intervention and 6 months after the end of the implementation phase (Table 1). Time and motion studies were con-ducted randomly once per week for 6 months after the intervention to collect descriptive data about dashboard use, to record the time needed to review the dashboard, and to track the rate at which dashboard review resulted in a change in the patient’s plan.
FIGURE 3
Audit and survey data were collected and managed by using REDCap (Harvard Catalyst, Boston, MA) electronic data capture tools.22
Statistical Analysis
A quasiexperimental approach was used to determine the impact of the EMR-enhanced checklist on compliance with the maintenance bundle for CLABSI prevention and the effect on CLABSI rates. Initial analysis included a 2-sample
ttest assuming equal variances to assess differences in CLABSI rates. Changes in compliance with the components of the insertion and maintenance bundles in the preintervention and postintervention periods were analyzed by using x2 tests. To more rigorously evaluate the association between the intervention and the timing of the effect on CLABSI rates and to account for potential trends in the preintervention and postintervention periods, regression models were used to estimate CLABSI
rates that incorporated month-to-month trends as well as the intervention in-dicator variable. Autoregressive inte-grated moving average (ARIMA) analysis was used to model the potential auto-correlations in time.23Akaike informa-tion criterion was used for covariance model selection to avoid model over-parameterization.24 All models were adjusted for severity of illness using Pediatric Risk of Mortality III (PRISM-III) 12-hour scores.25
To evaluate the change in perception of team communication, Wilcoxon rank-sum tests were performed to test for a shift in the median response for the question with ordinal responses, and Fisher’s exact test was performed for the questions with yes–no responses. Descriptive statistics including mean and SD were calculated for the time added to rounds to review the dash-board.
R statistical software was used for statistical analysis.26
RESULTS
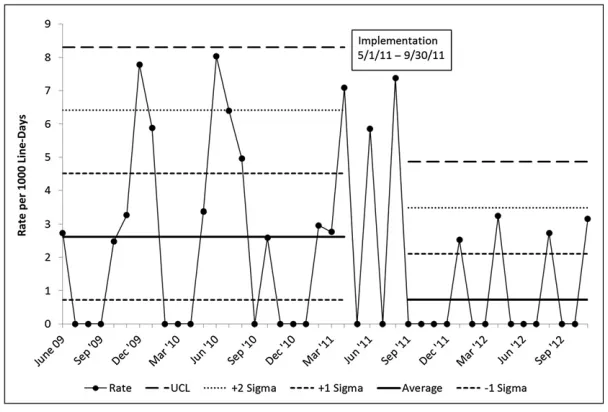
Rates of CLABSI decreased from 2.6 per 1000 line-days (19 CLABSIs/7322 total line-days) before intervention to 0.7 CLABSIs per 1000 line-days (7 CLABSIs/ 6155 total line-days) after intervention (Table 1, Fig 4). A regression analysis was performed to model CLABSI rates on both the intervention variable and severity of illness. The intervention variable remained statistically signifi -cant (P = .029) for the risk-adjusted CLABSI rates.
The ARIMA model includes estimates of correlation between the rate for any particular month with the rates for previous months. This allows us to take into account that rates that are ob-served over time may not be considered independent observations as in a typi-cal regression analysis. In this case the model identified that the rate on any particular month is correlated with the values 3 and 4 months before that month. One possible explanation for this might be that the occurrence of an infection may increase the staff awareness and diligence in carefully following protocol the few months that follow. Regardless of the reason, we are able to account for this correlation over time in the model and still estimate the effect of the intervention in reducing CLABSI rates. Given this possible auto-correlation, our model wasfit with an ARIMA model of order 4. In this model, the intervention variable (P, .0001) remained statistically significant. The estimated effect of the intervention is a rate reduction of 1.8 per 1000 line-days, with a 95% confidence interval of 0.32 to 2.55 per 1000 line-days.
For evaluation of compliance with components on the CLABSI prevention bundle, a total of 251 patients (1943 patient-days) were evaluated in the preintervention period and 609 patients (5041 patient-days) were evaluated in the postintervention period. Compli-ance improved for daily review and TABLE 1 Summary of Outcome Measurements in Preintervention and Postintervention
Populations
Preintervention Postintervention P
CLABSI ratea 2.6 0.7 .02
Daily compliance with CLABSI prevention measuresb
n= 1942 line-days n= 5041 line-days
Insertion bundle, % 67 62 .001
Line necessity review and documentation, % 30 73 ,.001
Dressing change frequency, % 87 90 .003
Cap change frequency, % 87 93 ,.001
Port needle change frequency, % 69 95 ,.001
Transition from IV to oral medications, % NA 71 NA
Laboratory frequency, % NA 65 NA
Survey questions n= 64 staff n= 65 staff
How effective is the current rounding format in the PICU for communicating your patient’s needs to all team members?c
4.3 4.4 .73
Does the medical team address central line necessity on rounds?d
4.5 4.9 .02
Do you know the components of the
maintenance bundle for CLABSI prevention?e
53 yes 49 yes .39
3 no 9 no
7 unsure 5 unsure
NA, not applicable.
aCLABSI per 1000 line-days.Prepresents analysis with 2-samplettest assuming equal variances. bPercentage compliance with CLABSI prevention best practices. Analyzed by usingx2tests.
cPreintervention and postintervention results represent the average score on a scale of 1 to 6, where 1 means“very
ineffective”and 6 means“very effective”. Analyzed with a Wilcoxon rank-sum test.
dPreintervention and postintervention results represent the average score on a scale of 1 to 6, where 1 means“never”and 6
means“every time I work”. Analyzed with a Wilcoxon rank-sum test.
documentation of line necessity (P,
.001), frequency of dressing changes (P= .003), frequency of cap changes (P,.001), and frequency of port needle changes (P= .001), but compliance with documentation of the insertion bundle decreased (P,.001) (Table 1). A logistic regression analysis was performed to evaluate the impact of severity of illness (as assessed by PRISM III scores) on the intervention effect. The changes in compliance with documentation for all variables remained statistically signifi -cant (all with P , .002) with PRISM scores incorporated into the model.
The time and motion studies were conducted 24 times, captured 193 separate episodes of patient rounds, and reflected 11 different attending intensivists. The dashboard was used in 84% of patient rounds episodes, and re-view of the checklists added an average of 37 seconds (SD 78 seconds) to rounds on each patient. A care change (eg, removal of a central line, change from IV to oral medications, reduction of laboratory frequency) was made during review of the checklist on 39% of the patient rounds episodes. Preimplementation and
post-implementation survey results are also described in Table 1. There was a 78% survey response rate before intervention and 77% response rate after interven-tion. After intervention, there was a sig-nificant increase in the perception that the medical team addresses central line necessity during rounds.
DISCUSSION
Implementation of automated clinical decision support, in the form of EMR-enhanced checklists and a unit-wide patient safety and quality dashboard, was associated with decreased CLABSI rates and improved compliance with CLABSI prevention best practices. The use of these real-time clinical decision support tools to promote ongoing quality improvement interventions was associated with significant improve-ments over the gains realized by pre-vious CLABSI prevention efforts.
There are several potential reasons that we were able to improve our CLABSI rates using this intervention. First, checklists in general have been shown to improve compliance with best
practices.20,27–29 Second, linking the checklist electronically to nursing and provider documentation, clinical de-cision support, and immediately ac-tionable orders resulted in real-time correction of any noncompliance. Third, integrating the checklist review into daily rounds ensured the regular, daily review of the checklist. Because the EMR was already being used in rounds at our institution, integrating the checklist into the EMR ensured ready access during rounds. Finally, continuous visual display of compli-ance on a unit-wide multipatient dash-board in the PICU increased awareness of gaps in compliance and facilitated unit-wide efforts to maintain compli-ance.
Checklists have the potential to be en-hanced by information technology. There is a growing body of evidence that in-formation technology and clinical de-cision support can facilitate compliance with evidence-based best practices and improve quality of care,1,2,30–33 and specifically can promote compliance with checklists.34A study of 19 Michigan ICUs participating in the Keystone Proj-ect to reduce CLABSI rates suggested that the presence of more sophisticated information technology in the ICUs was associated with greater reductions in CLABSI rates within the collaborative.34 Previous reports from our group offer additional support for the notion that computerized interventions in the PICU improved compliance with blood trans-fusion guidelines15and reduced unnec-essary laboratory use.16
As the number of evidence-based pa-tient safety interventions continues to climb,10a significant burden is placed on health care professionals to ensure compliance with all measures to pre-vent patient harm.11In fact, a previous effort to integrate paper checklists into PICU rounds at our own institution, though temporarily successful, proved unsustainable because of the additional
FIGURE 4
work burden imposed on providers.35 Integration and automation of these measures are critical determinants of durable prevention of patient harm.36 This intervention demonstrated that CLABSI prevention efforts can be en-hanced by embedding checklists in the EMR and enriching the checklists with data from the EMR and appropriate educational links. Although CLABSI pre-vention demonstrates proof of concept in this report, the tools are applicable to a wide array of quality improvement ini-tiatives. We are developing EMR-enhanced checklists to facilitate compliance with prevention efforts for ventilator-associated pneumonia, catheter-associated urinary tract infections, pressure ulcers, and deep vein thrombosis.
The unit-wide, multipatient dashboard added an extra layer of visibility to our CLABSI prevention efforts. Patient dash-boards represent a noninterruptive form of clinical decision support that provide real-time graphical representation of clinical data and can streamline infor-mation processing, facilitate situational awareness, and improve compliance with evidence-based guidelines.37,38Displaying the dashboard at the nursing station in the PICU enabled staff members to quickly review compliance problems and allocate resources appropriately.
The effects of this intervention on per-ceptions of team communication and knowledge are less clear. Although the audit data showed that the tool was incorporated into rounds at a high rate, and both the compliance data and survey data support the notion that there was more discussion of line ne-cessity on rounds, the survey data did not reveal a perception of overall im-proved team communication or knowl-edge of the CLABSI compliance bundle. The primary goals of improved com-pliance with patient safety interven-tions and decreased CLABSI rates were met, but greater understanding of the impact these tools have on provider
knowledge and attitudes might enable further refinement of these tools. More sensitive measures of knowledge and attitudes may provide better informa-tion about these effects with future interventions.
Although it was not within the scope of this study to do a formal cost analysis, we estimate a significant return on the initial investment to develop, program, and implement this intervention. This tool was developed with a $100 000 pilot study grant. The direct attributable cost of nosocomial bloodstream infec-tions in the PICU is approximately $39 000.4With an estimated decrease in CLABSIs of 1.8 per 1000 line-days attributable to this intervention and approximately 3700 line-days per year in our PICU, we estimated a cost savings of approximately $260 000 per year in our PICU.
There are several limitations of this study. First, we used a quasiexper-imental pre–post study design to evaluate the effect of the intervention. Therefore, although there was an as-sociation between the intervention and the desired effects, causation cannot be established. Second, efforts to im-plement all components of insertion and maintenance bundles were under way before, during, and after imple-mentation of the electronic checklist and dashboard. Thus, it is difficult to distinguish the impact of these efforts alone on compliance or CLABSI rates. Third, compliance assessments for several elements on the checklist (in-cluding dressing changes, cap changes, and port needle changes) were based directly on nursing documentation. We are not able to determine whether the improved compliance with these ele-ments was secondary to improved per-formance of the interventions or simply improved documentation by the nurse as a result of the reminders from the dashboard. Fourth, the elements of the insertion bundle were not captured in
routine nursing and physician clinical documentation but were captured via an electronic template completed by the provider after central line insertion. This processflow resulted in errors of omis-sion and varied rates of provider docu-mentation of central line insertion and may have contributed to the dashboard’s ineffectiveness for this element. Addi-tionally, these data were not captured reliably for lines that were placed in the operating room due to different pro-cesses for documentation. Finally, these results reflect outcomes in a single PICU with a high severity of illness, which may render the intervention less generalizable to settings with lower acuity of illness.
CONCLUSIONS
An EMR-enhanced patient checklist in conjunction with a unit-wide dashboard led to improved compliance with CLABSI prevention bundles, decreased CLABSI rates, and improved staff communica-tion. Using information technology to provide actionable checklists of evidence-based best practices and visible evidence of compliance can promote implemen-tation of care initiatives. Future re-search should evaluate whether tools such as these can be extended to au-tomate and facilitate compliance with multiple best practice bundles simulta-neously, thereby promoting a system of care to prevent multiple sources of pa-tient harm.
ACKNOWLEDGMENTS
REFERENCES
1. Institute of Medicine Committee on Quality of Healthcare in America. In: Kohn LT, Corrigan JM, Donaldson MS, eds.To Err Is Human. Building a Safer Health System. Washington, DC: National Academies Press; 2000:312
2. Institute of Medicine Committee on Qual-ity of Healthcare in America. Crossing the Quality Chasm: A New Health Sys-tem for the 21st Century. Washington, DC: National Academies Press; 2001: 1–358
3. Blot SI, Depuydt P, Annemans L, et al. Clin-ical and economic outcomes in critClin-ically ill patients with nosocomial catheter-related bloodstream infections. Clin Infect Dis. 2005;41(11):1591–1598
4. Elward AM, Hollenbeak CS, Warren DK, Fraser VJ. Attributable cost of nosocomial primary bloodstream infection in pediatric intensive care unit patients. Pediatrics. 2005;115(4):868–872
5. Yogaraj JS, Elward AM, Fraser VJ. Rate, risk factors, and outcomes of nosocomial pri-mary bloodstream infection in pediatric intensive care unit patients. Pediatrics. 2002;110(3):481–485
6. Slonim AD, Kurtines HC, Sprague BM, Singh N. The costs associated with nosocomial bloodstream infections in the pediatric in-tensive care unit.Pediatr Crit Care Med. 2001;2(2):170–174
7. Klevens RM, Edwards JR, Richards CLJ Jr, et al. Estimating health care–associated infections and deaths in U.S. hospitals, 2002.Public Health Rep. 2007;122(2):160– 166
8. Elward AM, Fraser VJ. Risk factors for nosocomial primary bloodstream infection in pediatric intensive care unit patients: a 2-year prospective cohort study. Infect Control Hosp Epidemiol. 2006;27(6):553– 560
9. Odetola FO, Moler FW, Dechert RE, VanDerElzen K, Chenoweth C. Nosocomial catheter-related bloodstream infections in a pedi-atric intensive care unit: risk and rates associated with various intravascular technologies.Pediatr Crit Care Med. 2003; 4(4):432–436
10. Center for Medicare and Medicaid Ser-vices. Partnership for patients. 2013. Avail-able at: http://partnershipforpatients.cms. gov/. Accessed June 4, 2013
11. Pronovost PJ, Bo-Linn GW. Preventing pa-tient harms through systems of care.JAMA. 2012;308(8):769–770
12. Luria JW, Muething SE, Schoettker PJ, Kotagal UR. Reliability science and patient
safety. Pediatr Clin North Am. 2006;53(6): 1121–1133
13. Amalberti R, Auroy Y, Berwick D, Barach P. Five system barriers to achieving ultrasafe health care. Ann Intern Med. 2005;142(9): 756–764
14. Committee on the Learning Health Care System in America, Institute of Medicine. Best Care at Lower Cost: The Path to Con-tinuously Learning Health Care in America. Washington, DC: National Academies Press; 2012:361
15. Adams ES, Longhurst CA, Pageler N, Widen E, Franzon D, Cornfield DN. Computerized physician order entry with decision sup-port decreases blood transfusions in chil-dren.Pediatrics. 2011;127(5). Available at: www.pediatrics.org/cgi/content/full/127/5/ e1112
16. Pageler NM, Franzon D, Longhurst CA, et al. Embedding time-limited laboratory orders within computerized provider order entry reduces laboratory utilization.Pediatr Crit Care Med. 2013;14(4):413–419
17. Osheroff JA, Teich JM, Levick D, et al. Im-proving Outcomes With Clinical Decision Support. 2nd ed. Chicago, IL: Healthcare Information and Management Systems So-ciety; 2012:323
18. Analytics HIMSS. Available at: www.hims-sanalytics.org. Accessed June 30, 2013
19. Davidoff F, Batalden P, Stevens D, Ogrinc G, Mooney S; SQUIRE Development Group. Publication guidelines for quality improve-ment in health care: evolution of the SQUIRE project. Qual Saf Health Care. 2008;17(17 suppl 1):i3–i9
20. Miller MR, Griswold M, Harris JM II, et al. Decreasing PICU catheter-associated blood-stream infections: NACHRI’s quality trans-formation efforts.Pediatrics. 2010;125(2): 206–213
21. Miller MR, Niedner MF, Huskins WC, et al; National Association of Children’s Hospi-tals and Related Institutions Pediatric In-tensive Care Unit Central Line–Associated Bloodstream Infection Quality Transfor-mation Teams. Reducing PICU central line– associated bloodstream infections: 3-year results.Pediatrics. 2011;128(5). Available at: www.pediatrics.org/cgi/content/full/128/ 5/e1077
22. Harris PA, Taylor R, Thielke R, Payne J, Gonzalez N, Conde JG. Research electronic data capture (REDCap)—a metadata-driven methodology and workflow process for providing translational research in-formatics support.J Biomed Inform. 2009; 42(2):377–381
23. Box G, Jenkins G. Time Series Analysis: Forecasting and Control. San Francisco, CA: Holden Day Publishing; 1976
24. Akaike H. A new look at the statistical model identification. IEEE. 1974;19(6):716– 723
25. Pollack MM, Patel KM, Ruttimann UE. PRISM III: an updated Pediatric Risk of Mortality score.Crit Care Med. 1996;24(5): 743–752
26. R Development Core Team. R: A language and environment for statistical computing. In: R Foundation Statistical Computing. Vienna, Austria: R Development Core Team; 2008
27. Pronovost P, Needham D, Berenholtz S, et al. An intervention to decrease catheter-related bloodstream infections in the ICU. N Engl J Med. 2006;355(26):2725–2732
28. Marsteller JA, Sexton JB, Hsu Y-J, et al. A multicenter, phased, cluster-randomized controlled trial to reduce central line– associated bloodstream infections in in-tensive care units.Crit Care Med. 2012;40 (11):2933–2939
29. Schulman J, Stricof R, Stevens TP, et al; New York State Regional Perinatal Care Centers. Statewide NICU central-line–associated bloodstream infection rates decline after bundles and checklists. Pediatrics. 2011; 127(3):436–444
30. Balas EA, Weingarten S, Garb CT, Blumenthal D, Boren SA, Brown GD. Im-proving preventive care by prompting physicians.Arch Intern Med. 2000;160(3): 301–308
31. Bates DW, Teich JM, Lee J, et al. The impact of computerized physician order entry on medication error prevention. J Am Med Inform Assoc. 1999;6(4):313–321
32. Kawamoto K, Houlihan CA, Balas EA, Lobach DF. Improving clinical practice using clinical decision support systems: a systematic review of trials to identify features critical to success.BMJ. 2005;330 (7494):765
33. Durieux P, Trinquart L, Colombet I, et al. Computerized advice on drug dosage to improve prescribing practice. Cochrane Database Syst Rev. 2008;(3):CD002894
34. Amarasingham R, Pronovost PJ, Diener-West M, et al. Measuring clinical in-formation technology in the ICU setting: application in a quality improvement col-laborative.J Am Med Inform Assoc. 2007;14 (3):288–294
daily patient goal sheets. J Crit Care. 2008;23(2):227–235
36. Mathews SC, Pronovost PJ. The need for systems integration in health care.JAMA. 2011;305(9):934–935
37. Starmer J, Giuse D. A real-time ventilator management dashboard: toward hardwir-ing compliance with evidence-based
guidelines. AMIA Annu Symp Proc. 2008: 702–706
38. Zaydfudim V, Dossett LA, Starmer JM, et al. Implementation of a real-time compliance dashboard to help reduce SICU
ventilator-associated pneumonia with the ventilator bundle.Arch Surg. 2009;144(7):656–662
(Continued fromfirst page)
FINANCIAL DISCLOSURE:The authors have indicated they have nofinancial relationships relevant to this article to disclose.
FUNDING:Supported by the Lucile Packard Foundation for Children’s Health and the Child Health Research Institute Innovations in Patient Care Program, the Stanford NIH Clinical and Translational Science Award (Stanford CTSA award number UL1 RR025744 from NIH/NCRR), and an HP Sustainability and Social Innovation grant. Funded by the National Institutes of Health (NIH).
DOI: 10.1542/peds.2013-2249 originally published online February 24, 2014;
2014;133;e738
Pediatrics
Jaap Suermondt, Paul J. Sharek and Deborah Franzon
Natalie M. Pageler, Christopher A. Longhurst, Matthew Wood, David N. Cornfield,
Services
Updated Information &
http://pediatrics.aappublications.org/content/133/3/e738
including high resolution figures, can be found at:
References
http://pediatrics.aappublications.org/content/133/3/e738#BIBL
This article cites 30 articles, 8 of which you can access for free at:
Subspecialty Collections
rds_sub
http://www.aappublications.org/cgi/collection/electronic_health_reco Electronic Health Records
chnology_sub
http://www.aappublications.org/cgi/collection/health_information_te Health Information Technology
ine_sub
http://www.aappublications.org/cgi/collection/evidence-based_medic Evidence-Based Medicine
following collection(s):
This article, along with others on similar topics, appears in the
Permissions & Licensing
http://www.aappublications.org/site/misc/Permissions.xhtml
in its entirety can be found online at:
Information about reproducing this article in parts (figures, tables) or
Reprints
http://www.aappublications.org/site/misc/reprints.xhtml
DOI: 10.1542/peds.2013-2249 originally published online February 24, 2014;
2014;133;e738
Pediatrics
Jaap Suermondt, Paul J. Sharek and Deborah Franzon
Natalie M. Pageler, Christopher A. Longhurst, Matthew Wood, David N. Cornfield,
Dashboard to Decrease CLABSIs
Enhanced Checklist and Electronic
−
Use of Electronic Medical Record
http://pediatrics.aappublications.org/content/133/3/e738
located on the World Wide Web at:
The online version of this article, along with updated information and services, is
by the American Academy of Pediatrics. All rights reserved. Print ISSN: 1073-0397.