460 |
P a g e
CERTAIN PARAMETERS FOR DESIGNING A SOLAR CELL
Smita B Joshi
1, A R Jani
21
EC Department, G.H.Patel College of Engineering and Technology, Gujarat Technological University (India)
2
Department of Physics, Sardar Patel University (India)
ABSTRACT
The solar spectrum contains all wavelengths in the range starting from 25 0nm to 2500nm. The study of the
solar spectrum was done using spectral response meter. For different wavelengths, current and power were
measured. The graph of quantum efficiency vs. wavelength was plotted. The value of quantum efficiency
obtained was in the range of 40% to 99%. Overall reduction of Quantum efficiency (QE) is due to
recombination, transmission and low diffusion length.
Keywords
--
Band gap, diffusion length, quantum efficienc y, Solar Spectrum, Spectral
Response
I. INTRODUCTION
For designing and developing a solar cell from new materials, for improving its performance by improving its
efficiency, its key measurement is “spectral response” of a solar cell. Spectral response is basically sensitivity of
cell to light of different wavelengths. It can be defined as measure of short circuit current per unit light power
(A/W) [1, 2].
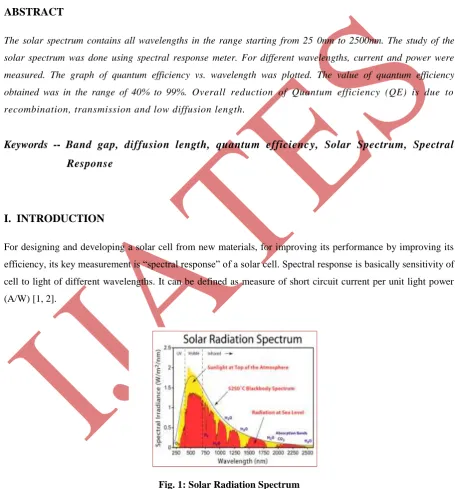
Fig. 1: Solar Radiation Spectrum
Solar radiation is the radiant energy emitted by the Sun. Fig 1 shows the solar radiation spectrum. The relevant
radiation for the applications in solar power industries lies within ultra violet (200 to 390 nm), visible range
(390 to 780 nm), near-infrared (780 to 4000 nm) and infrared (4000 to 100000 nm) [3].The electromagnetic
461 |
P a g e
visible and ultraviolet to X-rays and gamma rays. However, 99 percent of the energy of solar radiation is
contained in the wavelength band from 0.15 to 4µm, comprising the near ultraviolet, visible and near infrared
regions of the solar spectrum, with a maximum at about 0.5µm.
The variations actually observed in association with solar phenomena like sunspots, prominences and
solar flares are mainly confined to the extreme ultraviolet end of the solar spectrum and to the radio waves. The
contribution of these variations to the total energy emitted is extremely small and can be neglected.
Different methods were detected by Patker et.al [4] for florescence emission and excitation spectra and
correction curves were presented. Solar cells based on a new conjugated donor polymer with C60 and C70 PCBM
acceptors afford high quantum efficiencies over a broad spectral range into the near- infrared. The cells provide
power conversion efficiencies of up to 4% under simulated AM1.5 G solar light conditions [5]. Martiin et. al [5,
6] tested the spectral response for efficient methanol. Neufeld et.al [7] got external quantum efficiency as high
as 63% for III – nitride photovoltaic cells which were grown by metal- organic chemical vapor deposition on
(0001) sapphire.
In this research work authors have used the spectral response meter to measure the short circuit current
of the solar cell at selected wavelength over a broad range of wavelengths. For crystalline silicon cell, the
wavelength is 350nm to 1100nm.To carry out the results, the standard equipment uses a broadband or filters to
produce nearly monochromatic light and a device to record short circuit current gives spectral response of the
cell. The parameter which highly affects the efficiency of the solar cell are open circuit voltage and short circuit
current. High efficient solar cell can be used for utilization of solar energy even at night or in inadequate solar
radiation conditions. For this purpose, the power generated by solar cells can be stored in battery backup and
can be utilized for cooking, drying or for desalination of water. By using the sun tracker the efficiency can
further be increased [8-11].
II.
EXPERIMENTAL METHOD
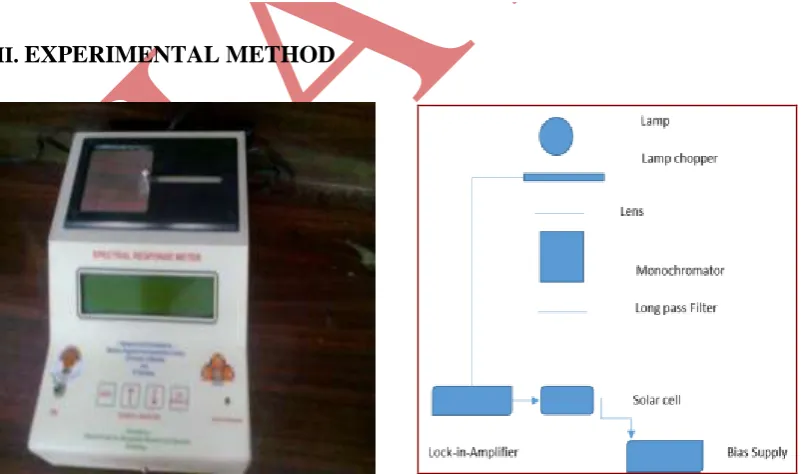
Fig. 2: Spectral Response Meter Fig. 3: Standard Arrangement of Spectral Response Meter
Figure 3 shows the standard arrangement for spectral response meter. At the top there is a broadband source
462 |
P a g e
wavelength. In meter, a synthetic light source made up of 20 LEDs covering wavelength range from 360nm to
1060nm is required for measuring the spectral response of crystalline Silicon solar cell.
III.
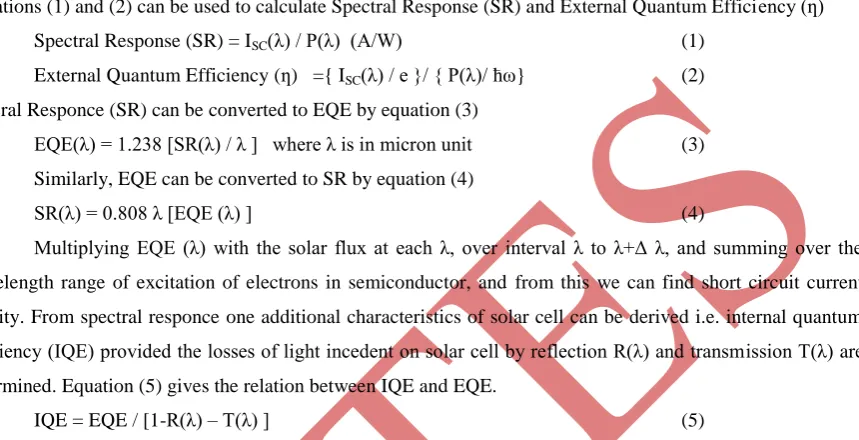
EQUATIONSEquations (1) and (2) can be used to calculate Spectral Response (SR) and External Quantum Efficiency (ƞ)
Spectral Response (SR) = ISC(λ) / P(λ) (A/W) (1)
External Quantum Efficiency (ƞ) ={ ISC(λ) / e }/ { P(λ)/ ћω} (2)
Specral Responce (SR) can be converted to EQE by equation (3)
EQE(λ) = 1.238 [SR(λ) / λ ] where λ is in micron unit (3)
Similarly, EQE can be converted to SR by equation (4)
SR(λ) = 0.808 λ [EQE (λ) ] (4)
Multiplying EQE (λ) with the solar flux at each λ, over interval λ to λ+Δ λ, and summing over the
wavelength range of excitation of electrons in semiconductor, and from this we can find short circuit current
density. From spectral responce one additional characteristics of solar cell can be derived i.e. internal quantum
efficiency (IQE) provided the losses of light incedent on solar cell by reflection R(λ) and transmission T(λ) are
determined. Equation (5) gives the relation between IQE and EQE.
IQE = EQE / [1-R(λ) – T(λ) ] (5)
The current is normalized with respect to light power versus wavelength spectral response of the cell.
In this spectral response meter, the combination of broad band light source and monochromator is replaced by
a synthetic source composed of light emitted diodes (LED) which covers the wavelength range from 360nm to
1060 nm. There are 20 LEDs mounted on the top of the spectral response meter on a holder which also
accommodates the solar cell. Each LED emits light over a wavelength range about 20- 30 nm .Emission peak
wavelengths of different LEDs are separated by about 40-60 nm. An LED of required wavelength can be
selected by pushbuttons and the wavelength can be varied by doing so. A 20 mA constant current source was
used to excite the light output from the selected LED. Power emitted by LED was measured by using a
calibrated reference cell. By exciting the corresponding diode, the photo current was measured. A 10 ohm
resistor was connected across the cell was used to develop voltage which was then amplified and digitalized by
using an analog to digital converter and stored.
VI. RESULTS AND DISCUSSIONS
TABLE 1: Equipments required for performance of experiment
Sr.No
Unit
Description
1
Solar cell
4 x 4 cm
2C- Si cell
2
Light source(20 LEDs)
360 nm to 1060 nm
3
constant current source
20 mA current flow through selected
LED
4
Measurement of power emitted from each LED
Power emitted by each LED at 20 mA
5
Controller for selecting LED and recording
short circuit current
463 |
P a g e
Table 1 shows the equipment required for performing the experiment for studying the spectral
response of a solar cell along with their description. One standard crystalline solar cell was
illuminated by Light emitting diodes which emitted power at 20 mA. Controller for selecting LED
was used which also record short circuit current generated by solar cell.
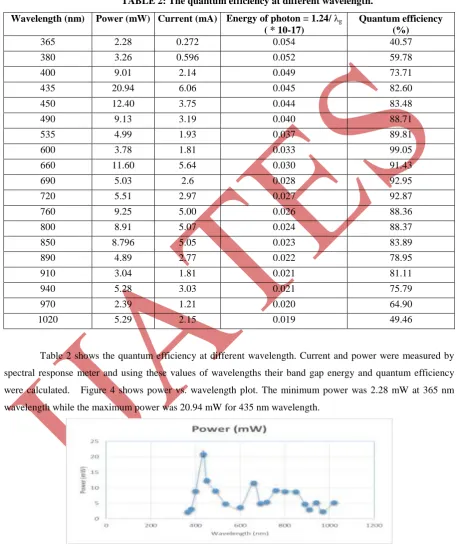
TABLE 2: The quantum efficiency at different wavelength. Wavelength (nm) Power (mW) Current (mA) Energy of photon = 1.24/ λg
( * 10-17)
Quantum efficiency (%)
365 2.28 0.272 0.054 40.57
380 3.26 0.596 0.052 59.78
400 9.01 2.14 0.049 73.71
435 20.94 6.06 0.045 82.60
450 12.40 3.75 0.044 83.48
490 9.13 3.19 0.040 88.71
535 4.99 1.93 0.037 89.81
600 3.78 1.81 0.033 99.05
660 11.60 5.64 0.030 91.43
690 5.03 2.6 0.028 92.95
720 5.51 2.97 0.027 92.87
760 9.25 5.00 0.026 88.36
800 8.91 5.07 0.024 88.37
850 8.796 5.05 0.023 83.89
890 4.89 2.77 0.022 78.95
910 3.04 1.81 0.021 81.11
940 5.28 3.03 0.021 75.79
970 2.39 1.21 0.020 64.90
1020 5.29 2.15 0.019 49.46
Table 2 shows the quantum efficiency at different wavelength. Current and power were measured by
spectral response meter and using these values of wavelengths their band gap energy and quantum efficiency
were calculated. Figure 4 shows power vs. wavelength plot. The minimum power was 2.28 mW at 365 nm
wavelength while the maximum power was 20.94 mW for 435 nm wavelength.
464 |
P a g e
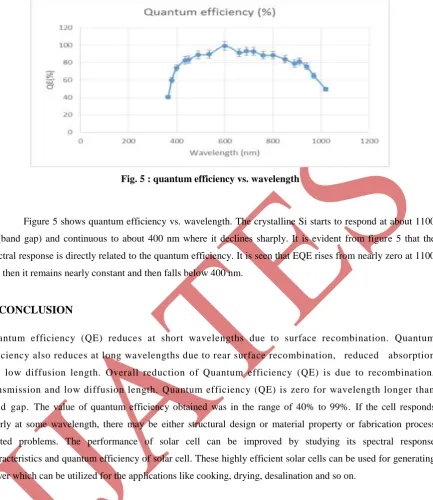
Fig. 5 : quantum efficiency vs. wavelengthFigure 5 shows quantum efficiency vs. wavelength. The crystalline Si starts to respond at about 1100
nm(band gap) and continuous to about 400 nm where it declines sharply. It is evident from figure 5 that the
spectral response is directly related to the quantum efficiency. It is seen that EQE rises from nearly zero at 1100
nm, then it remains nearly constant and then falls below 400 nm.
V. CONCLUSION
Quantum efficiency (QE) reduces at short wavelengths due to surface recombination. Quantum
efficiency also reduces at long wavelengths due to rear surface recombination, reduced absorption
and low diffusion length. Overall reduction of Quantum efficiency (QE) is due to recombination,
transmission and low diffusion length. Quantum efficiency (QE) is zero for wavelength longer than
band gap. The value of quantum efficiency obtained was in the range of 40% to 99%. If the cell responds
poorly at some wavelength, there may be either structural design or material property or fabrication process
related problems. The performance of solar cell can be improved by studying its spectral response
characteristics and quantum efficiency of solar cell. These highly efficient solar cells can be used for generating
power which can be utilized for the applications like cooking, drying, desalination and so on.
ACKNOWLEDGEMENTS
The authors wish to thank National Center for photovoltaic Research and Education
(NCPRE) established at IIT Bombay by Ministry of New and Renew able Energy (MNRE) for
providing a Solar Photo voltaic kit to the college.
REFERENCES
[1] C S Solanki, Solar Photovoltaic Technologies, Cambridge University, Press India Private
Ltd., 2013
465 |
P a g e
[3] Ishan Purohit and Indira Karakoti, “The status of solar radiation in India” Solar Quarterly, 4 (2012) 10
[4] Parker et.al “Correction of fluorescence spectra and measurement of fluorescence quantum efficiency”,
Analyst, 1960, 85, 587-600,DOI: 10.1039/AN9608500587
[5] Martijin et.al.“Narrow-Band gap Diketo-Pyrrolo-Pyrrole Polymer Solar Cells: The Effect of
Processing on the Performance” Article first published online: 26 MAY 2008,
DOI: 10.1002/adma.200800456
[6] Martiin M. et al. “Efficient Methano[70] fullerene/MDMO-PPV Bulk Heterojunction
Photovoltaic Cells” Article first published online: 24 JUL 2003
DOI: 10.1002/ange.200351647
[7] Neufeld, Carl J. et.al.“High quantum efficiency InGaN/GaN solar cells with 2.95 eV band gap”,
Japanese Journal of Applied Physics, 52, 2013, 08JH05.
[8] Smita B. Joshi and A.R.Jani, "Photovoltaic and Thermal Hybridized Solar Cooker" ISRN
Renewable Energy Hindawi Publishing Corporation, Volume
-2013,Doi.org/10.1155/2013/746189
[9] Smita B.Joshi and A.R.Jani, “Certain Analysis of A Solar Cooker With Dual Axis Sun
Tracker”, “Certain Analysis of A Solar Cooker With Dual Axis Sun
Tracker”10.1109/NUiCONE.2013.6780150,ISBN 978-1-4799-0726-7, Publisher: IEEE
[10]Smita B. Joshi and A.R.Jani, “Development of Heat Storage System For Solar Cooker”,
Volume III, Issue IV, April 2014, ISSN 2278-2540, International Journal of Latest technology in
Engineering, Management & Applied Science. WWW.ijltemas.in
[11]Smita B. Joshi, Hemant R. Thakkar and A.R.Jani, “A Novel Design Approach of Small Scale
Conical Solar Dryer”, Volume III, Issue IV, April, 2014, ISSN 2278-2540, International Journal
of Latest technology in Engineering, Management & Applied Science.WWW.ijltemas.in