CHARACTERIZATION OF FUEL SPRAYS IN
SPARK IGNITION ENGINES
Volume 1
b y
Paul Andrew Williams
1994
S u b m i tt e d f o r the D egree o f D o c to r o f P h ilo so p h y
ProQuest Number: 10106832
All rights reserved
INFORMATION TO ALL USERS
The quality of this reproduction is dependent upon the quality of the copy submitted.
In the unlikely event that the author did not send a complete manuscript and there are missing pages, these will be noted. Also, if material had to be removed,
a note will indicate the deletion.
uest.
ProQuest 10106832
Published by ProQuest LLC(2016). Copyright of the Dissertation is held by the Author.
All rights reserved.
This work is protected against unauthorized copying under Title 17, United States Code. Microform Edition © ProQuest LLC.
ProQuest LLC
789 East Eisenhower Parkway P.O. Box 1346
A B S T R A C T
This thesis describes techniques to quantify spark ignition engine fuel spray quality, a study
of tile effect of fuel properties and other influences upon spray formation, and engine testing to
assess the effect of fuel droplet sizes upon combustion.
The literature survey reveals little published w ork on the effect of fuel properties on the
sprays, and identifies the need for suitable param eters to describe the spray. Equivalent
diam eters' are defined as an alternative to Sauter m ean diam eter.
Use of the diffraction particle sizer identified a problem caused by the evaporation of the
volatile fuels. A solution is discussed.
A param etric test was carried out, investigating the effect of variation of the liquid surface
tension, viscosity and density on the droplet sizes produced by an injector. Injection pressure,
air velocity, m anifold pressure and injector type w ere also considered.
A pencil-jet' phenom enon is described, w here, at low values of Reynolds and O hnesorge
num bers, the injector produces a disintegrating colum n of fuel instead of a conical spray. Risk
of occurrence increased at low air densities. A hy p o th esis is presen ted to explain the
phenom enon. Pencil-jet formation occurred at low m anifold pressure w hen using a gasoline,
b u t n ot w hen using n-heptane. It is suggested th at alterations to a gasoline could prevent
pencil-jet form ation.
A correlation betw een m easured droplet sizes and a set of non-dim ensional equations was
perform ed, allow ing prediction of mean droplet sizes from know ledge of the fuel properties
and m anifold conditions. The m ost influential liquid pro p erty w as viscosity, followed by
surface tension, although the changes likely to be achieved are m odest. D roplet sizes w ere
alm ost insensitive to liquid density.
Engine testing revealed no clear relationship betw een d ro p let size and emissions. Trends
w ere noted but large changes in droplet sizes w ere required to produce a significant effect.
C O N T E N T S
V O L U M E 1.
page
A bstract 2
Contents 3
List of tables 19
List of figures 21
Acknowledgements 29
Introduction 30
CHAPTER 1. FUEL MIXTURE PREPARATION FOR SPARK IGNITION ENGINES
- A LITERATURE SURVEY
1.1 INTRODUCTION 32
1.1.1 The spark ignition engine - a brief history 32
1.1.2 The requirem ent for mixture preparation in an si engine 33
1.1.3 The combustion process 34
1.1.4 Relation of APR to power, economy and emissions 34
1.2 EMISSION CONTROL STRATEGIES 36
1.2.1 Exhaust gas recirculation (EGR) 36
1.2.2 R etarded ignition tim ing 36
1.2.3 Exhaust gas aftertreatm ent 36
1.3 EXHAUST GAS ANALYSIS 37
1.3.1 M easuring equipm ent 37
1.3.2 Precautions w hen taking measurements 38
1.3.3 Experim ental sam pling techniques 38
1.3.4 Vehicle em ission tests 38
1.4 CYCLIC VARIATIONS IN COMBUSTION,
PARTIAL BURNING AND MISFIRE 39
1.5 MEASUREMENT OF CYLINDER PRESSURE
AN D SUBSEQUENT ANALYSES 40
1.5.1 C ylinder pressure analyses 40
1.5.3 Transducer mounting 42
1.5.4 Signal processing and phasing 43
1.5.5 The use of log-pressure versus log-volume plots 45
1.5.6 Q uantity of data required for representative m easurem ent 45
1.6 A BRIEF OVERVIEW OF PRACTICAL FUEL
PREPARATION DEVICES 47
1.6.1 Carburettors 47
1.6.2 Fuel injection 47
1.6.3 The replacem ent of carburettors by injection systems 48
1.7 EFFECT OF MIXTURE QUALITY ON SI ENGINE
PERFORMANCE - A REVIEW OF THE LITERATURE
AND LEVEL OF CURRENT KNOWLEDGE 49
1.7.1 Vaporised m ixtures 49
1.7.2 Reduction of wall film w ithout vaporisation 52
1.7.3 The use of com puter models to predict desirable droplet sizes 54
1.7.4 Deficiencies of m ultipoint injection 55
1.7.5 M ethods of reducing fuel droplet sizes produced
by m ultipoint injectors 56
1.7.6 Swirl and air motion effects 57
1.7.7 Lean and fast bum engines 58
1.7.8 Tolerance to EGR 58
1.7.9 Injector position and injection timing 58
1.7.10 Inlet valve and port throttling 60
1.7.11 O ptim ization of m anifolding for high volum etric efficiency 62
1.7.12 Four valves per cylinder - a special case 63
1.7.13 Conclusions and closing comments on mixture preparation 65
1.8 THE THEORY OF ATOMIZATION AND SPRAYS 66
1.8.1 Basic principles 66
1.8.2 Break-up of liquid jets 66
1.8.3 Break-up of liquid sheets 69
1.8.4 Break-up of droplets 69
1.8.5 Sum m ary of the effects of liquid properties on atom ization 71
1.8.6 Practical im plications of theories 72
1.9 THE CHARACTERIZATION OF DROP SIZE DISTRIBUTIONS 73
1.9.1 G raphical representation 73
1.9.3 M ean droplet diam eter 75
1.9.4 Problems w ith Sauter mean diam eter 75
1.9.5 Representative diam eters and span 77
1.10 MEASUREMENT OF DROPLETS 77
1.10.1 Requirem ents of the ideal drop sizing system 77
1.10.2 Spatial and tem poral sam pling 78
1.10.3 Optical drop sizing techniques 79
1.10.4 M alvern series 2600c droplet and particle sizer 80
1.10.5 Optical access for photography 81
1.11 THE PRINCIPLE REQUIREMENTS OF A MOTOR GASOLINE 81
1.12 THE EFFECTS OF VARYING FUEL PROPERTIES O N THE SPRAYS
PRODUCED BY ENGINE FUEL SYSTEMS 82
1.13 RESEARCH PROGRAMME 83
1.14 REFERENCES 84
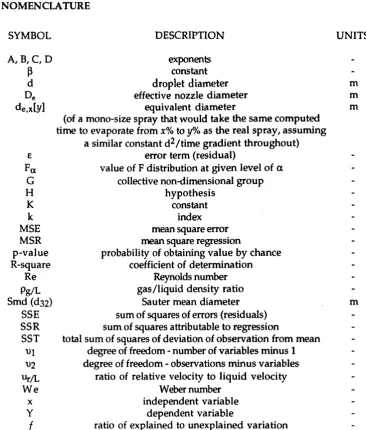
1.15 NOMENCLATURE 89
1.16 TABLES 91
1.17 FIGURES 91
CHAPTER 2. AN ALTERNATIVE TO SAUTER MEAN DIAMETER (SMD) FOR
CHARACTERIZING FUEL SPRAYS IN THE MANIFOLD OF A
SPARK IGNITION (SI) ENGINE
2.1 INTRODUCTION 98
2.2 SAUTER MEAN DIAMETER AND THE NEED FOR ITS REPLACEMENT 98
2.2.1 Illustration of the problem 99
2.2.2 The use of different instruments and m easurem ent ranges 99
2.2.3 The requirem ent for an alternative 100
2.3 EVAPORATION MODELLING 100
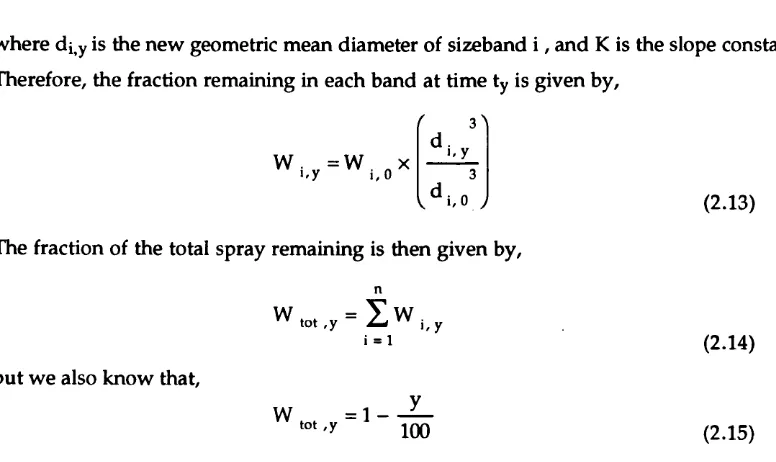
2.3.1 A 'sim ple' evaporation model 100
2.4 EQUIVALENT DIAMETER BASED ON THE D^ LAW MODEL 103
2.4.1 Evaporation according to the d-squared law 104
2.4.2 Equivalent diam eter de,x[y] 105
2.4.3 U sing de,o[y] to characterize real sprays 106
2.4.4 de,o[y] versus Smd 106
2.4.5 Combustion modelling using de,x[y] 107
2.4.6 Com m ents regarding equivalent diam eter 107
2.5 IMPLEMENTATION OF THE EQUIVALENT DIAMETER APPROACH
TO CHARACTERIZING SI ENGINE FUEL SPRAYS 107
2.5.1 O perating principles 108
2.5.2 Value of tim estep DT 108
2.5.3 Saving discrete values of de,o[y] 109
2.5.4 Smallest surviving drop size band 110
2.5.5 Limitations of the program 110
2.5.6 Tolerance 110
2.5.7 Fine tuning' 111
2.5.8 Program validation 111
2.6 CO NCLUSIO NS 112
2.7 REFERENCES 112
2.8 NOMENCLATURE 113
2.9 TABLES 115
2.10 FIGURES 119
CHAPTER 3. MEASUREMENT OF VOLATILE FUEL SPRAYS USING LASER
DIFFRACTION PARTICLE SIZING
- THE EVAPORATION PROBLEM AND ITS SOLUTION
3.1 EVAPORATION - THE PROBLEM 130
3.2 THE THEORY BEHIND THE MALVERN 2600C PARTICLE SIZER 130
3.2.1 D iffraction theory 131
3.2.2 A pplication of diffraction theory in tiie M alvern sizer 133
3.3 DESIGN FEATURES OF THE MALVERN SIZER 134
3.3.1 Detector, range, alignment and background 134
3.3.3 Lower limits of resolution, Fraunhofer diffraction 135
3.3.4 Limitation of resolution, calculation and presentation 135
3.3.5 K illdata option 136
3.3.6 D roplet sphericity 136
3.3.7 M easurem ent practicalities 136
3.4 THE EVAPORATION PROBLEM IN PRACTICE 137
3.4.1 A typical case from an early m easurem ent 137
3.4.2 Varying the am bient tem perature 138
3.5 THE EFFECT OF EVAPORATION O N THE ANALYSER 139
3.5.1 Beam steering 140
3.5.2 The requirem ent to increase the upper lim it of the M alvern's range 141
3.5.3 Clarification of the problem 141
3.6 DATA CONDITIONING TO REMOVE THE EFFECTS OF EVAPORATION 142
3.6.1 Previous attem pts at solving the problem 142
3.6.2 The linear best estimate' 142
3.7 DATA CONDITIONING PROGRAM
USING A LINEAR FIRST ESTIMATE 143
3.7.1 Introduction 143
3.7.2 Basic operating principles 144
3.7.3 U pper and lower cases 144
3.7.4 Data conditioning in practice 145
3.7.5 L im itations 145
3.7.6 Guidelines for program use 146
3.8 USE OF THE LINEAR BEST ESTIMATE - A REAL EXAMPLE 146
3.9 CORRELATION 147
3.10 CONCLUSION 148
3.11 REFERENCES 149
3.12 NOMENCLATURE 149
3.13 TABLES 150
CHAPTER 4. DESIGN AND ARRANGEMENT OF TEST APPARATUS
4.1 FUEL SYSTEMS TEST FACILITY 177
4.2 RIG DESIGN 177
4.2.1 Design philosophy 177
4.2.2 Test passage 178
4.2.3 M ounting arrangements 179
4.2.4 Injector m ounting arrangements 179
4.2.5 M anifold arrangem ents 180
4.3 FUEL SUPPLY SYSTEM 180
4.4 PHOTOGRAPHIC SYSTEM 181
4.5 INJECTOR AND MEASURING SYSTEM TRIGGER ARRANGEMENTS 181
4.6 MALVERN LENS EXTENSION 182
4.7 INJECTOR TEST BOOTH 182
4.8 REFERENCES 183
4.9 FIGURES 184
CHAPTER 5. TEST RIG CALIBRATION
5.1 INJECTION PULSEWIDTH 194
5.2 MALVERN AND PHOTOGRAPHIC MEASUREMENT DELAY TIME 194
5.3 FUEL LINE PRESSURE 195
5.4 AIR FLOW MEASUREMENT 195
5.4.1 Calibration of hot-w ire air-mass flow m eter 195
5.4.2 M easurem ent using pitot tube array 196
5.4.3 Velocity m agnitude from pitot tube m easurem ents 197
5.4.4 Analysis of the velocity distribution 198
5.4.5 Air velocity in the region of the spray 198
5.4.7 M anifold air density at w ide open throttle (WOT) 199
5.5 REFERENCES 200
5.6 NOMENCLATURE 200
5.7 TABLES 201
5.8 FIGURES 204
CHAPTER 6. FUEL SELECTION, TEST PROCEDURES AND CONDITIONS
6.1 TEST FUEL SELECTION 210
6.1.1 Prim ary hydrocarbons 210
6.1.2 Selected blends 210
6.1.3 M easurem ent of fuel properties 211
6.1.4 Relevance of test tem peratures 212
6.2 FUEL SUPPLY SYSTEM AND BLEND PREPARATION
FOR MALVERN AND PHOTOGRAPHIC TESTS 212
6.3 ARRANGEMENTS FOR MALVERN DROPLET SIZING 213
6.3.1 G eneral preparation 213
6.3.2 Lens selection 213
6.4 SELECTION OF MALVERN TEST CONDITIONS 213
6.4.1 Injection pulsew idth 213
6.4.2 Frequency of injection 214
6.4.3 Injection pressure 215
6.4.4 Air flow (velocity) 215
6.4.5 M anifold depression 216
6.5 NUMBER OF SWEEPS FOR MALVERN MEASUREMENTS 216
6.6 FUEL SUPPLY SYSTEM; AIR-FED VERSUS PUMP-FED 217
6.7 MANIPULATION OF MALVERN DATA 218
6.8 PHOTOGRAPHIC WORK 219
6.8.1 General preparation 219
6.8.2 Selection of test conditions 219
6.9 EXPERIMENTAL ARRANGEMENTS FOR FUEL
FLOW MEASUREMENTS 220
6.10 REFERENCES 221
6.11 NOMENCLATURE 221
6.12 TABLES 222
6.13 FIGURES 228
APPENDIX A. Documentation for program DL-V5-1 234
APPENDIX B. Documentation for program EVP-V5-2 246
APPENDIX C DESIGN DRAWINGS 257
APPENDIX C l. Viewing passage 258
APPENDIX C2. Pitot tube array and injector supply rail 287
APPENDIX C3. Fuel cylinders and air supply arrangem ents 290
APPENDIX C4. Lens extension tube assembly 297
C O N T E N T S
V O L U M E 2.
page
A bstract 313
Contents 314
List of tables 330
List of figures 332
Acknowledgements 340
Introduction 341
CHAPTER 7. DETERMINATION OF FUEL VELOCITY AT INJECTOR NOZZLE EXIT
7.1 FUEL FLOW MEASUREMENTS 343
7.1.1 Raw test results 343
7.1.2 C onfirm atory testing 344
7.1.3 Calculation of m ean fuel flow per pulse 344
7.2 CALCULATION OF THE COEFFICIENT OF DISCHARGE 344
7.2.1 Theoretical d erivation 344
7.2.2 Effective(annular) area 345
7.2.3 C alculated values of discharge coefficient 346
7.3 CALCULATION OF MEAN VELOCITY 346
7.4 FUEL VELOCITY PREDICTION 347
7.4.1 Theoretical deriv atio n 347
7.5 CORRELATION BETWEEN REYNOLDS NUMBER AND
COEFFICIENT OF DISCHARGE 347
7.5.1 Effective (or hydraulic) diam eter 348
7.5.2 C orrelation 348
7.6 PREDICTION OF VELOCITY BASED O N LIQUID PROPERTIES
AND EFFECTIVE NOZZLE DIAMETER ALONE 348
7.7 PREDICTION OF MASS FLOW RATE AND REYNOLDS NUMBER 350
7.7.2 Liquid Reynolds number 351
7.8 REFERENCES 351
7.9 NOMENCLATURE 352
7.10 TABLES 353
7.11 FIGURES 356
CHAPTER 8. DISCUSSION OF DROP-SIZE DISTRIBUTION
AND PHOTOGRAPHIC RESULTS
8.1 GENERAL QUALITY OF MALVERN SIZER DATA AN D RESULTS 359
8.1.1 W indow w etting 359
8.1.2 Obscuration 359
8.1.3 Sam ple size 361
8.1.4 Goodness of fit 362
8.2 THE EFFECT OF LIQUID PROPERTIES O N SPRAY FORMATION 362
8.2.1 Type of spray formation 363
8.2.2 Selection of M alvern drop-size results for further analysis 364
8.2.3 Pencil-jet versus conical spray formation 364
8.2.4 Identification of the break-up regime - com parison w ith theory 365
8.3 THE MECHANISM OF CHANGE-OVER
FROM CONICAL SPRAY TO PENCIL-JET 368
8.3.1 Lam inar and turbulent flow 368
8.3.2 'Velocity profile relaxation' 369
8.3.3 Consideration of the injector tip geometry and fluid flow. 370
8.3.4 Pintle tip shape 371
8.4 THE EFFECT OF REDUCED AIR DENSITY 371
8.4.1 M alvern drop-size measurements 371
8.4.2 Spray form ation problems 372
8.4.3 Explanation of observed phenomenon 373
8.4.4 Repeatability and the performance of other blends 373
8.4.5 Im plications of the shift in change-over point 374
8.5 THE EFFECT OF CHANGES IN FUEL TEMPERATURE 375
8.6.1 M alvern drop-size measurements 375
8.6.2 M easurem ents of estimated core diam eter 376
8.6.3 Photographic results 377
8.7 THE EFFECT OF CHANGES IN AIR VELOCITY 377
8.7.1 Test conditions 378
8.7.2 C alculation of relative air-fuel velocity 378
8.7.3 M easured droplet diam eters 378
8.7.4 Interpretation of results 378
8.8 A COMPARISON OF DIFFERENT INJECTOR TYPES 379
8.8.1 A lternative injector types and characteristics 379
8.8.2 Prediction of break-up regime 380
8.8.3 Photographic and M alvern drop-size m easurem ents 380
8.8.4 A dvantages and disadvantages of the various injector types 381
8.9 REFERENCES 382
8.10 NOMENCLATURE 383
8.11 TABLES 384
8.12 FIGURES 395
CHAPTER 9. EQUATIONS FOR DROP-SIZE PREDICTION
9.1 PRELIMINARY CONSIDERATIONS 421
9.2 DIMENSIONAL ANALYSIS 421
9.2.1 C ontrolling variables 421
9.2.2 M athem atical treatm en t 422
9.2.3 Suitability of equation 423
9.3 THE EQUATION OF LEFEBVRE 424
9.3.1 Arrangem ent of equation 424
9.3.2 Developm ent of equation 425
9.3.3 Suitability of equation 425
9.4 AN EQUATION FOR PORT-INJECTED PINTLE INJECTOR SPRAYS 426
9.4.1 Viscosity and density ratios 426
9.4.2 D efining relative velocity 427
9.4.4 The equation part II: Droplet formation 429
9.4.5 The equation part I and II combined 430
9.4.6 Lim itations of equation 431
9.5 REFERENCES 432
9.6 NOMENCLATURE 433
9.7 FIGURES 434
CHAPTER 10. FUEL DROP SIZE PREDICTION - EXPERIMENTAL CORRELATION
10.1 THE REQUIREMENT 436
10.2 EXPERIMENTAL RESULT SELECTION AND DATA TABULATION 436
10.2.1 Selection of results 436
10.2.2 Tabulation of data 437
10.3 COMPUTER BASED STATISTICAL DATA ANALYSIS 437
10.3.1 S ta tis tica /M a c 438
10.3.2 M ultiple linear regression 438
10.3.3 Testing for statistical significance - ANalysis Of VAriance (ANOVA) 438
10.4 CORRELATION PROCEDURE 439
10.4.1 Construction of Statistica regression equation 440
10.4.2 Iteration procedure 440
10.4.3 A dditional comm ents regarding correlation 441
10.5 CRITICAL REVIEW OF DATA TO BE USED IN CORRELATION 441
10.5.1 16 ms results 441
10.5.2 n-heptane results 442
10.5.3 Isohexane results 442
10.5.4 Gasoline results 442
10.5.5 Blends 2 and 21 443
10.6 REGRESSION RESULTS 443
10.6.1 The correlation values 443
10.6.2 Interpretation of tabular results 444
10.6.3 Q uality of regression - de,o[10] 444
10.6.4 Q uality of regression - de o[50] 444
10.6.6 Quality of regression - de,o[90] 445
10.6.7 R- square values 445
10.7 CHECKS FOR VALIDITY 446
10.7.1 Residual versus deleted residual 446
10.7.2 N orm al probability plot of residuals 446
10.7.3 N orm al probability plots of variables 446
10.8 REGRESSION - OVERALL CONCLUSION 447
10.9 CRITICAL EXAMINATION OF SUBSETS
OF THE MAIN CORRELATION 447
10.9.1 Fuel properties - dynamic viscosity 447
10.9.2 Fuel properties - surface tension and density 448
10.9.3 Air density 448
10.9.4 Relative air-fuel velocity 449
10.10 REFERENCES 449
10.11 NOMENCLATURE 449
10.12 TABLES 451
10.13 FIGURES 456
CHAPTER 11. FUEL SPRAY FORMATION AND DROP SIZE PREDICTION
- VARIATIONS POSSIBLE WITH A CURRENT GASOLINE
11.1 ADJUSTMENT OF A TYPICAL GASOLINE TO AVOID PENCIL-JET
FORMATION AT LOW AIR DENSITY 468
11.1.1 The requirem ents for change 468
11.1.2 Increase in Ohnesorge number by reduction in surface tension 469
11.1.3 Increase in Reynolds num ber with no change in liquid m ass flow rate 469
11.1.4 Increase in Reynolds num ber with a change in liquid m ass flow rate 471
11.1.5 Change in fuel properties: Implications for carburettors 471
11.2 FUEL DROP-SIZES FOR A TYPICAL GASOLINE
AND THEIR REDUCTION 472
11.2.1 The equations for drop-size prediction 472
11.2.2 Im plem entation of fuel drop-size prediction equations 473
11.2.3 Limitations of prediction 474
11.2.5 Variation of fuel density 475
11.2.6 Variation of fuel surface tension 475
11.2.7 Variation of fuel dynamic viscosity 475
11.2.8 V ariation in all three liquid properties 475
11.2.9 Variation of fuel pressure 476
11.2.10 Variation of air density 476
11.2.12 Variation of air velocity 477
11.3 CONCLUSIONS 477
11.4 REFERENCES 477
11.5 NOMENCLATURE 478
11.6 TABLES 479
11.7 FIGURES 482
CHAPTER 12. THE MEASURED EFFECTS OF FUEL DROP SIZE ON
THE PERFORMANCE OF A SPARK IGNITION ENGINE
12.1 GENERATION OF A VARIABLE DROP-SIZE SPRAY 486
12.1.1 Design and m odification of the Lucas air-assisted atom izer 486
12.1.2 Calibration of the Lucas air-assisted atom izer 487
12.1.3 M easured drop-sizes 487
12.1.4 Additional comments 488
12.2 EXPERIMENTAL ARRANGEMENTS 488
12.2.1 Details of H ydra research engine 488
12.2.2 M easurem ent of a ir/fu e l ratio and exhaust gas analysis 488
12.2.3 M easurement of fuel consumption 489
12.2.4 M easurem ent of cylionder pressure and calculation of heat release 489
12.2.5 Selection of test conditions 490
12.2.6 Test procedures 490
12.3 ENGINE TEST RESULTS 491
12.3.1 Coefficient of Variance in IMEP (CoV-IMEP) 491
12.3.2 Cum ulative heat release b um duration 492
12.3.3 Brake specific fuel consum ption (BSFC) 492
12.3.4 Carbon monoxide (CO) 492
12.3.5 Total hydrocarbons (THC) 493
12.3.6 Oxides of nitrogen (NOx) 493
12.4 DISCUSSION OF ENGINE TEST RESULTS 493
12.4.1 Stoichiometric results (X=l), closed valve injection 494
12.4.2 Stoichiometric results (X=l), pencil-jet, closed versus open valve injection 496
12.4.3 Stoichiometric results (X=l), open valve injection 496
12.4.4 X=1.2, closed valve injection 497
12.4.5 X=1.2, pencil-jet, closed versus open valve injection 498
12.4.6 X=1.2, open valve injection 498
12.5 CONCLUDING DISCUSSION 499
12.5.1 General trends 500
12.5.2 N ote of caution regarding engine configuration 500
12.5.3 C om parison w ith related w ork 501
12.5.4 Final comments 501
12.6 REFERENCES 502
12.7 TABLES 503
12.8 FIGURES 510
CHAPTER 13. OVERALL RESULTS & CONCLUSIONS
13.1 Prelim inary work 544
13.1.1 The literature survey 544
13.1.2 E quivalent diam eters 545
13.1.3 Data conditioning 545
13.1.4 Rig design and developm ent 546
13.1.5 Fuel selection 546
13.2 RIG TEST RESULTS 546
13.2.1 Fuel velocity at injector nozzle exit 546
13.2.2 Q uality of M alvern results 547
13.2.3 The pencil-jet phenom enon 547
13.2.4 Com parison of injector types 548
13.2.5 Drop size measurements - equations and correlation 549
13.2.6 Drop size prediction - parametric study 550
13.2.7 A voidance of pencil-jet formation 550
13.3 ENGINE TESTING 551
13.3.2 Discussion of results 551
13.4 ORIGINAL CONTRIBUTIONS 552
13.5 REFERENCES 553
APPENDIX D. Tabulated results from M alvem m easurem ents - blends 1 to 45 555
APPENDIX E. Sample M alvem data and result print-outs - blends 1 to 45 574
LIST O F TABLES
1.1 European Emission Standard ECE 15.05. (Council decision 8 /6 /8 9 ) 91
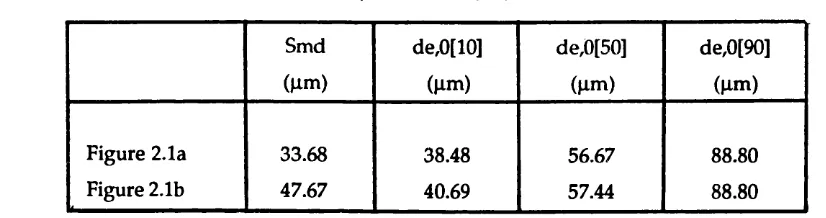
2.1 Com puted values of Smd and de o[y]
for the sprays in figures 2.1a and 2.1b 115
2.2 Constants used in dg oLy] calculation program s 115
2.3 Program validation - spreadsheet calculation of dg o[10] 116
2.4 Program validation - spreadsheet calculation of dg o[50] 117
2.5 Program validation - spreadsheet calculation of dg o[90] 118
3.1 V ariation of detector radius w ith dro p size for ttiree focal lengths 150
(based on the location of the first m axim um of the energy distribution)
3.2 Relationship betw een drop diam eter and diffraction angle 151
(based on the location of the first m axim um of the energy distribution)
3.3 The effect of tem perature variations
on the calculated drop size distribution 151
3.4 The effect of tem perature variations
on the calculated drop size distribution 152
5.1 C alibration for Bosch m anual control unit 201
5.2 V ariation of required fuel pressure w ith m anifold depression 201
5.3 H ot-w ire air m eter calibration - bulk m ean velocity 202
5.4 M a lv e m /Z e ta rig air velocity distribution 203
6.1 Basic hydrocarbon components used in range of blends 222
6.2 H ydrocarbon blends and their m easured properties 223
6.3 Properties of hydrocarbon blends at 16.5'C. 224
6.4 Air-fed versus pum p-fed fuel supply for isohexane 225
6.5 Air-fed versus pum p-fed fuel supply for unleaded gasoline 226
6.6 Analysis of residual differences,
pump-fed minus air-fed for isohexane 227
6.7 Analysis of residual differences,
pump-fed minus air-fed for unleaded gasoline 227
7.1 Flow test results - hydrocarbon blends 353
7.2 C onfirm atory flow test 353
7.3 Correlation between Reynolds num ber
and coefficient of discharge (Cd) at nozzle exit 354
7.4 Correlation betw een calculated velocity
8.1 Droplet num ber distribution and sample size 384
8.2 Blends selected for further drop size analysis 385
8.3 Mean Reynolds num ber and Ohnesorge num ber at nozzle exit 386
8.4 Effect of air density on droplet size for n-heptane 387
8.5 Effect of fuel pressure on m easured droplet diam eters for n-heptane 388
8.6 Estimated spray core diam eter versus fuel pressure 388
8.7 Effect of relative velocity on droplet diam eter for n-heptane 389
8.8 Effect of relative velocity on droplet diam eter for isohexane 390
8.9 Effect of relative velocity on droplet diam eter for unleaded gasoline 391
8.10 Injector m etering orifice data 392
8.11 Effect of injector type (n-heptane sprays) 393
8.12 Effect of injector type (isooctane sprays) 394
10.1 Tabulated data for drop-size correlation 451
10.1 Tabulated data for drop-size correlation (cont) 452
10.1 Tabulated data for drop-size correlation (cont) 453
10.1 Tabulated data for drop-size correlation (cont) 453
10.2 Regression results - de o[10] 454
10.3 Regression results - de,o[50] 454
10.4 Regression results - Smd 455
10.5 Regression results - de,o[90] 455
11.1 Gasoline drop-size prediction - de,o[10] 479
11.2 Gasoline drop-size prediction - de,o[50] 480
11.3 Gasoline drop-size prediction - Smd 481
12.1 Calibration for m odified Lucas air-assisted atom izer
- Mean droplet sizes 503
12.2 D eterm ination of spark advance for tests 504
12.3 Air and fuel pressure settings for tests 505
12.4 Engine test results - cylinder pressure and emissions
for closed valve injection timing 506
12.5 Engine test results - cylinder pressure and emissions
for open valve injection timing 507
12.6 Engine test results - cum ulative heat release
for closed valve iryection timing 508
12.7 Engine test results - cum ulative heat release
L IS T O F H G U R E S
1.1 The effect of a ir/fu e l ratio on pow er and economy
-BMEP and BSFC versus relative a ir/fu e l ratio. Lam bda (X) 91
1.2 The effect of a ir/fu e l ratio on exhaust emissions
-CO, CÜ2, HC and NOx versus relative a ir/fu e l ratio. Lam bda (X) 92
1.3 Bosch solenoid-type gasoline injector (cf [30] ) 92
1.4 Bosch LH-Jetronic gasoline injection system {cf [12] ) 93
1.5 Transport and evaporation of fuel (m ultipoint injection system) 93
1.6 Comparison between sprays produced by injector and carburettor 94
1.7 Break-up and disintegration of a liquid jet
(liquid properties similar to gasoline) 94
1.8 Classification of m odes of disintegration (Ohnesorge) 95
1.9 Classification of m odes of disintegration (Reitz) 95
1.10 Jet stability curve indicating change
of break-up length w ith jet velocity 96
1.11 Basic types of globule formation (Hinze) 96
2.1a Histogram of m easured spray distribution
including droplets below 2.6 |im 119
2.1b Repeat of 2.1a w ith percentage of droplets below 2.6 pm
redistributed tiiroug^out remaining spray 119
2.2 Com puted evaporation history of a 50pm n-heptane d ro p let 120
2.3 Family of lines produced by the evaporation of
n-heptane droplets of different initial size 120
2.4 Stages in the calculation of de,o[y] 121
2.5 The use of equivalent diameter, de,o[y]
to characterise si engine fuel sprays (part load operation) 122
2.6 C om puted evaporation histories for the sprays in figures 2.1a and 2.1b 123
2.7 Program m ethodology for seeking specified values of de,o[yl 123
2.8 Program validation
- test case, 100% in one band (96-82.5 pm), 300 m m lens 124
2.9 Program validation
- calculated values, 100% in one band (96-82.5 pm), 300 m m lens 124
2.10 Program validation
- test case, 100% in one band (32-27.5 pm), 100 m m lens 125
2.11 Program validation
- calculated values, 100% in one band (32-27.5 pm), 100 m m lens 125
2.12 Program validation
- test case, 25% in each of four bands (129-71.5 pm), 300 m m lens 126
2.13 Program validation
2.14 Program validation
- test case, m easured distribution, 100 m m lens 127
2.15 Program validation
- calculated values, m easured distribution, 100 m m lens 127
2.16 Program validation
- calculated values (time), m easured distribution, 100 m m lens 128
3.1 The Huygens-Fresnel principle 153
3.2 Interference pattern caused by pinhole 153
3.3 Schematic of a laser diffraction particle sizer 154
3.4 Light intensity distribution in the diffraction
pattern of a circular disc or aperture 155
3.5 Light intensity distribution of three droplet sizes 155
3.6 Dimensionless energy distribution of diffracted light 156
3.7 Fraction of the diffracted energy contained w ithin a circle of radius x 156
3.8 Variation of the angle of diffraction w ith droplet size
(based on the location of the first m axim um of the energy distribution) 157
3.9 Variation of the angle of diffraction w ith droplet size
(logarithm ic axes) 157
3.10 Arrangem ent of detector rings 158
3.11a Calculated result using version 6.1 software
(using same data as used in figure 3.11b) 159
3.11b Calculated result using version B.09 software 159
3.12 Raw light data and calculated result (n-heptane, 21.0 ms delay) 160
3.13 Raw light data and calculated result (n-heptane, 21.5 ms delay) 161
3.14 M easured/calculated fit (for figure 3.13) 162
3.15 M easured/calculated fit (for figure 3.13)
(using Rosin-Rammler model) 162
3.16 Calculated results (n-heptane, 21.5 ms delay)
(using Rosin-Rammler model) 163
3.17 Effect of tem perature changes on Smd 164
3.18 Effect of tem perature changes on de,o[10] 164
3.19 Effect of tem perature changes on dg o[50] 165
3.20 Effect of tem perature changes on de o[90] 165
3.21 Effect of tem perature changes on Smd 166
3.22 Effect of tem perature changes on de o[10] 166
3.23 Effect of tem perature changes on de o[50] 167
3.24 Effect of tem perature changes on de o[90] 167
3.25 Simplistic representation of beam steering 168
3.27 n-heptane spray m easured using 600 m m lens
(Bosch pintle injector B280 735 030) 169
3.28 Gasoline spray measured using 600 m m lens
(Bosch pintle injector B280 735 030) 169
3.29 H ypothetical light energy plots
based on knowledge of diffraction process 170
3.30 Conditioned data w ith large am ounts of
low ang^e scattering and calculated result 171
3.31 Raw light data and calculated result (linear decay from ring 6) 172
3.32 Raw light data and calculated result (upper case decay from ring 6) 172
3.33 Raw light data and calculated result (lower case decay from ring 6) 172
3.34 Raw light data and calculated result (linear decay from ring 7) 173
3.35 Raw light data and calculated result (linear decay from ring 5) 173
3.36 C alculated result, Rosin-Rammler and killdata (first 4 rings) 174
3.37 C alculated result, m odel independent and killdata (first 4 rings) 174
3.38 C om parison of unm odified mean drop size witfi that
calculated after data conditioning 175
3.39 C orrelation of evaporation signal
removed from eighteen différait data files 175
4.1 Cross-section through a Zeta 2B inlet tract 184
4.2 Cross-section through the test passage 185
4.3 Spray deflection d u e to variation in air velocity 186
4.4 Com pleted test passage 187
4.5 General arrangem ent of test rig 187
4.6 M odified Zeta injector housing 188
4.7 Zeta injector m ounted in test passage 188
4.8 Top-fed injector m ounted in test passage 188
4.9 Conventional fuel pum p arrangement 189
4.10 Pyrex cylinder and containment vessel 189
4.11 Air supply arrangem ents for air-fed system 190
4.12 Containm ent vessel for air-fed system 191
4.13 Arrangem ent of test rig and measurement system 192
5.1 Calibration for Bosch m anual control unit 204
5.2 Variation of required fuel pressure w ith manifold depression 204
5.3 A rrangem ent for hot-wire air meter calibration 205
5.4 H ot-w ire air m eter calibration - bulk m ean velocity 205
5.5 Design of pitot tube array 206
5.6 Position of pitot tubes w ith respect to test section 207
5.8 M alv em /Z eta rig air velocity a t spray 208
M anifold depression at WOT 208
5.9
6.1 Intended variation of fuel properties on the surface tension
- dynamic viscosity plane 228
6.2 M easured variation of fuel properties 228
6.3 Effect of pulsew idth variation on m easured droplet diam eters 229
6.4 Variation of m ean diam eter w ith m easurem ent tim e 229
6.5 Com parison betw een air-fed a nd pum p-fed
fuel supply for isohexane 230
6.6 Com parison betw een air-fed and pum p-fed
fuel supply for unleaded gasoline 230
6.7 Drop-size distribution m easurem ent and processing chain 231
6.8 Fuel system for fuel flow m easurem ents 232
7.1 Confirm atory flow test
- fuel flow rate and tem perature versus time elapsed 356
7.2 Influence of orifice len g th /d iam eter ratio on flow pattern (cf[2] ) 356
7.3 Correlation between Reynolds num ber
and coefficient of discharge (Cd) at nozzle exit 357
7.4 C orrelation betw een calculated velocity
and predicted velocity at nozzle exit 357
8.1 Light energy data
- M alvem alignm ent for 600 m m lens and 9 m m diam eter beam 395
8.2 Spray form ation - blend 12 (n-heptane) a t 3 bar,
12 m /s air flow, zero depression 396
8.3 Spray form ation - blend 13 (SBP3) at 3 bar,
12 m /s air flow, zero depression 397
8.4(a) Fuel flow at injector tip - conical sheet form ation 398
8.4(b) Fuel flow at injector tip - pencil-jet form ation 398
8.5(a) Light energy data - n-heptane 399
8.5(b) Light energy data - SBF3 399
8.6 M easured data superim posed upon Reitz chart
show ing m odes of disintegration 400
8.7 M easured data superim posed upon Reitz chart
show ing m odes of disintegration 400
(pencil-jet sprays distinct from well atom ized sprays)
8.8 Laminar, sem i-turbulent and turbulent flow profiles for a circular jet 401
8.9(a) Scale representation of Bosch B280 735 030 injector tip 402
8.9(b) Scale representation of injector tip - lam inar flow hypothesis 403
8.9(c) Scale representation of injector tip - sem i-turbulent flow hypothesis 404
8.11 Effect of air density on droplet size for n-heptane (expanded scale) 405
8.12 Pintle injector/E urograde gasoline at 3 bar,
12 m /s air flow, zero depression 406
8.13 Pintle injector/E urograde gasoline at 3 bar,
2 m /s air flow, 45 cm Hg depression 407
8.14 Effect of fuel pressure on m easured droplet diam eters for n-heptane 408
8.15 Estimated spray core diam eter versus fuel pressure 408
8.16 Spray form ation - blend 12 (n-heptane) spraying into free air 409
8.17 Spray form ation - blend 15 (gasoline) spraying into free air 410
8.18 Air, fuel and relative velocity vectors 411
8.19 Effect of relative velocity on droplet diam eter de o[10] 412
8.20 Effect of relative velocity on droplet diam eter dg o[50] 412
8.21 Effect of relative velocity on droplet diam eter de o[90] 413
8.22 Effect of relative velocity on droplet diam eter Smd 413
8.23 Injectors used during test program 414
8.23 Injectors used during test program (cont.) 415
8.24 Injector data superim posed upon Reitz chart
show ing modes of disintegration 416
8.25 Photographic comparison between injector types (using n-heptane) 417
8.26 Photographic comparison between injector types (using isooctane) 418
8.27 Num erical com parison between injector types (using n-heptane) 419
8.28 Num erical comparison between injector types (using isooctane) 419
9.1 Schematic arrangem ent of test-rig - injector, spray and inlet tract 434
10.1 Drop-size correlation - de o[lO] versus test sequence 456
10.2 Drop-size correlation - de o[50] versus test sequence 456
10.3 Drop-size correlation - Smd versus test sequence 457
10.4 Drop-size correlation - dg o[90] versus test sequence 457
10.5 Residuals versus deleted residuals - de,o[10] 458
10.6 Residuals versus deleted residuals - de,o[50] 458
10.7 Residuals versus deleted residuals - Smd 458
10.8 N orm al probability plot of residuals - de,o[10] 459
10.9 N orm al probability plot of residuals - de,o[50] 459
10.10 N orm al probability plot of residuals - Smd 459
10.11 N orm al probability plot - de o[10] 460
10.12 N orm al probability plot - de,o[50] 460
10.13 N orm al probability plot - Smd 460
10.14 N orm al probability plot - collective non-dim ensional group G i
(REW E2RHO) 461
10.15 Norm al probability plot - collective non-dim ensional group G2
10.16 Correlation subset - de,o[10] versus dynam ic viscosity 462
10.17 Correlation subset - de o[50] versus dynam ic viscosity 462
10.18 Correlation subset - Smd versus dynam ic viscosity 463
10.19 Correlation subset - de,o[10] versus b la id num ber 463
10.20 Correlation subset - de o[50] versus blend num ber 464
10.21 Correlation subset - Smd versus blend num ber 464
10.22 Correlation subset - de,o[10] versus manifold air density 465
10.23 Correlation subset - de,o[50] versus manifold air density 465
10.24 Correlation subset - Smd versus m anifold air density 466
10.25 C orrelation subset - diam eter versus relative air-fuel velocity 466
11.1 Predicted variation of mean droplet diam eter w ith liquid density 482
11.2 Predicted variation of mean droplet diam eter w ith surface tension 482
11.3 Predicted variation of mean droplet diam eter
w ith liquid dynam ic viscosity 483
11.4 Predicted variation of mean droplet diam eter w ith fuel line pressure 483
11.5 Predicted variation of m ean droplet diam eter w ith air density 484
11.6 Predicted variation of mean droplet diam eter w ith air velocity 484
12.1 M odified Lucas air assisted atom izer 510
12.2 Fuel flow versus pulsew idth calibration 511
12.3 Spray form ation for a range of air-assist pressures 512
12.4 Mean diam eter versus air-assist pressure - de o[10] 513
12.5 Mean diam eter versus air-assist pressure - dg o[50] 513
12.6 Mean diam eter versus air-assist pressure - dg o[90] 514
12.7 Mean diam eter versus air-assist pressure - Smd 514
12.8 H ydra single-cylinder research engine show ing injector arrangem ent 515
12.9 Spark tim ing versus lambda for test series 516
12.10 Fuel pressure versus manifold depression for test series 516
12.11 Air-assist pressure versus manifold depression for test series 517
12.12 CoV-IMEP (net) for each air-assist pressure - A,=0.95 517
12.13 CoV-IMEP (net) for each air-assist pressure - X=1.0 518
12.14 CoV-IMEP (net) for each air-assist pressure - X=l.05 518
12.15 CoV-IMEP (net) for each air-assist pressure - A,=l.l 519
12.16 CoV-IMEP (net) for each air-assist pressure - X=1.15 519
12.17 CoV-IMEP (net) for each air-assist pressure - X=1.2 520
12.18 2% cum ulative heat release bum duration
for each air-assist pressure - X=0.95 520
12.19 2% cum ulative heat release b um duration
for each air-assist pressure - X=1.0 521
12.20 2% cum ulative heat release bum duration
12.21 10% cum ulative heat release b u m duration
for each air-assist pressure - X=0.95 522
12.22 10% cum ulative heat release b u m duration
for each air-assist pressure - X=1.0 522
12.23 10% cum ulative heat release b u m duration
for each air-assist pressure - A/=1.05 523
12.24 50% cum ulative heat release b u m duration
for each air-assist pressure - A^O.95 523
12.25 50% cum ulative heat release b u m duration
for each air-assist pressure - X=1.0 524
12.26 50% cum ulative heat release b u m duration
for each air-assist pressure - 1.05 524
12.27 90% cum ulative heat release b u m duration
for each air-assist pressure - A.=0.95 525
12.28 90% cum ulative heat release b u m duration
for each air-assist pressure - X=1.0 525
12.29 90% cum ulative heat release b u m duration
for each air-assist pressure - A.=1.05 526
1230 Brake specific fuel consum ption (bsfc) versus lam bda
- closed valve injection 526
1231 Brake specific fuel consum ption (bsfc) versus lam bda
- open valve injection 527
1232 Carbon m onoxide (CO) emission versus lambda
- closed valve injection 527
1233 Carbon m onoxide (CO) emission versus lam bda
- open valve injection 528
1234 Total hydrocarbon (THC) emission versus lam bda
- closed valve injection 528
1235 Total hydrocarbon (THC) emission versus lam bda
- open valve injection 529
1236 Oxides of nitrogen (NOx) emission versus lam bda
- closed valve injection 529
1237 Oxides of nitrogen (NOx) emission versus lam bda
- open valve injection 530
1238 THC + NOx emission versus lam bda - closed valve injection 530
1239 THC + NOx emission versus lam bda - open valve injection 531
12.40 CoV-IMEP (net) for a range of m ean droplet sizes at X=1,0 531
12.41 2% cum ulative heat release bu m duration
for a range of m ean droplet sizes at X=1.0 532
12.42 10% cum ulative heat release b u m duration
for a range of m ean droplet sizes at X=1.0 532
12.43 50% cum ulative heat release b u m duration
12.44 90% cum ulative heat release b um duration
for a range of m ean droplet sizes at X=1.0 533
12.45 Brake specific fuel consumption (bsfc)
for a range of m ean droplet sizes at A,=1.0 534
12.46 Carbon monoxide (CO) emission
for a range of m ean droplet sizes at X=1.0 534
12.47 Carbon dioxide (CO2) emission
for a range of mean droplet sizes at X=1.0 535
12.48 Total hydrocarbon (THC) emission
for a range of m ean droplet sizes at X=1.0 535
12.49 Oxides of nitrogen (NOx) emission
for a range of mean droplet sizes at X=1.0 536
12.50 THC + NOx emission for a range of m ean droplet sizes a t X=1.0 536
12.51 CoV-IMEP (net) for a range of m ean droplet sizes at A,=1.2 537
12.52 2% cum ulative heat release bum duration
for a range of m ean droplet sizes at k=1.2 537
12.53 10% cum ulative heat release bum duration
for a range of m ean droplet sizes at A,=1.2 538
12.54 50% cum ulative heat release bum duration
for a range of m ean droplet sizes at A.=1.2 538
12.55 90% cum ulative heat release bu m duration
for a range of m ean droplet sizes at X=1.2 539
12.56 Brake specific fuel consumption (bsfc)
for a range of m ean droplet sizes at A.=1.2 539
12.57 Carbon monoxide (CO) emission
for a range of m ean droplet sizes at X=1.2 540
12.58 Carbon dioxide (CO2) emission
for a range of m ean droplet sizes at A,=1.2 540
12.59 Total hydrocarbon (THC) emission
for a range of m ean droplet sizes at X=1.2 541
12.60 Oxides of nitrogen (NOx) emission
for a range of m ean droplet sizes at X=1.2 541
A C K N O W L E D G E M E N T S
The au th o r is particularly indebted to BP International^ for their su bstantial financial
su p p o rt for this research and also for their m aterial su p p o rt through the provision of test
fuels a n d access to their specialist test facilities. P articular than k s are d u e to M r Paul
Beckwith at BP for his assistance and advice.
The contribution of hardw are from Ford a n d Lucas is also gratefully acknow ledged, as is the
c o n trib u tio n m ade by the various technical staff of the D e p a rtm en t of M echanical
Engineering, UCL, in m anufacturing m uch of the test apparatus.
A big vote of thanks is given to Dr Chris N ightingale for his continued patience, help and
advice over an extended period, w ith o u t w hich this thesis w o u ld n o t have reached
completion.
Finally 1 w ould like to thank my family, in particular M um for her continued su p p o rt right
IN T R O D U C T IO N
In a w o rld of ever increasing environm ental aw areness, th e p ressure u p o n the vehicle
m an u facturer to p ro d u ce a ’clean’ gasoline fuelled vehicle w ith low levels of po llu tan t
em issions is intense. An area w hich has, u n til recently, received little a tte n tio n is the
potential role to be played by the gasoline in reducing emissions. Various additives are used
to condition’ the fuel and keep the fuel system and com bustion cham ber clean, b u t little was
know n about the role played by the physical liquid fuel properties.
This thesis is based on a program of research funded by BP International u n d er Extra M ural
Research A w ard (EMRA) 113. The title of the aw ard w as "The effect of fuel properties on
m ixture preparation and how this subsequently affects si engine combustion". The aim of the
research w as to assess how changes in the physical properties of a gasoline (specifically
density, surface tension and viscosity) could affect the dro p let sizes produced by existing si
engine fuel system s and w hether these changes w ould, in turn, have a significant effect on
engine performance.
Initially it w as intended that rig testing to m easure d ro p le t sizes and engine testing to
m easure engine perform ance w ould form approxim ately equal parts of a test program . In the
event it transpired that the former required m uch m ore preparation than anticipated, which
m eant that there w as lim ited time rem aining to carry o u t engine test w ork. The m ajority of
this thesis is therefore devoted to the characterization of injector sprays and analysis of the
data, followed by a single chapter assessing the effect of droplet size on engine perform ance.
The thesis has been sp lit into two volum es. The first contains chapters 1 to 6, the
prelim inary w ork w hich w as required in order to establish a suitable program m e of research,
design and commision a suitable test rig, and to enable confident and reliable m easurem ent of
droplet sizes. The second volum e contains chapters 7 to 13 w hich are the results, analysis and
C H A P T E R 1
FUEL M IX TU R E P R E P A R A T IO N FO R S P A R K I G N IT IO N E N G IN E S
A LIT E R A T U R E S U R V E Y
This literature survey w as carried out prior to com m encem ent of the research program m e. It
investigated the current level of know ledge in the design of spark ignition (si) engine fuel
system s an d delivery arrangem ents, the theory of atom ization and spray form ation, droplet
break-up and spray characterization techniques. N o attem p t has been m ade to u p d ate this
section in the light of the results obtained d u rin g this research program m e, b u t w here
necessary points raised d u rin g the litera tu re su rv ey w ill be discussed fu rth er in later
ch a p te rs.
1.1 INTRODUCTION
1.1.1 The spark ignition engine - a brief history
As an introduction to the topic of m ixture preparation in the spark ignition engine it is
probably appropriate to give an overview of the processes involved.
In the sim plest term s tiie engine is providing a m eans of converting the chemical energy in
the fuel into mechanical energy at the crankshaft. The process w as first p u t into practice by
Nicolaus O tto in 1876 and is of course well know n. C onversion is achieved by inducing a
m ixture of air and fuel into the combustion cham ber (cylinder), com pressing and igniting it,
and then utilising the energy from the high pressure gases produced to push dow n the piston.
The w aste products (exhaust gases) are then expelled and the cycle is repeated.
The detailed processes involved are, how ever, very complex and the design of an engine to
m ake best use of the available energy is a difficult task. Designers have for decades sought to
im prove and refine the spark ignition engine, from its earliest days as a stationary engine, to
its present status as the m ain form of power unit in use in passenger automobiles today.
In the last ten to fifteen years, progress has been m ade at, perhaps, a m ore accelerated rate.
Some of this acceleration can probably be related to the w o rldw ide increase in private car
ow nership. Also the w idespread adoption of com puters in the design office in the last few
years, has allowed engine components, arrangem ents and structures to be optim ized in ways
not previously possible. How ever, as pointed o u t by Norbye [65], priorities in engine design
have undergone two major changes in the last tw enty years. Early em phasis w as m ainly on
m axim um pow er, consistent w ith reliability a n d long life. Then, from the early 1960's
on w ards the air pollution problem began to receive attention, w ith the realisation th at
1970 m ade antipollution m easures a priority. Following this, in 1973, came the Yom K ippur
W ar, leading to an oil shortage, which caused a spiralling in petrol prices a n d m ade fuel
economy of prim e importance. Engine designers from then onw ards became u n d e r pressure to
develop economical, but high pow ered engines, w hich are environm entally friendly w ith so
called clean' exhaust.
Today, all industrialised countries have legally prescribed em ission tests, carried o u t on
chassis d y n a m o m e te rs (rolling roads). Levels of C arb o n M onoxide (CO), u n b u rn e d
H ydrocarbons (HC), Oxides of N itrogen (NOx) and C arbon Dioxide (CO2) are generally
m easured over prescribed test cycles, which include periods of idle, acceleration, cruise and
overrun. These tests vary in exact content and prescribed limits from country to country. In the
USA there are also lim its on the m axim um fuel consum ption. California has historically
alw ays led the way, w ith the rest of the USA following closely in term s of the stan d ard s set,
w hilst E urope has tended to be slightly less strict. D espite this. G oldsm ith [28] points out
that the E uropean standards are now about 75% m ore stringent than w as the case som e 20
years ago. A t the tim e of w riting the levels in force in the UK w ere prescribed by the
European standard ECE 15.04, b u t were shortly to be superseded in by the m uch stricter ECE
15.05 (table 1.1).
In recent tim es, public awareness of the green' issues both in this country, a n d aro u n d the
w orld, has increased dram atically, which can only indicate fu rther tightening of em issions
legislation in the years ahead. Concern is grow ing over the issue of global w arm in g (the
green h o u se effect), w hich it is thought will re su lt from a n im balance of C O2 in the
atm osphere. C urrently there are no limits set on CO2 em issions, although these cannot be
ruled o u t in the future. It is w orth noting that the m ost significant m ethod of reducing the
CO2 emissions from an engine (w ithout modification to the carbon content of the fuel), w ould
be to im prove the fuel economy.
All three facets of engine performance m entioned (ie power, econom y and emissions) can be
directly affected by the efficiency and stability of the com bustion process. These in tu rn are
influenced by (am ongst other things) the ratio of air to fuel and the fuel m ixture 'quality'.
Leaving aside m any of the other aspects of the engine design, this in tro d u c tio n will
concentrate on the role of a ir/fu e l mixture preparation on engine performance.
1.12 The requirement for mixture preparation in an si engine
O ne of the requirem ents for the operation of a spark ignition (si) engine, is th a t each
cylinder is supplied with air and fuel in the correct proportions for com bustion. It is w idely
thought th at this should ideally be a completely vaporised m ixture.
The theoretically ideal ratio of air to fuel, giving just sufficient air for com plete com bustion
of the fuel, is called the stoichiom etric a ir/fu e l ratio (APR). The actual v a lu e varies
d ep ending on the fuel com position, but is typically around 14.6:1, although m ost m odem si
respectively). It is often convenient to use the relative a ir/fu e l ratio. Lam bda (X), w hich is
the ratio of the actual APR to the stoichiometric APR, such that;
(A PR ) ^ _ actual
(A PR )
stoich (1.1)
(note - equivalence ratio is die inverse of this function)
Ideally, each cylinder should contain a m ore or less hom ogeneous m ixture of fuel vapour and
air, each cylinder receiving the sam e qu an tity of m ixture a t the sam e APR. This should
continue for as long as operating conditions rem ain constant. T hus, precisely m etered
quantities of very small droplets w ould seem desirable, w hich should become entrained in the
airflow and evaporate quickly d ue to their large surface area to volum e ratio. The term
m ixture quality' is often used to describe how well these requirem ents are met.
1.13 The combustion process
Com bustion is initiated by a spark discharged at the electrodes of a spark plug. This creates
a small nucleus of flame that propagates into the u n b u m ed gas (end gas), until it is quenched
by the boundaries of the cylinder w all and the piston. Por the efficient operation of a n si
engine, controlled combustion should occur as quickly and as completely as possible around the
condition of m inim um volume (TDC).
The efficiency of the com bustion process is influenced by several factors. These include
com bustion cham ber shape and spark plug location. How ever, a m ajor factor is the quality
and APR of the m ixture supplied to the cylinders. These are largely governed by the design
and integration of the fuel preparation device (ie carburettor or injection system usually) and
the intake manifold and ports. There is also dependence on the properties of the fuel supplied
to the preparation device, which will be discussed m ore fully in sections 1.8 and 1.12.
1.1.4 Relation of APR to power, economy and emissions
The relation betw een the APR and power, econom y and em issions is well established, both
in theory and in practice.
M axim um pow er is generally achieved w ith m ixtures slightly rich of stoichiom etric, giving
excess fuel and complete utilisation of the available air. H ow ever, m axim um fuel economy
(or m in im u m BSPC) is achieved ju st lean of stoichiom etric, w here there is excess air,
prom oting m aximum utilisation of the available fuel (too lean and com bustion m ay become too
slow).
These obviously conflict, requiring the fuel system to be ideally capable of providing richer
m ixtures under periods of high load (eg acceleration, etc) and leaner m ixtures for lower load
The requirem ent is m ade m ore complex w hen exhaust emissions are considered. Typical
plots of exhaust emissions, power and economy, versus APR are shown in figures 1.1 and 1.2.
CO2 is a norm al product of combustion, and it can be seen to peak a t around stoichiometric.
Rich of stoichiometric it is reduced due to insufficient oxygen for com plete com bustion of the
fuel, and lean it diminishes due to a reduction in die fuel quantity being burned.
CO is a product of incom plete combustion. This is highest a t rich AFR's d u e to incom plete
com bustion to CO2. It falls to a low value just lean of stoichiometric, w here there is excess air,
after w hich it reduces little.
H C s are again d u e to incom plete com bustion, b u t can be from various sources w ithin the
cylinder. The trend is, however, similar to th at for CO.
NOx are not a product of com bustion itself, b u t a byproduct of the processes involved. They
are directly related to peak cylinder tem perature (and thus peak pressure and engine load),
w ith h igher tem perature resulting in increased NOx form ation, and they characteristically
peak just lean of stoichiometric.
Lenz [45] sum m arised the implications of the trends in pow er, econom y and emissions. He
suggested that fuel rich m ixtures give high perform ance, low er com bustion tem peratures,
sm ooth running and relatively low emissions of NOx. H ow ever, they also give high CO and
HC emissions as well as high fuel consum ption. Lean m ixtures reduce the CO and H C levels,
and also the fuel consum ption, b u t initially raise the level of NOx. O nly w ith very lean
AFR's do the NOx em issions fall, w hilst this m ay be very close to the lean lim it of the
engine.
A definition of the lean lim it, is that it is the lim iting AFR, beyond w hich com bustion
becomes unstable, w ith partial burning or m isfire on som e proportion of the engines cycles.
This point is reached w hen any one cylinder contains a portion of charge w hich is too w eak to
combust. It may be noted on cylinder pressure traces, and can m anifest itself as uneven running,
w ith a sharp upturn in HC emissions and a reduction in fuel economy.
Thus, in order to obtain low values of CO, HC and NOx, w hilst returning good fuel economy,
it w ould seem that investigation into increasingly lean AFR’s m ight yield useful results. This
is discussed in section 1.7.1.
Lenz [45] used the concept of a three dim ensional plane to describe an optim al AFR for every
speed and load point w ithin the operating range of the engine. The value of the AFR w ould
be dependent on the dem and that is most im portant a t each point, be it pow er, econom y or the
fulfilm ent of exhaust em ission regulations. It should also be noted th at a particular plane
w ould only be valid at a particular engine tem perature, w ith the requirem ents of a cold engine
1 2 EMISSION CONTROL STRATEGIES
W ith the increasingly stringent requirem ents from the various regulatory bodies, the raw
em issions from a 'basic' engine are less likely to be w ithin acceptable limits, even w hen tight
control of the AFR is observed. Emission control strategies are used to ensure that u n d er all
operating conditions the engine does n ot exceed the prescribed em ission levels. The strategies
m ay be features of the engine design, or limits applied by the calibration engineer d u rin g the
developm ent stage.
12.1 Exhaust gas recirculation (EGR)
One m eans of reducing NOx emissions is by using EGR. There w ill alw ays be some residual
bu rn ed gas fraction in the cylinder from the previous com bustion process. H ow ever, the
principle of EGR is that introducing additional b u rn ed gas to the charge w ill d ilu te the
m ixture. This should result in cooler combustion, thus reducing NOx em issions. This is m ost
useful at p a rt load conditions, (which are the m ain part of m ost em ission test cycles), w hen
operation at, or close to, stoichiometric (and thus close to the raw NOx peak) is desired.
This m ethod is, however, generally avoided if possible, d u e to the need for a circulating and
regulatory system . In addition, too m uch dilution of the charge can cause m isfire and partial
burning, raising HC levels.
1.2.2 R etarded ignition tim ing
This can also be used to reduce NOx emissions. Peak com bustion tem perature is reduced as
the ignition tim ing is retarded from m inim um spark advance for best torque (MBT). This
obviously results in a reduction in torque a n d can have o th er problem s associated w ith
retarded tim ing (see section 1.4). In some circumstances though it m ay be m ore acceptable than
fitting an EGR system.
1.22 Exhaust gas aftertreatm ent
O ne of the m ost com m on means of controlling emissions is exhaust gas aftertreatm ent, m ost
usually by catalytic conversion.
The exhaust gases usually contain a m odest am ount of oxygen w hen the engine is running
lean, or m ore substantial am ounts of CO w hen rich. Thermal oxidation of the HC and CO is
possible in theory, but requires tem peratures in excess of 600 and 700*C respectively, and
residence tim es greater than 50 ms for the former [35]. The tem perature of exhaust gas in an si
engine can vary from 300 - 400*C during idle, to around 900*C at high load, although the most
common range is 400 - 600"C. Thermal oxidation is not, then, often used.
Catalytic oxidation of CO and HC can occur in tiie exhaust at tem peratures as low as 250*C.
This m ay be carried out in an oxidation catalyst. These m ay som etim es be used allied to a
lean b u m engine (where NOx emissions are low). Reduction of N O to p ro duce N ] is also
The m ost com m on type of catalyst in general use is the Three W ay C atalyst (TWC), so
called because it deals w ith CO, HC and NO in one catalyst bed. The TWC is only effective
in a narrow w indow ' about stoichiometric AFR. Enough reducing gases will then be present to
reduce NO an d enough O2 to oxidise the CO and HC. Closed loop control of the equivalence
ratio using an exhaust gas oxygen (EGO) sensor is usually adopted. This then senses w hether
the engine is operating rich or lean of stoichiom etric a n d readjusts the fuelling to suit. This
cycling from slig h tly rich to slightly lean a c tu a lly im p ro v es th e c ataly st conversion
efficiency.
The type of TWC usually em ployed in autom otive applications uses Platinum , Palladium
and R hodium as catalysts. 'Light o ff tem p eratu re (at w hich point catalyst reaches 50%
conversion efficiency) is usually around 300*C, w ith m axim um efficiency n o t reached until
aro u n d 400'C. Care m ust be taken as the catalyst can be m elted if u n b u m ed fuel becomes
ignited w ithin the exhaust, or poisoned if fuel containing lead is used (reducing effectiveness).
The TWC is used alm ost universally in America and also in m uch of Europe, b u t it is only just
becom ing accepted in the UK. Acceptance is likely to speed up w ith increasingly stringent
European legislation, and the w ide availability of unleaded fuel.
1 3 EXHAUST GAS ANALYSIS
The preceding sections have referred to the concentrations of various gases found in the
exhaust of the si engine. This section aim s to give some guidelines to their m easurem ent.
13.1 Measuring equipment
The gases are generally m easured using well established laboratory equipm ent, which gives
direct readings of the relevant concentrations to the operator.
The hydrocarbon concentration is usually m easured using a flame ionisation detector (FID).
This w orks by burning the gas sam ple in a hydrogen-air flame, w hich produces ions in an
am ount proportional to the num ber of carbon atom s burned. The device is calibrated w ith
sample gases of know n concentration. The results are usually given as m ole or volum e fraction,
in parts per million (ppm) Ci, ppm propane (CgHg), or ppm hexane (C6H14).
CO and CO2 m easurem ents are usually m ade using nondispersive infrared (NDIR) analysers.
Here, the infrared absorption of the exhaust gas contained in a sam ple cell is com pared to the
absorption in a reference cell, using the principle that each of these exhaust gas constituents
absorbs infrared light of a different w avelength. Again these analysers are calibrated using
gases of know n composition. The results w ould norm ally be given as % by volum e of the gas in
question. HC m easurem ents m ay also be m ade w ith NDIR equipm ent. How ever, caution m ust
be exercised in the use of NDIR analysers for HC m easurem ent (as pointed o u t by Heywood
[35]). The concentrations of HC m easured using NDIR are typically about half those m easured
m easured. Thus NDIR HC m easurem ents are often doubled to give actual HC concentrations.
An advantage of NDIR analysers is their im proved portability over FID equipm ent. HC and
CO (and possibly CO2) meters m ay often be contained in one small unit, giving sim ultaneous
readings.
NOx m ay be m easured using a chem ilum inescent analyser. The N O in the exhaust gas is
reacted w ith ozone in a flow reactor, creating electronically excited N O2 m olecules. These
em it radiation as they decay back to a g round state. This radiation is m easured using a
photom ultiplier, the am ount produced being proportional to the am ount of NO. A ny N O2 in
the exhaust gases m ay be first decom posed to N O in a heated stainless steel tube, so that total
NOx m easurem ent is possible. Again this will be presented as % by volum e.
O xygen concentration m ay be determ in ed u sin g a param agnetic analyser. Also, gas
chrom aphotography m ay be used to m easure O2, any other inorganic species (ie N2, CO2, CO,
H2) or individual hydrocarbon compounds.
1.3.2 Precautions w hen taking m easurem ents
W hen m easuring HC, it is im portant n o t to allow condensation of the hydrocarbons in the
sam ple line (thus reducing the m easured values). The sam ple line is often heated to avoid
such problems.
W hen m easuring CO and CO2 the exhaust sam ple should be dried before it enters the NDIR
analyser, as the w avelength range over w hich infrared rad iation is absorbed by w ater
vapour, overlaps those of both these gases.
13.3 Experim ental sam pling techniques
To obtain sim ple average values of exhaust gas concentration, a sam ple is usually d raw n
continuously from some point dow nstream of the exhaust m anifold, w here the gases have
become well mixed.
A lternatively, m easurem ents m ay be m ade of individual cylinder averages, b y taking the
sam ple from the exhaust ports or m anifold, in the individual tracts, near the valves.
A ttem pts have been m ade to take HC m easurem ents rapid enough to show variations in
concentration, at the exhaust valves, over individual engine cycles. This has been possible by
using FID instrum ents, sited very close to the sam pling point (reducing tim e lags in sampling),
w ith specially designed sam pling probes. An exam ple is given in the pap er by Collings and
Fade [17].
13.4 Vehicle em ission tests
These are carried o ut by m easuring the exhaust gas concentrations in the exhaust tailpipe of
the vehicle, w hilst the vehicle is d riv e n to prescribed test cycles on a rolling ro ad (as
m entioned in section 1.1.1). A continuous sam ple is taken over the cycles and som e form of