R E S E A R C H
Open Access
Research on denoising processing of
computer video electromagnetic leakage
reduction image based on fuzzy degree
Chunwei Miao
Abstract
On the basis of analyzing, receiving, and parsing the computer video electromagnetic leakage emission signal, an image of the screen display content can be obtained. Due to the interference noise existing in the receiving process, the received image information may be drifted, the recognition may be poor, and the definition might be low. In order to improve the recognizability of the restored image, firstly, based on image noise analysis, cumulative averaging and noise smoothing, this paper proposes an image processing method based on ambiguity for electromagnetic leakage emission reduction image. Secondly, according to image denoising implementation steps, combined with computer video reproduction example, the image processing method was verified by comprehensive experiments. Lastly, the image evaluation and signal-to-noise ratio analysis of the experimental results were carried out. The results show that the image processing method based on the ambiguity of electromagnetic leakage emission reduction image has some improvement in subjective and objective evaluation with obvious promotion.
Keywords:Electromagnetic leakage emission, Fuzzy degree, Image processing, Image evaluation
1 Introduction
Changes in current during the operation of the com-puter will result in electromagnetic leakage emissions. If these electromagnetic leakage emissions are received for analysis, they may be restored with relevant information,
resulting in information leakage [1–5]. Computer video
information is one of the most intuitive and threatening of it. Dutch researcher Eck W Van demonstrated the ex-periment of video reception and restoration in 1985 and published an article in Computer & Security, detailing the technical details of the feasibility of recovering and restoring computer monitor screen information by sim-ply modifying the TV set, which caused a huge sensation in the information security session. As the radiation per-formance of computer video information is relatively high, electromagnetic leakage transmission signals are more easily received, and video information becomes the most easily intercepted and reproduced red information
in computer systems [6–8]. Due to the inevitable
electromagnetic environment, receiving distance, equip-ment noise, and other factors in the process of receiving and restoring video information, a large amount of noise is introduced into the received image, which has prob-lems such as drift, poor recognition, and low definition, which seriously affects the image recognition. Therefore, image denoising processing and visual effects improve-ment are particularly important. Essentially, image denoising is a way to remove the noise of a contami-nated image. Common denoising algorithms are divided into spatial domain methods and transform domain al-gorithms. The spatial domain algorithm directly pro-cesses the pixels to separate the real signal from the noise. The transform domain algorithm firstly trans-forms the signal into another domain, such as the fre-quency domain by using a transform method; processes the representation coefficients in the transform domain according to different characteristics of the signal and noise in the transform domain; and finally inversely transforms to the image space domain. In this way, the image denoising is obtained after such process. Hwang et al. proposed an adaptive median filtering method Correspondence:[email protected]
School of Computer and Information Technology, Beijing Jiaotong University, Beijing, China
based on the ranking order. Determining if the pixel gray value is received is the key to decide whether to use median filtering [9]. Based on this method, an improved method has emerged, using different constraints to con-struct the objective function to denoise the image [10]. Shibata proposes a novel misalignment-robust joint filter based on weight-volume-based image composition and joint-filter cost volume [11]. In view of the holding un-satisfactory effects of the traditional non-local means al-gorithm for texture details, an improved non-local means denoising algorithm combined with fuzzy edge complement (FEC) is proposed. The edge texture feature
image is detected by the FEC algorithm [12]. A new
image denoising algorithm based on thresholding-based magnitude and phase regularization of the coefficients of
undecimated dual-tree complex wavelet transform
(UDTCWT) is proposed [13]. The abovementioned
algo-rithms are quite significant in terms of denoising, but some of them bring some problems in the application, such as the image is too smooth, the image information is lost, and the edges become more blurred. Firstly, the paper based on image noise analysis, cumulative aver-aging, and noise smoothing, an image processing method based on ambiguity for electromagnetic leakage emission reduction image, is proposed. Secondly, according to image denoising implementation steps, combined with computer video reproduction example, the image process-ing method was verified by comprehensive experiments. Finally, the image evaluation and signal-to-noise ratio ana-lysis were carried out on the experimental results.
2 Proposed method
Image processing essentially extracts the feature quantity or special information in the image and transforms the gray level of the image to achieve the purpose of improv-ing the signal-to-noise ratio and optimizimprov-ing the image quality. The most valuable thing about the electromag-netic leakage emission reduction image is the text infor-mation, which has nothing to do with color. Therefore, the process of image processing should not only effectively eliminate noise, but also improve the image quality, and also enhance the image according to the characteristics of the text to improve the visual effect [14–16].
2.1 Electromagnetic leakage emission reduction image noise analysis
More and more research results show that correct esti-mation and utilization of image noise have important guiding significance and use value for image denoising follow-up processing. No matter how good the noise re-moval method is, it is impossible to apply it to all noise. Electromagnetic leakage emission reduction image is limited by objective factors such as imaging mode and equipment, and the received image degradation is
serious. It is inevitable to introduce Gaussian noise, short-line impulse noise, and various mixed noises. The noise itself may be related to each other and may be in-dependent of each other, which may or may not be
re-lated to the useful signal, and exhibit different
characteristics. The effect of noise on the image can be described by two different mathematical models [17]:
The additive noise mathematical model can be de-scribed as:
x tð Þ ¼s tð Þ þn tð Þ ð1Þ
s(t) represents a real image signal,n(t) represents addi-tive Gaussian noise, and x(t) represents a noisy image. Electromagnetic leakage emission reduction image since static acquisition is performed on computer video screen information; each frame of static image introduces addi-tive noise, which is addiaddi-tive in nature and independent of the signal.
Multiplicative noise, also known as convolution noise, can be described as:
x tð Þ ¼s tð Þ n tð Þ ð2Þ
s(t) represents a real image signal, n(t) represents multiplicative noise, and x(t) represents a noisy image. Unpredictable noise in electromagnetic leak emission re-duction images is generally a multiplicative noise.
2.2 Image denoising
2.2.1 Accumulated average
The electromagnetic leakage emission reduction image is a periodic image that is actually a period of time be-cause it is a static image. As a periodic repeat image, the general signal is relatively stable and the correlation is better. Additive noise is generally randomly changed, and the multi-frame averaging method can effectively improve the signal-to-noise ratio. Although the noise in a single frame is more serious, statistically speaking, the distribution of signals is regular, and the noise of each image can be considered to be randomly and evenly dis-tributed. Therefore, the cumulative average of multiple images can suppress the noise, to enhance the signal.
After the m images are accumulated and averaged, the
2.2.2 Image noise smoothing
Image noise smoothing is a way to eliminate noise, both to remove noise as much as possible, and not too dis-torted. Commonly used algorithms for noise removal in-clude median filtering, mean filtering, and so forth.
2.2.2.1 Median filtering Median filtering is a nonlinear filtering technique based on sorting statistics theory to remove noise. The basic principle is to replace the value of a point in a digital image with a median value in a neighbor of the point. In the image processing, a 3 × 3 matrix is generally used as a template for image filtering, and some also adopt different shapes, such as a line shape, a circle shape, and a cross shape. It can protect the edge of the image well while removing noise, which is more effective for impulse noise, but it is not ideal for Gaussian noise median filtering.
2.2.2.2 Mean filtering Also known as linear filtering, the main method is the neighbor averaging method. The basic principle is to replace the individual pixel values in the image to be processed with a mean. The method is to use a template with odd points to slide on the image, and the size of the template can be selected according to the actual situation. The template includes adjacent
pixels around it, that is, the surrounding n pixels
cen-tered on the target pixel. The filtering process calculates the mean value of the gray value corresponding to each pixel point in the current template for the current pixel point (x,y) to be processed in the image and assigns the mean value to the current pixel point (x, y) as the gray levelg(x,y) of the image at this point after processing.
Sxy is assumed to represent a filter template window
with a center point at (x,y) and a size ofm×n. Mean fil-tering is to calculate the pixel mean of the filter template window area and assign the mean to the pixel at the center of the window [19]:
g xð ;yÞ ¼mn1 Xð Þx;y∈Sxyf xð ;yÞ ð3Þ wheref(x,y) represents the value of each pixel in the fil-ter template window in the original image, and g(x, y) represents the mean filtered image. In the mean filtering process, the pixel information of the peak value of the image is changed, which causes the image to be blurred, which is not conducive to edge detection. If we consider the weight of each pixel of the window, this time is called weighted median filtering. Equation (3) can be re-written as:
g xð ;yÞ ¼mn1 Xð Þx;y∈Sxyf xð ;yÞK xð ;yÞ ð4Þ where k(x,y) represents the weighted value of the value of each pixel within the filter template window.
Weighted median filtering removes uniform noise and ensures edge clarity to some extent.
2.2.2.3 Filter method selection By comparing the methods of advantages and disadvantages of mean
filter-ing and median filtering, this paper uses 3 × 3
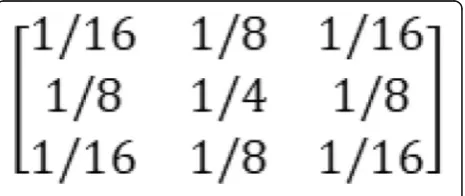
domain-weighted mean algorithm combined with elec-tromagnetic leakage emission to restore the importance of image edge information. The weight coefficient selec-tion of the weighted template is allocated according to the nearest distance principle, that is, the coefficient close to the center point is large, the coefficient far from the center point is small, and the center point itself has the largest coefficient. The specific algorithm for deter-mining the weight coefficient is shown in Eq. (5) [20]:
k¼ 1
2aþbþ2 ð5Þ
where a represents the distance of each point of the template from the center point in the x direction, and b represents the distance of each point of the template from the center point in the y direction. If a 3 × 3 field is selected, the template-specific weighting coefficient can be calculated according to Eq. (5), as shown in Fig. 1:
2.3 Image enhancement
2.3.1 Ambiguity
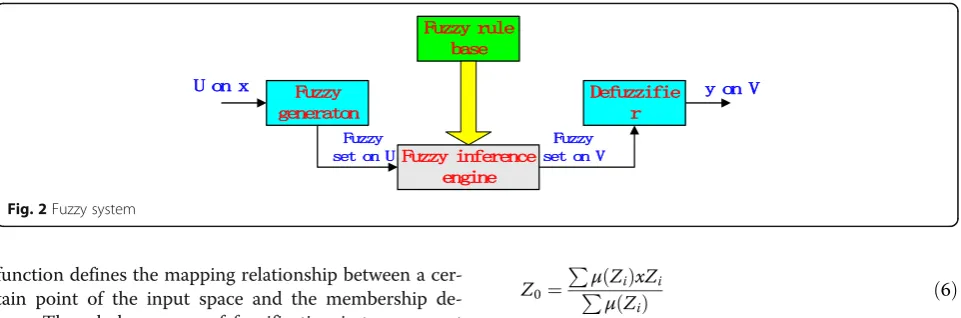
A typical fuzzy system is shown in Fig.2. This fuzzy sys-tem is usually divided into four parts: fuzzy generator, fuzzy inference engine, fuzzy rule base, and anti-fuzzi-fier. In the fuzzification, the input fuzzy set and the
cor-responding fuzzy membership function are first
determined. Compared with traditional collections, the main feature of fuzzy sets is that there is no obvious set boundary, that is, an element may only partially belong to the set. In a traditional set, whether an element be-longs to the set can be represented by true and false, and in the fuzzy set, whether an element belongs to the set is represented by membership degree, that is, to what extent the element belongs to the fuzzy set, belonging to the degree is between 0 and 1. The fuzzy membership
function defines the mapping relationship between a cer-tain point of the input space and the membership de-gree. The whole process of fuzzification is to represent the input determination value with the membership de-gree of each fuzzy set. In the process of fuzzy reasoning, fuzzy rules are used. Commonly used are IF-THEN structures, such as“IF (xis A) AND (y is B), THENzis C”, where C is the output fuzzy set, and fuzzy logic can be used. Obtain the membership degree when the condi-tion is established [14].
The fuzzy inference process uses fuzzy logic to map the membership degree of the input fuzzy set obtained by the fuzzification process to the member-ship degree of the output fuzzy set. The often-used fuzzy logic has AND, OR, etc., and for the AND logic in the fuzzy set, the equivalent membership is the smallest while the OR is equivalent to the largest membership.
If it is known that the input degrees belonging to the
fuzzy sets A and B are a and b, respectively, the
mem-bership of the input belonging to both A and B is MIN (a, b). Fuzzy rules are used in the process of fuzzy rea-soning. Commonly used are IF-THEN structures, and fuzzy logic can be used. If the membership degree is established, the membership degree of the conclusion will be the same.
In general applications, there are multiple fuzzy rules. Each fuzzy rule determines the membership degree of the output in a certain output fuzzy set. In the overlap-ping part of each fuzzy set, the membership degree is taken as the maximum value, so that the final output of the membership graph can be obtained. This method of reasoning is called the minimum-maximum method.
In the fuzzy process, the output membership graph is obtained, and the final defuzzification process is to
map the uncertainty to the determined output.
Anti-fuzzification converts the ambiguity of the out-put variable obtained by fuzzy rule inference into an exact value. The easiest way is the maximum mem-bership method. The most commonly used method in control technology is the area center of gravity method, and the calculation method of the area cen-ter of gravity method is:
Z0¼
P
μð ÞZi xZi
P
μð ÞZi ð6Þ
where μ(Zi) is the membership degree of the output
fuzzy set, and the area center of gravity method is actu-ally the weighted average method.
2.3.2 FIRE filter principle
The fuzzy inference ruled by else-action (FIRE) filter is a fuzzy system based on the IF-THEN-ELSE structure, which maps the input variables nonlinearly to the output variables. In the image denoising process, the input vari-able is defined as the luminance difference value xj=pj
−p(pj∈W), wherepis the luminance value of the
proc-essed pixel point, and W= {pj} is the pixel point in the
neighborhood of p brightness value. The output y is a
correction value of the luminance value of the processed point.
Set the gray level of the image asL, because the input and output variables are relative quantities, and the do-main of the fuzzy set of the FIRE filter is [−L+ 1,L−1].
The fuzzy set defining the input variable is X positive
and X negative, represented by PX and NX. The fuzzy
set of the output variable is Ynegative, Yzero, Y nega-tive, and is represented by PY, ZY, and NY, respectively. According to symmetry, there is:
μNXð Þ ¼Δx μð−ΔxÞ;μNXð Þ ¼Δy μPYð−ΔyÞ ð7Þ
whereΔx is input;Δy is output; and μNX,μPX, μNY, and
μPX are the corresponding membership functions. The above formula indicates that the corresponding member-ship function takes values in the interval (−255, 255) and is symmetric with respect to 0.
In general, the rule base of a FIRE filter consists of two sets of symmetric sub-rule bases and an ELSE rule, in the form as follows:
IF (x1isA11) AND (x2isA12)……AND (xMisA1M)
THEN (yis PY)
IF (x1isA21) AND (x2isA22)……AND (xMisA2M)
THEN (yis PY)
IF (x1isAN1) AND (x2isAN2)……AND (xMisANM)
IF (x1isA*11) AND (x2isA*12)……AND (xMisA*1M)
THEN (yis NY)
IF (x1isA*21) AND (x2isA*22)……AND (xMisA*2M)
THEN (yis NY)
IF (x1isA*N1) AND (x2isA*N2)……AND (xMisA*NM)
THEN (yis NY) ELSE (yis ZY)
where Aij is a fuzzy set corresponding to the jth vari-able in the ith rule, which is PX or NX. According to the symmetry, the membership function of A*ij satis-fies μAðΔxÞ ¼μAð−ΔxÞ. The first set of sub-rule bases is used to process negative noise points, giving a positive correction value, and the second set of sub-rule bases is used to process positive noise points, giving a negative correction value. Within a rule base, the first rule processes the uniform area of the image, and the other rules process the detail area.
For a given input variable {xj}, set the λPOSi and λNEGi
as the output strength of theith rule in the positive and negative sub-rule bases, i.e.;
λPOSi ¼ min μAij xj ; j¼1;⋯;M
n o
ð8Þ
λNEGi ¼ min μAij xj ; j¼1;⋯;M
n o
ð9Þ
The total output intensity of the positive and negative sub-rule bases ofλPOSandλNEGis:
λPOS¼ maxfλPOSi; i¼1;⋯;Ng ð10Þ
λNEG¼ maxfλNEGi; i¼1;⋯;Ng ð11Þ
The fitness of the ELSEλ0rule is:
λ0¼1−λPOS−λNEG ð12Þ
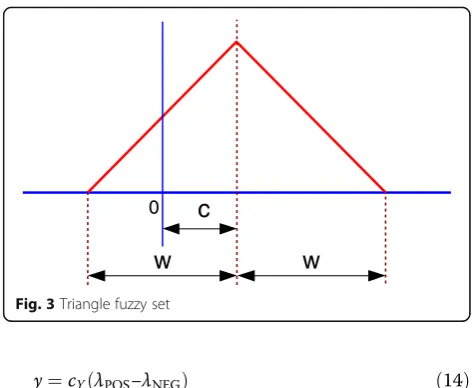
The output fuzzy set uses a triangular fuzzy set, as
shown in Fig. 3, where Crepresents the position of the
center point of the fuzzy set, andW represents the half
width. The output of the positive and negative sub-rules and the ELSE rule can be obtained:
y¼CPYWPYλPOSþCZYWZYλ0þCNYWNYλNEG
WPYλPOSþWZYλ0þWNYλNEG ð13Þ
For fuzzy logic, the membership function can be deter-mined by itself. By designing symmetric and equal-width membership functions, we can get cPY=−cNY=cY, wPY
=−wNY=wY, cZY= 0, and wZY=wY. Then, the formula
can be simplified to:
y¼cYðλPOS−λNEGÞ ð14Þ
2.3.3 Image sharpening
In the early noise image smoothing process, the bound-aries and contours in the image are often blurred. In order to reduce the influence of such unfavorable effects, it is necessary to use image sharpening technology to make the edges of the image clear, reduce the blurring effect caused by the image modification, highlight the outline of the image, and effectively improve the clarity of the text details. The more commonly used algorithms are gradient sharpening, Laplacian sharpening, and high-pass filtering.
In this paper, the FIRE operator is used for sharp-ening. It is mainly used in image denoising and edge detection. The FIRE operator is a class of nonlinear operators that deal with digital images using fuzzy in-ference mechanisms. This method operates on pixels in the neighborhood window, and for each pixel of the image, its neighborhood grayscale difference set is examined (Fig. 4).
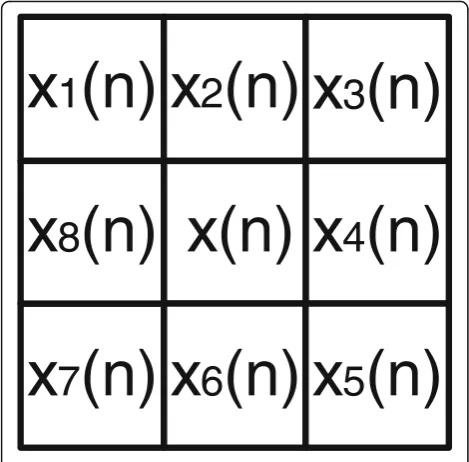
Let x(n) denote the gray value of the pixel located
at n= [n1, n2], W(n) = {xj(n); j= 1,...,8} denote the gray of the 3 × 3 neighborhood collection of values, as shown in Fig. 5.
We define the input of the FIRE operator as the neigh-borhood grayscale difference, Δxj=xj(n)−x(n), and the
outputΔy(n) is obtained by fuzzy inference, and the final outputy(n) =x(n) +Δy(n) is the corrected result.
In practice, according to the pixel of Fig. 6, take
5 × 5 neighborhood, consider the combination of
modes in eight directions: B1 = {0, 1, 9}, B2 = {0, 2,
11}, ..., B8 = {0, 8, 23}.
Since the received computer video electromagnetic leakage emits a restored image as a binary image, the de-sign fuzzy rules are as follows:
IF(x1isA) AND (x9isA) THEN (yis NY) 0
c
w
w
IF(x2isA) AND (x11isA) THEN (yis NY)
IF(x8isA) AND (x23isA) THEN (yis NY)
ELSE (yis ZY)
The rule indicates that the surrounding pixel points
are lower than the target point pixels, and y takes a
negative value to reduce the brightness of the target
pixel point; otherwise, the target pixel brightness does not change.
It can be seen that this method considers the sharpen-ing index in all directions around the pixel and conforms to the directional characteristic of the character stroke. According to the fuzzy reasoning, if there is no sharpen-ing, the central pixel has no change, the subjective rea-soning of the fuzzy rearea-soning compound person, showing the effectiveness of fuzzy logic.
2.3.4 Contrast enhancement
The methods of contrast enhancement mainly include histogram modification, gradation transformation, and histogram equalization. The histogram modification technique can enhance the text information, but the noise at this time is not weakened but enhanced. The gradation transformation can change the original gray value distribution of the image, both linear and nonlin-ear. The gradation transformation can improve the sharpness of the image, expand or compress the entire range of the gray level of the image or one of the seg-ments, and display the details of the image that need to be highlighted. Histogram equalization is a histogram correction method based on the cumulative distribution function transformation, which can produce an image with a uniform probability density of grayscale distribu-tion. This is a relatively common method of contrast enhancement.
In this paper, the method of ambiguity contrast en-hancement is selected. This method is based on the glo-bal gray distribution to adjust the contrast. Through the fuzzy inference mechanism, the soft computing method is introduced to make the grayscale transformation more in line with the human visual experience. The basic idea of the algorithm is briefly described as follows:
1. Calculate the gray histogram of the image to determine the grayscale distribution of the image. 2. Define a single fuzzy set dark, gray, bright,
membership function as shown in the left line of Fig.2, representing the linear function of the segment, respectively representing the size of the gray level belonging to the three fuzzy sets of dark, gray, and bright. Three membership degrees are found for the gray levels in each grayscale range. 3. Use fuzzy inference mechanism with the following
simple rules:
IF dark, THEN black; IF gray, THEN gray; IF bright, THEN white.
The grayscale determined by the gray histogram deter-mines the fuzzy single value of the three fuzzy sets, as
x
1
(n)
x
8
(n)
x
7
(n) x
6
(n) x
5
(n)
x(n) x
4
(n)
x
2
(n) x
3
(n)
Fig. 4Neighborhood greyscale set
9
11
13
1
2
3
23
8
4
15
7
6
5
21
19
17
shown in Fig. 2, taking S1= gmin, S2= gmid; S3= gmax for defuzzification, using the following formula:
g0¼μdarkð Þ g S1þμgrayð Þ g S2þμbrightð Þ g S3
μdarkð Þ þg μgrayð Þ þg μbrightð Þg
ð15Þ
S1= gmin,S2= gmid, andS3= gmax are the minimum,
intermediate, and maximum value of gray, respectively, in the image obtained by the gray histogram, represent-ing black, gray, and white, and is set to a srepresent-ingle value of the fuzzy set.
The above formula can be regarded as a general weighted average method to solve the deblurring problem.
It can be seen from the above steps that the contrast enhancement method based on the fuzzy rule actually uses a fuzzy inference mechanism to create a grayscale map to implement grayscale transformation. This method considers the grayscale distribution range of the image as a whole. The gray level is fuzzy classified, and its visual effect is obviously superior to the traditional gray level equalization method.
3 Simulation experimental results and discussions
According to the above analysis, combined with the ac-tual receiving environment of electromagnetic leakage transmission and receiving video information, we con-ducted experimental verification. The experimental com-puter uses a Lenovo desktop with a resolution of 1024 × 768. The following is the effect of combining the differ-ent images of the electromagnetic leakage emission re-duction sample image of the same display video signal. The first two steps are respectively processed according to the weighted mean filtering and the blur sharpening selected by image denoising and image enhancement. In order to better compare with other algorithms, the last step is to use fuzzy enhancement, gray balance, and grayscale stretching.
Specific steps are as follows:
1. Weighted mean filtering→blur sharpening→fuzzy enhancement
2. Weighted mean filtering→blur sharpening→gray balance
3. Weighted mean filtering → blur sharpening → grayscale stretching
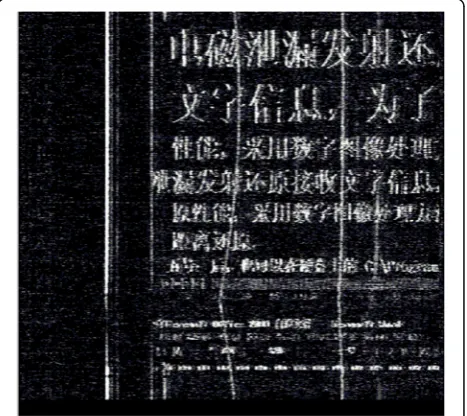
Figure7is an original image after a cumulative average of a static image of a 100-frame electromagnetic leak
emission reduction sample. Figures 8, 9, and 10 are
image effect diagrams processed by the combination of the above various algorithms.
4 Discussion
4.1 Subjective evaluation of images
The evaluation of image quality is usually divided into subjective evaluation and objective evaluation. The sub-jective evaluation is mainly to select a group of people to subjectively score the images before and after processing, so as to obtain the improvement degree of the image. This evaluation method can reflect the quality change of Fig. 6Gray histogram
the image before and after the treatment to a certain ex-tent, but the subjectivity is strong, and the result is re-lated to the visual difference between the selected person and the individual, and the result is not certain.
From the results of the above processing, Figs.8and 10
have a certain visual improvement, and the processing of Fig.9has decreased.
4.2 Objective evaluation of images
The objective evaluation is divided into two types, one is the evaluation method with reference image, and the commonly used evaluation indicators are mean square
error (MSE) and peak signal-to-noise ratio (PSNR). The expression for MSE is:
MSE¼
X
M−1
i¼0
XN−1
j¼0
fi;j−^fi;j
2
MN ð16Þ
i and j represent the position index of the pixel, fi, j
and ^fi;j respectively represent the original (no noise)
image and the restored image, andMandNrespectively
represent the height and width of the image. The expression for PSNR is:
PSNR¼10 log10255255
MSE ð17Þ
The higher the value of the peak signal-to-noise ratio, the closer it will be between the result after denoising and the original image signal, and the less the distortion is in the result. It should be noted that the value of the peak signal-to-noise ratio is not exactly the same as the effect of human visual perception. For some visually pleasing results, sometimes the peak signal-to-noise ratio is rather small. This is because the perception of error by human vision is affected by many factors, which leads to deviations in the perception of errors.
The other is an evaluation method without a reference image. For the electromagnetic leakage emission image of the monitor video signal restored by the receiver, there is no standard original image itself, and only this evaluation method can be adopted. The following is a detailed introduction to the signal-to-noise ratio evalu-ation method without a reference image.
Fig. 8Weighted mean filtering →fuzzy sharpening→ fuzzy enhancement
Fig. 9Weighted mean filtering→blur sharpening→gray balance
The principle of the signal-to-noise ratio estimation method without reference image is to first estimate the magnitude of the image noise variance, calculate the peak signal-to-noise ratio (PSNR), and then estimate the improvement of the signal-to-noise ratio according to the noise variance and the PSNR. The PSNR of the proc-essed image minus the PSNR of the original image is the estimated signal-to-noise ratio improvement.
The traditional estimation of noise variance is to take the flat region in the image for calculation. Let digital image noise be the signal be represented asx(n) =s(n) + u(n), the sample length be theN, wheres(n) is the ideal signal, u(n) is the noise signal, and u(n) can be consid-ered as the approximation.u(n) can be considered to
ap-proximate the Gaussian distribution of N(0,σ2). For
additive noise, the signals(n) is statistically independent of the noiseu(n).
The expectation of the mixing noise signal is:
E x n½ ð Þ ¼E s n½ð Þ þE u n½ ð Þ ð18Þ
E x n½ ð Þ ¼E s n½ð Þ¼~N1X N
n¼1
s nð Þ ð19Þ
The signal variance is:
D x n½ ð Þ ¼D s n½ð Þ þD u n½ ð Þ ð20Þ
If the flat area of the image can be accurately ex-tracted, then the variance of the noise can be evaluated. In a local flat area, assuming that the noise signal is Gaussian white noise, the noise expectation is 0 and the noise variance is σ2. The mean of the ideal signal is the mean of the signal, and the variance of the signal is 0.
Therefore, the variance of the calculated noise signal can be considered as the variance of the calculated noise. The formula is as follows:
E¼MN1 XM i¼1
XN j¼1
g ið Þ;j ð21Þ
σ2¼ 1 MN
XM i¼1
XN j¼1
I ið Þ;j−E
½ 2 ð
22Þ
g(i, j) is the ideal image, andI(i, j) is the noisy image.
WhereEis the mean value, andMandNare the size of
the local area.
In the absence of an objective image and finding a flat area of the image, Eqs. (3) and (4) can be rewritten as:
MSE¼
XM−1
i¼0
XN−1
j¼0 Ii;j−E
2
MN ¼σ2 ð23Þ
PSNR¼10 log10255255
MSE ¼10 log10
255255
σmid2
ð24Þ
A very important indicator for estimating noise accur-acy in this way is to accurately determine a series of flat local regions. The evaluation method first decomposes the image into non-overlapping rectangular regions with approximately the same gray level. The basic idea is to define the consistency criterion as follows: For two
adja-cent regions, the gray mean values are represented by I
and I+ΔI, respectively.ΔIis the difference between the two. If ΔI/I is less than a threshold T, the two regions are considered to have approximate gray levels and be-long to a uniform region, which can be combined. IfΔI/ Iis greater than the thresholdT, the two regions are re-gions that can be clearly separated and have a certain gradation difference. For the selection of flat local re-gions, a flat region can be found by region decompos-ition method or region merging method according to image features.
The local variance and the overall PSNR can be calcu-lated according to Eqs. (9) and (10), whereM and Nis the size of the selected flat region. To maintain the ro-bustness of the noise variance estimate, the variance used to calculate the PSNR takes the median of the vari-ance sequences for all local regions.
4.3 Evaluation results
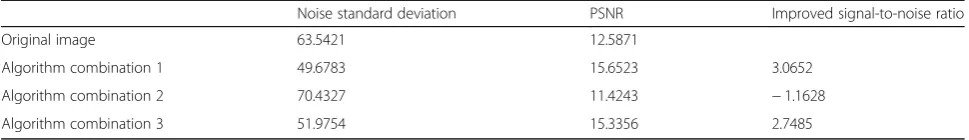
Table1gives the estimated noise method of various
com-bination algorithms and improves the signal-to-noise ra-tio. It can be seen that the signal-to-noise ratio of the processed image is improved, and the signal-to-noise ratio of the image with poor effect is reduced.
Through the analysis and evaluation of the above vari-ous image processing methods, the evaluation results of the evaluation method without reference images are ba-sically consistent with the actual effects, but sometimes, there is a certain deviation due to the complexity of the noise. However, it provides a quantitative analysis of the objective degree of image restoration, which can reflect the degree of image improvement to some extent.
5 Conclusions
The denoising process of computer video electromag-netic leakage emission reduction image is of great sig-nificance for improving the video reproduction and reception capability. From the effect and evaluation after the denoising process, the signal-to-noise ratio of the image is improved, the contrast of the image is en-hanced, and to some extent, the recognizability of the image is improved.
for restoring text recognition degree, which not only im-proves the visual effect to a certain extent, but also
pro-vides an objective method for image evaluation.
However, it should also be noted that for the computer audio electromagnetic leakage emission reduction image with relatively complicated noise, it is impossible to achieve a great breakthrough by relying on the latter image processing. Therefore, the reduction of computer video information should be further started from the source, reduce the introduced noise, and further study the new adaptive image processing algorithm, such as artificial neural network (CMAC), genetic algorithm, and wavelet transform, the combination of the two can achieve better reception.
Acknowledgements
The authors thank the editor and anonymous reviewers for their helpful comments and valuable suggestions.
Funding Not applicable.
Availability of data and materials Please contact author for data requests.
Author’s contributions
The author takes part in the discussion of the work described in this paper. The author read and approved the final manuscript.
Competing interests
The author declares that he has no competing interests.
Publisher’s Note
Springer Nature remains neutral with regard to jurisdictional claims in published maps and institutional affiliations.
Received: 20 October 2018 Accepted: 28 December 2018
References
1. S. Wang, Q. Yang, T. Jin, et al., Research on method for preventing digital video signal electromagnetic leakage based on visual effect. Acta Electron. Sin.45(8), 2038–2043 (2017).
2. S. Sun, H. Zhang, Y. Du. The electromagnetic leakage analysis based on arithmetic operation of FPGA[C]//2017 IEEE 5th International Symposium on Electromagnetic Compatibility (EMC-Beijing). IEEE.5, 1-5 (2017).
3. W. Yang, P. Liu, Y. Wang, et al. Research on Dynamic Characteristics Optimization via Analytical Modeling for Typical Rotational Electromagnetic System[J]. IEEE Transactions on Magnetics.50(11), 1-4 (2014).
4. C. Ulaş, U. Aşık, C. Karadeniz. Analysis and reconstruction of laser printer information leakages in the media of electromagnetic radiation, power, and signal lines[J]. Computers & Security.58, 250-267 (2016).
5. S. Wang, P. Han, Y. Qiu, et al. Information leakage of electromagnetic emission from differential transmission lines[C]//Electromagnetic
Compatibility (EMC-Beijing), 2017 IEEE 5th International Symposium on. IEEE. 4, 1-4 (2017).
6. Y. Chen. Electromagnetic leakage testing system based on Labwindows/CVI. Wuhan Zhicheng Times Cultural Development Co., Ltd Proceedings of the 2018 International Conference on Mechanical, Electrical, Electronic Engineering & Science (MEEES 2018). Wuhan Zhicheng Times Cultural Development Co., Ltd;5, 1-5 (2018).
7. Z. Qian, Q. Wang, C. Zhou, et al., Analysis and reconstruction of conduction leakage signal of computer video cable based on the spatial correlation filtering method. Chin. J. Radio Sci.32(3), 331–337 (2017).
8. Z. Jiemin, S. Haimeng, inComputer Science & Education (ICCSE), 2014 9th International Conference on. The new approach of preventing the electromagnetic information leakage (2014).
9. Y. Zhang, J. Xiao, J. Peng, et al. Kernel Wiener filtering model with low-rank approximation for image denoising. Inf. Sci.462(2018).
10. C. Louchet, L. Moisan, inSignal Processing Conference. Total variation denoising using iterated conditional expectation (2014), pp. 1592–1596. 11. T. Shibata, M. Tanaka, M. Okutomi, inIEEE international conference on
computer vision IEEE computer society. Misalignment-robust joint filter for cross-modal image pairs (2017), pp. 3315–3324.
12. S. Cao, H. Liping, H. Beibei, C. Gang, et al. Self-adaptive non-local means image denoising algorithm based on fuzzy edge complement[J]. Laser Optoelectron. Prog. (2018).
13. W.U. Jianning, M. Shi, Z. Xing, Image denoising using magnitude-phase of the Undecimated dual-tree complex wavelet transform. Infrared Technol.1, 213-218 (2018).
14. C. Huerga, L. Glaría, P. Castro, et al. Guibelalde, Segmentation improvement through denoising of PET images with 3D-context modelling in wavelet domain[J]. Phys Med53, 62-71 (2018).
15. J. Bai, XC. Feng. Image denoising using generalized anisotropic diffusion. J. Math. Imaging Vision60(7), 1-4 (2018).
16. J. Ye, Y. Zhang, Y. Yang, Image Denoising via Improved Simultaneous Sparse Coding with Laplacian Scale Mixture[J]. Wuhan Univ. J. Nat. Sci.23(4), 338-346 (2018).
17. M. Almahamdy, H.B. Riley, Performance study of different denoising methods for ECG signals. Proc. Comput. Sci.37, 325–332 (2014). 18. F. Scholkmann, V. Revol, R. Kaufmann, et al., A new method for fusion,
denoising and enhancement of x-ray images retrieved from Talbot-Lau grating interferometry. Phys. Med. Biol.59(6), 1425 (2014).
19. G.D. Martino, A.D. Simone, A. Iodice, et al., Scattering-based nonlocal means SAR despeckling. IEEE Trans. Geosci. Remote Sens.54(6), 3574–3588 (2016). 20. V.B.S Prasath, J.M. Urbano, D. Vorotnikov. Analysis of adaptive
forward-backward diffusion flows with applications in image processing[J]. Inverse Prob.31(10), 105008 (2015).
Table 1Noise standard deviation of various combined algorithms and improvement of signal-to-noise ratio
Noise standard deviation PSNR Improved signal-to-noise ratio
Original image 63.5421 12.5871
Algorithm combination 1 49.6783 15.6523 3.0652
Algorithm combination 2 70.4327 11.4243 −1.1628