RESEARCH
3D reconstruction of biological
structures: automated procedures for alignment
and reconstruction of multiple tilt series
in electron tomography
Sébastien Phan
1†, Daniela Boassa
1†, Phuong Nguyen
1, Xiaohua Wan
1, Jason Lanman
2,3, Albert Lawrence
1and Mark H. Ellisman
1,2,3*Abstract
Transmission electron microscopy allows the collection of multiple views of specimens and their computerized three-dimensional reconstruction and analysis with electron tomography. Here we describe development of methods for automated multi-tilt data acquisition, tilt-series processing, and alignment which allow assembly of electron tomo-graphic data from a greater number of tilt series, yielding enhanced data quality and increasing contrast associated with weakly stained structures. This scheme facilitates visualization of nanometer scale details of fine structure in volumes taken from plastic-embedded samples of biological specimens in all dimensions. As heavy metal-contrasted plastic-embedded samples are less sensitive to the overall dose rather than the electron dose rate, an optimal resampling of the reconstruction space can be achieved by accumulating lower dose electron micrographs of the same area over a wider range of specimen orientations. The computerized multiple tilt series collection scheme is implemented together with automated advanced procedures making collection, image alignment, and process-ing of multi-tilt tomography data a seamless process. We demonstrate high-quality reconstructions from samples of well-described biological structures. These include the giant Mimivirus and clathrin-coated vesicles, imaged in situ in their normal intracellular contexts. Examples are provided from samples of cultured cells prepared by high-pressure freezing and freeze-substitution as well as by chemical fixation before epoxy resin embedding.
Keywords: Electron tomography, 3D reconstruction, TxBR, Tomogram averaging, Iterative methods
© 2016 The Author(s). This article is distributed under the terms of the Creative Commons Attribution 4.0 International License (http://creativecommons.org/licenses/by/4.0/), which permits unrestricted use, distribution, and reproduction in any medium, provided you give appropriate credit to the original author(s) and the source, provide a link to the Creative Commons license, and indicate if changes were made.
Background
High-resolution localization and visualization of pro-teins and assemblies of macromolecular complexes in three dimensions (3D) within cells and tissues remain a difficult goal to achieve. With the advent of many new genetic probe-based or click chemistry-based correlated light and electron microscopy (CLEM) labeling strate-gies [1–3], it is desirable to facilitate production of higher
quality 3D electron microscopic tomography (EMT) data sets from plastic-embedded specimens [4, 5]. In con-trast to fluorescent label-based light microscopy, which provides a more limited view of the distribution of only the fluorescently labeled constituents, EMT allows the simultaneous visualization of all the intricate complex-ity of biological structures around the cellular or subcel-lular domain under investigation. However, compared to procedures for high-resolution light microscopy, EMT remains a relatively complicated method. For example, to image tissues or thicker regions of epoxy-embedded cells, semi-thin sections must generally be produced by ultramicrotomy and then imaged from many differ-ent sample oridiffer-entations, yielding a set of digital electron micrographs. These micrographs must be processed
Open Access
*Correspondence: [email protected]
†Sébastien Phan and Daniela Boassa contributed equally to this work 1 National Center For Microscopy and Imaging Research, Center for Research in Biological Systems, University of California, 9500 Gilman Drive La Jolla, San Diego, CA, 92093-0608, USA
through several steps to deliver the 3D volume for further analysis.
Aside from the imperfection in the optical performance of transmission electron microscopes (TEMs), such as optical aberrations [6, 7], the quality of an electron tomo-gram depends on additional factors. These arise from the interaction between a sample and the electron beam, the data acquisition scheme and the reconstruction process. While the electron beam damage in a plastic-embedded material mostly depends on the dose rate and not the accumulated dose [8], the overall quality of EMT data would clearly be improved from collecting more micro-graphs of a sample, if the micromicro-graphs alignment could be effectively optimized to handle the sample warping and other optical distortions.
In order to improve the electron tomogram quality of dose tolerant specimens, we developed a multiple-tilt series data acquisition scheme for the EMT. In contrast to the traditional single/double tilt series acquisition pro-tocol [9, 10], this approach involves recording of a very large number of low dose or low-dose rate micrographs distributed across a wider range of specimen rotations. By sampling the specimen of interest through more ori-entations, the data folding into the reconstructed volume become more evenly distributed, further reducing sam-pling artifacts and producing higher quality tomograms. The visibility of weakly contrasted structures and thus overall specimen contrast is also enhanced by the addi-tional summing of feature densities which accrues from the convergence of the greater multiplicity of views of the same weakly stained objects. To reduce the additional complexity of this extreme sampling and multiple tilt series reconstruction strategy, we have developed auto-mated procedures for alignment and volume generation processes, reducing (or eliminating) the requirement for user input.
We demonstrate the utility of this method using two different test cases: the giant amoeba-infecting DNA virus Mimivirus [11–13] and a clathrin-coated vesicle in a human embryonic kidney HEK293T cell in culture. For each example, we employed both filtered back-projection and non-linear iterative reconstruction routines to gen-erate the 3D EMT volumes. Mimivirus and the clathrin lattice assembly have been extensively studied by other methods, establishing details of their structure and thus providing useful reference data with which to compare the quality of the results obtained using our multi-tilt EMT approach.
Methods
Specimen preparation
Two types of specimens were used to develop and evalu-ate our multiple tilt EMT methodology.
To reduce preservation-associated artifacts, we exam-ined samples of Mimivirus-infected amoebae preserved by rapid freezing, vitrified directly from the living state and processed by freeze-substitution to epoxy resin embedding. Since the structure of this virus has been studied in detail by cryoEM methods, following extrac-tion from cells and vitrificaextrac-tion [11, 12], we reasoned that these published findings would provide us with use-ful reference data to facilitate assessment of the quality of data from the multi-tilt strategy applied to stained and plastic-embedded samples described here.
Similarly, to assess our method on a well-studied ubiquitous intracellular structure following more typi-cal mixed aldehyde fixation and plastic embedding, we examined clathrin-coated vesicles in a mammalian cell in culture (HEK293T cells). These cells were grown at 37 °C, and 10 % CO2 in Dulbecco’s Modified Eagles Medium
(DMEM) containing 10 % fetal bovine serum (Invitro-gen). Adherent HEK293T cells were grown on poly-d-ly-sine-coated glass bottom dishes (MatTek Corporation, MA, USA), and fixed for 30 min in 2 % glutaraldehyde in 0.1M sodium cacodylate buffer (pH 7.4) on ice for EM processing. After washes in cacodylate buffer, cells were post-fixed with 1 % osmium tetraoxide for 30 min, stained with 0.2 % tannic acid and 2 % uranyl acetate, and then dehydrated and embedded in Durcupan epoxy resin.
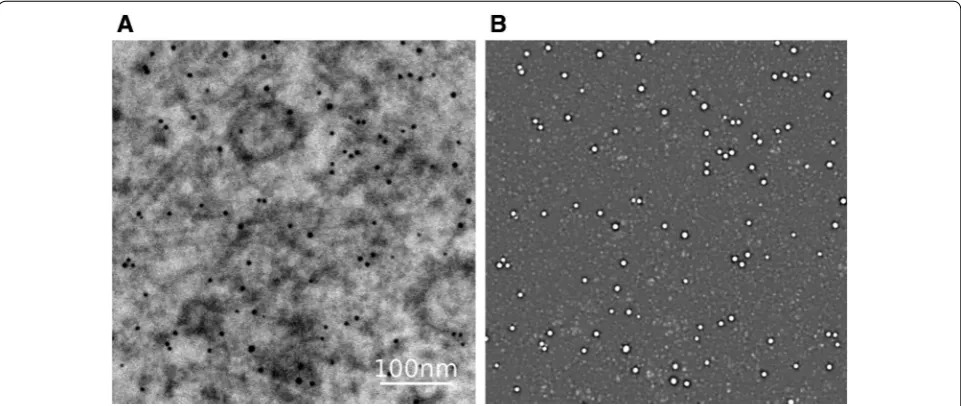
Sections from both sample types were cut using a dia-mond knife (Diatome) at a thickness between 200 and 300 nm. To improve stability of specimens under the beam of the EM, these sections were coated with car-bon on both sides. Colloidal gold particles (5 and 10 nm diameter) were deposited on each side of the sections to serve as fiducial markers.
Data acquisition protocol
EM data were obtained using an FEI Titan high base microscope operated at 300 kV; micrographs were pro-duced using a 4k × 4k Gatan CCD camera (US4000). Both microscope and detector were controlled by the SerialEM software package [14] which managed the automated tilt series acquisition.
With recent advances in instrument automation, col-lection of a large number of tilt series is straightforward, and parameters to acquire all images with a relatively low-dose rate were used for this project.
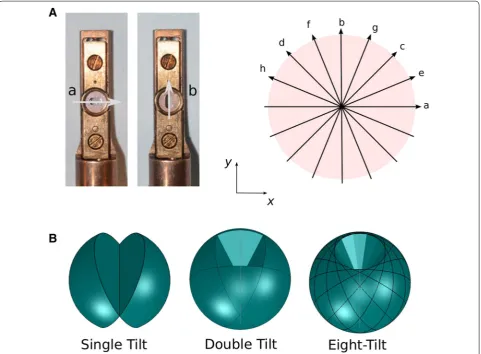
The n-fold tilt series scheme we have refined and applied is a straightforward generalization of the popu-lar double tilt series that can provide useful improve-ment to information in tomograms when compared to more standard single tilt series [9, 10]. In a double tilt series acquisition, the specimen is rotated ∼90° to obtain
artifacts arising from the “missing wedge” problem. This two tilt series acquisition is easily achieved with a man-ual rotation holder such as the one offered by Fischione Instruments (Model 2040) and used in this study.
As shown below, this strategy can be extended to add additional information to the reconstruction from just two series with orthogonal tilt axes. As shown in Fig. 1, we carried out azimuthal rotations for 8-tilt series acqui-sitions. The specimen angles (represented by letters in Fig. 1) are arranged according to a sequence similar to the multilevel access scheme (MAS) described in [15]. By using a multilevel access scheme, the artifacts would in principle be attenuated more rapidly than alternative orders of azimuthal rotations as the number of tilt series added to the reconstruction increases.
Series up to 16-fold rotation axis and 1° tilt incre-ments between −60° and +60° were acquired for this
study; in this extreme scenario (with around 2000 pro-jection views), the data acquisition step was completed within a single day. Each micrograph can be indexed by iω following the order of acquisition process (here
1≤iω≤16×121).
For the work described here, all but the specimen rotation step was automated using the serial EM script-ing tools. However, full automation of such a multi-tilt strategy would only require adding in a sample holder with motorized control (and readout) for rotation. The only additional step between tilt series is to determine and adjust the stage position for the specimen to be at its eucentric height for each tilt series. Routines for auto-mating this eucentricity adjustment are already in place in openly available automation packages such as Seri-alEM [14]. Projection micrographs were binned by 2 to overcome the detector limitations.
Reconstruction procedure
To produce a high-quality reconstruction, the projection images must be aligned accurately. In TxBR [16], a recon-struction package developed at NCMIR, this is done with a non-linear bundle adjustment scheme that optimizes the micrograph registration to the final volume with the 3D distribution of markers. This registration is para-metrized by means of polynomial maps [16, 17]. TxBR is able to account for a sizable amount of sample warping, optical distortion, and non-linear trajectories [18], which makes it a good candidate to align and reconstruct multi-ple tilt series [17].
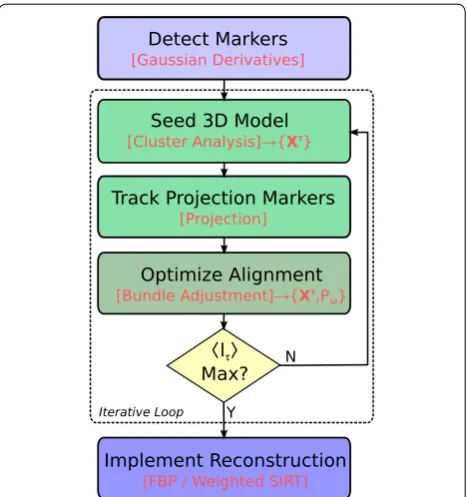
In TxBR, the optimization procedure handles all series simultaneously. This has proved to be more accurate and efficient [10] than aligning individual reconstructions after they are generated [19, 20]. The bundle adjustment routine minimizes a gold bead marker-based reprojec-tion error, simultaneously calculating projecreprojec-tion maps and marker positions in 3D. In order to accomplish this, gold markers or equivalent point-like features are required. We have developed an automatic solution for both the marker tracking and projection alignment pro-cedure that allows easy reconstruction of any n-fold tilt series. In summary, our method takes advantage of (i) second-order Gaussian derivatives detectors for local-izing the markers [21], (ii) a cluster analysis to identify them throughout a series and (iii) iterative procedures to refine the alignment process. Details are provided in "Appendix 1”.
Once the alignment step is completed, micrograph densities can be backprojected in the final 3D reconstruc-tion. We have investigated two options: a regular filtered back-projection (FBP) routine and an iterative procedure requiring more complicated steps. The first approach has been described in [16] and consists of a modified Shepp-Logan filtered back-projection scheme adapted to the case of curvilinear trajectories. Our second approach, wSIRT, is a SIRT-type iterative method with an adap-tive weighting scheme along trajectory paths. Com-pared to regular FBP, it requires multiple iterations of projection/back-projection sequences, but yields better results. It is a modified version of the so called ASART procedure introduced in [22] and recently extended to accomodate non-linear alignment [23]. In the case of incomplete phantom data, ASART was proved to gener-ate high-quality reconstructions in comparison to other approaches [22]. In fact, the adaptive relaxation parame-ter used in ASART to accelerate the convergence process is responsible for attenuating some missing data artifacts.
This method can be regarded as an iterative version of cross-validation and as such can be assigned a physi-cal meaning in the context of cross-validation [10]. It is related statistically to multiplicative-type algorithm
which maximizes expectation in emission tomogra-phy [24]. A more comprehensive discussion is available in "Appendix 3."
Results
Sampling refinement
Traditionally in EMT, the data acquisition scheme con-sists in single or double tilt series [9, 10], with rather large angle increments (≃2°) in order to reduce the specimen full exposure to the electron beam radiations. In particu-lar, assuming a full pixel resolution can be achieved, we note that the basic sampling requirement arising from a 2D analysis, �θ =(2/L)∗180◦/π [25], would not be
fulfilled with the latest detector size—with for instance
L=4k pixels, �θ ≃0.03◦. Refined sampling schemes
have been developed within the context of Fourier slice theorem to optimize the resolution of the obtained reconstructions [26, 27]. Nevertheless, the reconstruc-tion artifacts caused by (i) the missing data issue (this is the missing wedge/pyramid problem) and (ii) the discre-tization problem, can only be attenuated through more sampling, and in some extent by computationally inten-sive iterative reconstruction methods.
Although the sampling of the reconstruction space is improved with this n-fold tilt series protocol, there is still a missing pyramid issue. Following [27], it is easy to show that the fraction q of the missing Fourier space information is given by the following expression:
where Lz and L are, respectively, the sample thickness
and its lateral dimension, while θmax is the maximum tilt
angle within a series—usually θmax≃60◦. Here, Eq. (1) is
only valid when n is a power of 2, L>Lz and θmax>45◦ .
When the number of tilt series equals 2 or becomes infi-nite, q(n) coincides well with the double tilt and conical series cases, respectively [27]. It is clear from above that accumulating the number of tilt series does not bring a large decrease in the fraction of missing Fourier informa-tion; q(2) = 11.1 %, q(4) = 9.2 %, q(8) = 8.84 %, q(16)
= 8.75 %, and q(∞) = 8.73 % with taking L=Lz and
θmax=60◦. In contrast, a n-tilt series scheme allows
aver-aging data that belong to the same Fourier space region multiple times with different sampling procedures.
The giant Mimivirus in situ
The double-stranded DNA Mimivirus, prototypic mem-ber of the Mimiviridae family, is the primary focus of our first reconstruction example. With a genome size of about 1.1 megabases, it is one of the largest known virus. When first discovered in 1992, this virus was indeed
(1) q(n)= n
6tan π 2n Lz L 1 tanθmax
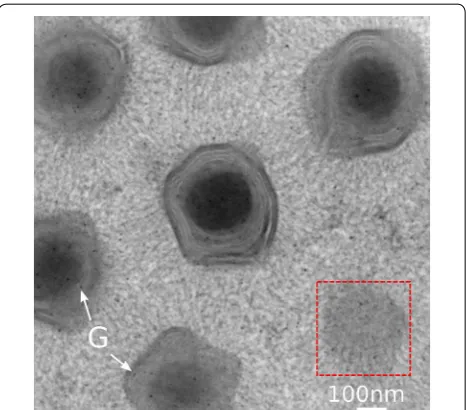
wrongly recognized as a bacterium because of its unu-sual dimension and its affinity to Gram-staining [28]. Its capsid envelope is an icosahedron-like structure with a vertex-to-vertex diameter about 500 nm. The capsid presents a starfish opening on one of its fivefold verti-ces. Additionally, the capsid envelope is surrounded by a dense layer of fibers, bringing the overall virion size within the 750 nm range. The fine structure of the cap-sid envelope, which has been well characterized both with atomic force microscopy and single particle analysis on virions whose fiber coatings were removed, suggests a p3 symmetry of depressions with the capsomers being arranged in a p6 symmetry [11, 12]. This level of detail has only been reported when the external layer of fibers is enzymatically digested with lysozyme and proteases, thus drastically improving the imaging conditions of an otherwise chemically modified virus. A goal of our work was to determine if we could see these structures for virus imaged in situ (and without digestion) and if so, to determine if the multiple tilt series acquisition and pro-cessing schemes help visualize features otherwise seen only in higher resolution studies of these fiber-free iso-lated capsids.
We applied the EMT methodology described above to generate a 3D representation of a Mimivirus virion in situ, from a semi-thick (∼150 nm) plastic section of
amoebae. For reference, a projection snapshot of the area under examination is displayed in figure when the speci-men has no tilt. In this example, we used a 16-tilt series scheme at a magnification of 29 k; this corresponds to a 0.32 nm pixel size in the raw electron micrographs. For each tilt series, a 1° angular increment was used from
−60° to +60°.
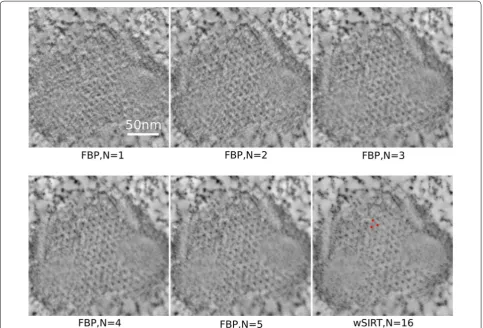
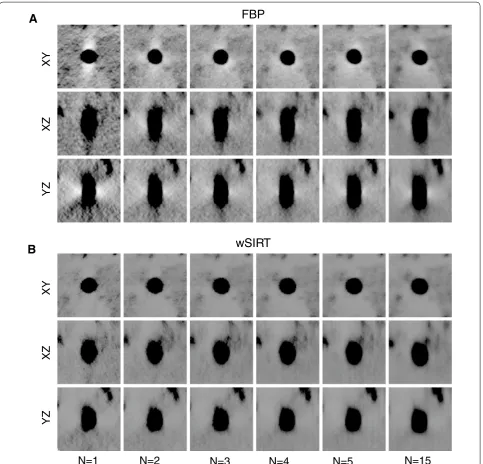
Tomogram slices close to a Mimivirus capsid layer (corresponding to the boxed area in Fig. 2) built from specified numbers N of tilt series are compared in Fig. 3. Five images generated through FBP after having binned the original projection data by a factor of 2 are shown; the lower rightmost image corresponds to the wSIRT method on the N = 16 tilt series case. A gradual improve-ment with N is noticeable on this front view, which is theoretically the least impaired with missing informa-tion. As expected, the signal-to-noise ratio improvement is the most striking during the transition from single to double tilt, when the reconstruction artifacts are strongly reduced. Note that a p3 symmetry pattern of dense mate-rial (dark spots on the images) is clearly apparent, and consistent with the arrangement of depressions visual-ized in the previous studies [11, 12]. This stained material is likely to match the root of the external Mimivirus fib-ers connecting into the capsid depressions.
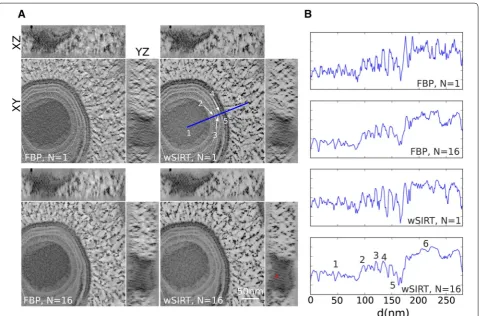
In Fig. 4, the front (XY), top (XZ) and side (YZ) views of a Mimivirus reconstruction are displayed for a single
tilt (N = 1, Fig. 4A top row) and a 16-tilt (N = 16, Fig. 4A bottom row) series; the uppercase letters X, Y, and Z are used to specify the coordinates of a point in the speci-men, Z being in the normal direction to the specimen slab. Results are displayed using FBP (Fig. 4A left column) and the more compute-intensive wSIRT method (Fig. 4A right column). For each case, the organization of the inner membranes of a Mimivirus virion is quite visible, and consistent with details in previous reports [13]. Benefits of our finer resampling scheme in the reconstruction space (N = 16 versus N = 1) are the most apparent on the XZ and YZ views, for which the p3 symmetry pattern struc-ture previously discussed in XY (Fig. 3) becomes recog-nizable for the 16-tilt series, while it is barely discernible on the side view of the single tilt series reconstruction.
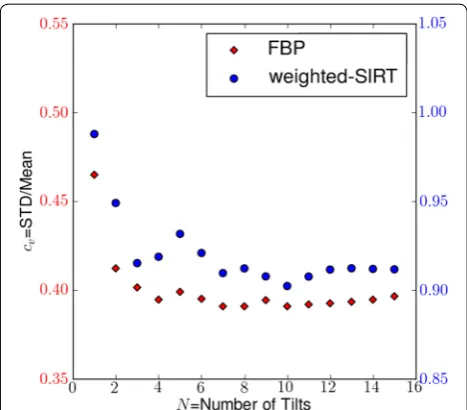
Density profiles along the blue line shown in Fig. 4A (top right image) were drawn for each reconstruction (Fig. 4B). It appears the signal amplitude of a single tilt (N = 1) reconstruction is higher compared to a 16-tilt reconstruction. This amplitude decrease with N should not be interpreted as a real effect: artifacts from the miss-ing wedge induce a deceptive contrast into the recon-structions, with for instance white fringes around the darker features in the XY view (Fig. 4A, FBP N = 1). This explains the overall behavior of the coefficient of varia-tion cv of a simple tomogram slice when plotted versus
the number N of tilt series (Fig. 5); cv is defined as the
ratio of the standard deviation to the mean of the pixel values.
As N increases, the coefficient of variation cv is first
lowered (this corresponds to a decrease in the contrast), a trend only triggered by the artifact attenuation. In Fig. 5, the reconstruction process for FBP appears to converge towards a nearly stable solution, roughly after N =8 at
which point the orientation space sampling appears fully effective.
Both FBP and wSIRT methods have been examined, and displayed a similar trend with more pronounced fluctuations for the iterative method. The total number of iteration cycles in the iterative approach was fixed to 50, and the relaxation parameter α was set to 2 (see Eq. (15)
in "Appendix 3"). With these parameters, the relative error in the projections ended up around 5.0×10⁻⁴. We
note the contrast enhancement between FBP and wSIRT, with clearly less white fringes around the dark features in the latter case.
For completeness, the front (XY), top (XZ), and side (YZ) views of a 5-nm gold particle are displayed in Fig. 6. Despite the improved sampling (with N = 1,...,15),
artifacts around gold particles from the missing pyramid (or cone) are still slightly visible in any FBP reconstruc-tion. However, they are greatly attenuated in the wSIRT reconstruction (Fig. 6).
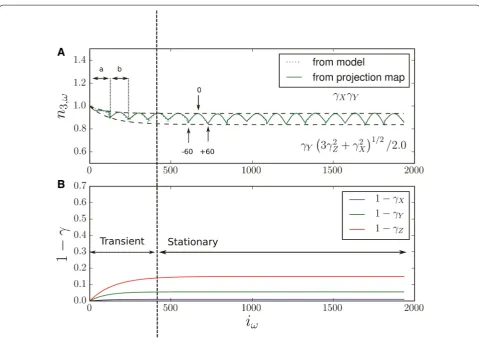
The electron dose rate applied onto the Mimivirus sam-ple over the data acquisition course was maintained at a low level, within 2–3 electrons per Angstrom square per second. However, this is enough to induce some obvious specimen deformations, as previously reported [8]. As described above, the bundle adjustment procedure used here in conjunction with a general projection model for aligning the micrographs offers an effective solution to the problem as shown in Fig. 7. After analyzing the final projections maps, we found that the corrected sample deformation is quantitatively in line with [8], showing a compression factor up to 15 % along the normal axis to the section and half or less along the lateral directions. Correction of this sample deformation is provided during the alignment process ensuring a minimal re-projection error [16–18]. To estimate the compression factors, we
considered a simple deformation model with only three deformation coefficient rates along the X, Y, and Z sam-ple directions, see "Appendix 2" for more details. With this model, we are able to capture the main variations of the final projection maps with a minimal set of adjust-ment parameters. As an illustration, we plot in Fig. 7 the quantity n3,ω defined in Eq. (10) versus the micrograph
index iω, both for the projection maps computed from
the bundle adjustment and the ones from the simple deformation model. In an ideal system with in particular no sample deformation, the quantity n3,ω should remain
equal to 1 by design; deviations from 1 would indicate a possible specimen warping. Once the model is adjusted, the prediction for n3,ω roughly follows the computed
map estimates as shown in Fig. 7, validating our choice of model. Note that the Z compression rate contribution to
n3,ω is larger at high tilt angles compared to its in-plane
(X and Y) counterparts, explaining the oscillatory behav-ior of n3,ω versus the micrograph index iω. One
interest-ing feature of this analysis is the ability to monitor both the transient and stationary sample deformation while
the specimen is irradiated, the stable state being reached after 3–4 tilt series in this experiment. It is worth noting that while some EMT practices for recording data from epoxy-embedded samples include a preliminary long exposure beam “cooking” step prior to the image acquisi-tion protocol, this can certainly be viewed as contributing to the alteration of the sample dimensions (particularly its thickness) and potentially a loss of useful informa-tion. However, as long as the transient behavior can be accurately modeled through a low-dose rate strategy and a refined tomographic alignment scheme, it is possible to ensure the final reconstruction geometry to be close to that of the original sample when it was first inserted into the TEM.
Clathrin‑coated vesicles
Clathrin-coated vesicles mediate the vesicular trans-port of cargo such as proteins between organelles in eukaryotic cells connecting the trans-Golgi network, endosomes, lysosomes, and the cell membrane. Clath-rin is a large protein complex composed of three heavy
chains and three light chains. This complex is referred to as a triskelion based on its three-legged appearance; it coassembles together with adaptor proteins to form the ‘coat’ around the vesicles. The spherical clathrin lattice structure appears as a polyhedron made of regular pen-tagons and hexagons. The adaptor proteins serve as links between the clathrin lattice and the membrane of the vesicle. The lattice structure of highly symmetrical forms of clathrin-coated vesicles assembled in vitro has already been studied in detail from single particle analysis [29]— for instance the mini-coat with its tetrahedral symme-try and the hexagonal barrel. Cryo-electron tomography reconstructions of lesser symmetrical clathrin-coated vesicles isolated from cells have also been reported [30]. We present here a sub-volume reconstruction of a cell in culture containing an individual coated vesicle (Figs. 8, 9). For this, we used a TEM magnification of 37 k and a 16 tilt-series scheme with 1° angle increment between −60°
and +60°. Compared to the previously reported studies
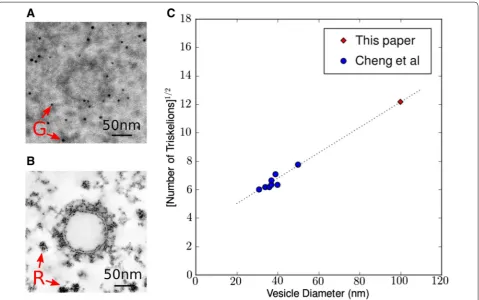
of isolated clathrin-coated vesicles, this in situ instance is a large assembly containing a 100 nm diameter inner ves-icle; the outer coat diameter being measured at roughly 140 nm. Note that the overall shape is not perfectly spherical but slightly oblong. We counted 61 hexagons, 11 pentagons, and 1 heptagon on the cage surface, which includes a total of 143 triskelions and 214 edges. Those numbers are consistent with prior studies as we expect them to behave linearly with the overall vesicle surface
(Fig. 8C). In Fig. 8A, a micrograph snapshot of the vesicle is displayed when the sample is not tilted; specimen fea-tures are then hardly discernible. This is not the case on a tomogram slice once the 16-tilt reconstruction is per-formed (Fig. 8B). The wSIRT reconstruction was gener-ated after 50 iterations and a mixing parameter α=2; the
original data were binned by 2. The clathrin cage struc-ture imaged here is within the functional context of the cell, a major difference from previous studies which were also carried out using cryoEM utilizing different contrast mechanisms. As this is an in situ-coated vesicle, its rela-tionship with other cellular elements such as free ribo-somal units can be seen directly, as indicated in Figs. 8B and 9A; a portion of rough endoplasmic reticulum is also visible in Fig. 9D.
In Fig. 9B, C, we matched the theoretical model of a basic molecular assembly made of three consecutive triskelions to our EMT reconstruction. For a larger scale perspective, the clathrin cage vertices, which also cor-respond to triskelion center locations, are displayed in Fig. 9C.
Discussion
In this work, we established automatic procedures to facilitate the processing of EMT reconstructions. This enabled us to introduce an averaging-like strategy to increase contrast of weakly stained structures based on multiple tilt series acquisition, thereby enhancing vis-ibility of fine structure in 3D. This strategy was applied on two distinct samples providing examples of its ben-efits and also demonstrating the use of two reconstruc-tion procedures, a regular FBP and wSIRT, a weighted iterative procedure. High-quality reconstructions were obtained with both procedures.
Use of a specific variation of an EMT image acquisition and reconstruction strategy should be determined based on the requirements of the project and the characteristics of the specimen being studied.
With frozen hydrated samples, a weak signal to noise ratio and a low radiation tolerance are the key concerns. Cautions must be taken to decrease the damage from electron interaction with the objects of interest. Tech-niques to boost the contrast are used to enhance image information, either with a strong defocus, an imaging energy filter or a phase plate [31]; this, in return, requires additional corrections with for instance a phase flipping step [32].
In contrast, considering the case of plastic-embed-ded material, as the electron dose rate appears to be more limiting than total dose, more extensive data acquisitions are possible especially if the dose rate is low. This was applied in our work. Contrast and reso-lution of objects within the tomograms are improved
by increasing the angular density of projections and processing the resulting set of images with software designed for this purpose. Efficiency and accuracy in aligning large sets of micrographs then become the critical practical challenge to overcome in 3D recon-struction. Our procedure can be viewed as a variant of averaging to improve signal to noise, combined with multiple tilt-based improvement on sampling from a greater number of perspectives.
Many other approaches in modern 3D EM rely on aver-aging. In single particle analysis [33], the reconstruction process involves a large collection of snapshots contain-ing identical structures with random orientations. This technique offers the opportunity to obtain very high-resolution average-based reconstructions representing the features of small molecular assemblies. Averaging is also possible in 3D [34, 35]. Unfortunately, the quality of the products of this process can be hampered by the
XY
XZ
YZ
N=1
N=2
N=3
N=4
N=5
N=15
FBP
wSIRT
XY
XZ
YZ
A
B
contributions of reconstruction artifacts which therefore need to be accounted for during the image processing.
Our approach focuses on a single specimen area within a rather large field of view, and seeks to redistribute the sample dose images taken over many orientations. It can be likened to some 3D tomogram averaging aspects, the difference being we are averaging data from exactly the same volume, the specimen only being rotated around the optical axis between each series, and it would be dif-ficult to totally overcome the missing wedge issue.
With a large number of exposures/tilt series, marker-based registration for the EMT process remains very effective. The automatic alignment procedures developed in this work allow us to handle a high density of gold par-ticles, with thousands of markers in the field of view. In
the two examples we considered that the total number of gold particles used for alignment is 365 and 60 for the giant Mimivirus and clathrin-coated vesicle, respectively. We successfully tested our alignment routines on other reconstructions containing several thousands markers. While the presence of numerous markers might be det-rimental to the reconstruction, with streak-type artifacts, it also allows for very accurate image registration espe-cially when using polynomial map correspondences as in TxBR. Artifacts surrounding a gold particle—an elec-tron dense material on a dim background—can be lim-ited if its diameter is chosen small (a few pixels), or if the weighted iterative method is used (Fig. 6).
wSIRT brings significant improvements over FBP. It enables a clear contrast enhancement and a large
Fig. 8 Clathrin-coated vesicle reconstruction using a 16 tilt series scheme. A EM snapshot at zero tilt; gold markers (G) are indicated with arrows. B XY section in the middle of the reconstruction. Note the contrast increase between the projection in A and the tomogram slice. Free ribosomal units (R) are indicated with arrows. The diameter of this organelle inner vesicle averaged around 100 nm, making it significantly larger than previ-ously reported similar structures [30]. C The number of triskelions should increase linearly with the vesicle surface; we counted 143 triskelions, which is consistent with the trend reported in [30]. Indeed, the square root of triskelions number versus inner vesicle diameter roughly follows a straight line.
artifact reduction (Figs. 5, 6). As a downside, this itera-tive approach is compute-intensive and requires hundred times more operations compared to FBP. Nevertheless, it is possible to make modifications in our current routine to accelerate the convergence process. For instance, one could gradually include the tilt series into the iterative computations, similarly to the approach we took taken in MAS data acquisition protocol, as shown in Fig. 1.
In a high throughput EMT production environment, implementing wSIRT with a very large number of tilt exposures might be difficult to carry out as a routine process. This leads to the practical dilemma of whether to acquire a small number of tilt series (typically ranging from 2 to 4) with the iterative approach, or to acquire a large number of tilt series and restrict the reconstruction process to filtered back-projections.
The answer to this question may reside in the prop-erties of the specimen preparation itself. For a sam-ple with a strong level of heavy metal staining, use of a large number of tilt series might not be as beneficial since the incoming signal to noise ratio can be compara-tively high. More data averaging will not likely bring out the details of unstained or weakly contrasted biological features in the reconstruction, while the high-resolu-tion features can be muddied by over-staining. In this case, implementing wSIRT on fewer tilt series may be judicious. A “multiple tilt and summed view averaging technique”—like the one presented here—may be more useful at lower magnification. For a sample with low staining level, this averaging technique would probably
bring more reconstruction details than a regular tomo-graphic process (with a single/double tilt series scheme), as our example on the clathrin-coated vesicle seems to indicate. Further investigations in this direction need to be done.
Conclusions
We believe that the developments described above pro-vide a useful method to enhance resolution of fine detail in tomographic reconstructions from plastic-embedded and heavy metal stained samples, thereby progressing a general goal of revealing supramolecular details in situ. While this approach addresses the under-sampling and noise averaging issues, it does not overcome the ambigu-ity related to a missing cone in the raw data. The impact of this missing data nevertheless remains small, especially when a weighted iterative procedure is applied.
Acquiring many micrographs at a lower dose rate, as we demonstrate in this work, could be useful in a full 180° EMT process as well. In such a setup, the biological spec-imen should be more sensitive to the beam-associated mass loss given its geometry, a few hundred nanometers diameter cylinder with isolated supports (Fig. 10). Micro-graphs in this particular application should be distributed within a single series as an unequivocal mathematical solution to the problem is available.
Finally, additional refinements to this multiple tilt series reconstruction strategy are still possible. For instance, registration adjustments can be included at each iteration step i of the wSIRT approach. A small misalignment in
the micrographs creates systematic patterns in the pro-jection errors v−vi [see "Appendix 3" Eq. (15)], which
can be reused as a feedback to correct for the original projection maps. This would accelerate the convergence of this recursive approach, and also improves the quality of the completed reconstruction on the smaller scale.
Authors’ contributions
SP and DB designed and executed the experiments, and analyzed the data. SP designed and wrote the computational algorithms. PN assisted with image processing. XW and AL participated in the algorithm design. JL prepared the Mimivirus sample. SP, DB, and ME prepared the manuscript. All authors read and approved the final manuscript.
Author details
1 National Center For Microscopy and Imaging Research, Center for Research in Biological Systems, University of California, 9500 Gilman Drive La Jolla, San Diego, CA, 92093-0608, USA. 2 Departments of Neurosciences and Bioengi-neering, University of California, 9500 Gilman Drive La Jolla, San Diego, CA, 92093-0608, USA. 3 Department of Biological Sciences, Purdue University, 915 W. State Street, West Lafayette, IN 47907-2054, USA.
Acknowledgements
This work was supported by grants from the NIH National Institute of General Medical Sciences under award number P41GM103412 to Mark H. Ellisman, to operate the National Center for Microscopy and Imaging Research, and through award number P41 GM103426 to Rommie Amaro, supporting the National Biomedical Computation Resource, and also from the American Heart Association award 10SDG2610281 to Daniela Boassa.
Competing interests
The authors declare that they have no competing interests.
Appendix 1: Automatic alignment
The averaging method proposed in this work relies on automating the EMT reconstruction process for any number of tilt series. This appendix describes in detail our procedure steps: (i) the marker detection, (ii) the single tilt alignment, (iii) the multiple tilt alignment. The back-projection routine in the case of the wSIRT approach is explained in the next appendix. The general alignment flow is summarized from Figs. 10–13.
Marker detection
The precise alignment of a tomographic series typically depends on fiducial markers; it is achieved by spreading gold particles on the specimen surfaces. By tracking the marker projections throughout a series of micrographs, the specimen deformation can be closely monitored and accounted for in the final alignment. This enables accu-rate electron micrograph registration, and ultimately leads to high-quality reconstructions.
The first step towards fully automated EMT consists in detecting the gold particles for each electron micrograph. We follow the procedure outlined in reference [21]. Since gold particles on a micrograph correspond to small black disks, the method consists in finding local maximum in the second-order derivatives (or equivalent) of the image gray levels. Following [21], this detection scheme is opti-mized to be selective for a certain length scale σ related
to the marker size. Hence, the gaussian derivative con-cept is introduced. Second-order gaussian derivatives with a scale level σ are simply obtained by convoluting
images with three kernels Gσ
xx,Gxyσ and Gσyy:
with i, j in {x,y};x and y denote for the two coordinates of
an image pixel.
The detector image is then built from the eigenvalues
min and max of the 2 by 2 image matrix Iij
. In our case, we choose to detect particles from the following quantity
D= |minmax|.
Peaks in image D are considered positive if their normal-ized correlation coefficient is above a certain threshold. The threshold value can be readjusted afterwards (in a second
(2) Iσij(x,y)=I(x,y)∗Gijσ(x,y)
(3)
Gσxx(x,y)= x 2−σ2 2π σ4 exp
−x2+y2
2σ2
,
Gσyy(x,y)= y2−σ2 2π σ4 exp
−x2+y2
2σ2
,
Gσxy(x,y)= xy 2π σ4 exp
−x2+y2
2σ2
.
pass) so the number of selected peaks, i.e., the number of gold markers, remains consistent throughout the tilt series.
Iterative alignment for single axis tomography
Immediately after the detection, the set of peaks is still an unclassified collection of points. It is not possible to distinguish any trace corresponding to a specific marker within the micrograph series.
This is resolved using a procedure based upon a cluster analysis to identify possible gold particles 3D locations and their associated projections. Precisely, when back-projecting rays arising from detected peaks, markers should be located on the convergence nodes (Fig. 12A). Once a marker position is assessed, its projection trace can be rebuilt by picking the most probable matching peak on each micrograph—this is the closest peak to a micrograph projection point within a given distance.
The overall automation scheme is outlined in Fig. 11. It is an iterative procedure that repeatedly builds pro-jection traces from cluster seeds and refines the micro-graph alignment until the average peak number in the traces becomes maximal. The initial state in this iterative routine corresponds to a rough alignment where micro-graphs are aligned by means of simple cross-correlations. It has consistently shown to lead to the correct final alignment.
In practice, the cluster analysis is carried out on a set of 3D points generated from pair of back-projected rays; for each pair of rays, the mid-point of the short-est segment joining them is retained; this would corre-spond for instance to mid-point H of segment H1H2 in
Fig. 12B. Narrow regions exhibiting a high point density are mapped to clusters; their centroid is taken as the 3D position of a marker and used as an input to determine the projection traces. Throughout this computation, the projection maps Pω that associates a 3D point X to a 2D
pixel x in micrograph ω are taken affine, i.e., rays are
con-sidered as straight lines. Also, to ensure the 3D seeding procedure is efficient, we do not consider all the possi-ble pairs of rays, but only the ones separated by a fixed angle increment—for instance 20°. By doing so, align-ing tilt series containalign-ing thousands of markers can be done in a matter of minutes on a regular workstation. To implement the cluster analysis, we used the scipy.cluster
package [36].
After the seeding procedure has been initiated and the marker traces been identified, the alignment is finally optimized through a bundle adjustment procedure by minimizing a reprojection error. This allows to refine the projection maps Pω ; this technique has been extensively
discussed in the context of electron tomography [16–18]. When markers are numerous (for instance, more than
nc=100), the procedure outlined in Fig. 11 is
imple-mented twice. At first, we restrict the number of markers to be less than a certain threshold (<nc) but still evenly
distributed; this allows to quickly estimate the projection maps Pω. In a second pass, all the particles are
consid-ered: since the initial value of Pω is already very accurate,
the procedure remains efficient. A second pass might be unnecessary for single tilt series. This is not the case for multiple tilt series as we will see in the next paragraph. Also, note there is no guarantee every single particle is picked by our automation routine; it is nevertheless very effective because of the two-pass detection scheme— see Appendix "Marker detection".
Compared to other approaches, for instance the
beadtrack utility in eTomo [20], our procedure uses a global (3D) framework; it does not try to connect peaks directly from one micrograph to the next one in a sequential manner. This is still possible to achieve with geometrical cross-over consideration, but probably not optimal: there is a large uncertainty on the cross-over
H
1H
2H
B
1
2
A
location of two nearly parallel rays. Finally, we note that a sequential cross-correlation procedure is used during the built up of the initial projection map.
The seeding step depicted in Fig. 12 and its cluster analysis could be excluded from the iterative loop and implemented only once as an initial routine. Maintaining this step within the loop allows the number of markers to grow and thus more alignment flexibility, with only a limited impact on the algorithm performance.
Once the iterative routine has converged, a final bundle adjustment scheme can be implemented using non-linear projection maps [16, 17]. This would insure a more accu-rate alignment, and eventually correct for any morpho-logical distortions [18]. For multiple tilt series however, this non-linear bundle adjustment should be carried out when the entire procedure is completed.
Iterative alignment for multiple axis tomography
The automated routine described above can be applied to any number of tilt series without substantial modifi-cation, just by considering them as a unique dataset/ series. A more robust methodology consists in aligning first each series separately, and handle them globally once their individual signatures—projection map {Pω}ω and
marker locations {Xτ}
τ—are known. This is the approach
we adopt; the workflow is summarized in Fig. 13.
For the global alignment, correspondences between markers from different series need to be established. This task is implemented with another iterative procedure.
In the following, Xaτa
τa and
Pωa
ωa indicate
respec-tively the 3D marker positions and projection maps for tilt series a; τa indexes the markers and ωa the specimen
orientation.
For every pair of series (a,b), two functions αab and αba
map the correspondences between the sets Xτaa
τa and
Xτb
b
τb:
Since reconstructing from a or b is equivalent, we intro-duce Tab (resp. Tba), the invertible 3D transformation
to switch from volume a to volume b (resp. b to a);
Tab−1=Tba. In this approach, the index mapping αab is
set by comparing the point to point distance between
{Tab(Xτaa)}τa and {X
τb
b}τb; this allows to assign a unique
τb for each τa as long the corresponding distance is
short enough. A similar procedure is used with αba . At
the end, only tracks τa from a satisfying the condition
τa=αba◦αab(τa) are kept. Those tracks and their b
counterpart are then used to refine the transformation
Tab with a 3D regression procedure. This process can be
repeated iteratively until the number of shared markers between the two sets is maximized.
For the first iteration, the 3D transformation Tab is
initialized as a simple 3D rotation around the Z axis. Its parameters, i.e., translation coefficients and rotation angle, are estimated by comparing the zero-tilt images from both series. The images are cross-correlated for dif-ferent relative rotations; the highest correlation peak pro-vides necessary elements to estimate Tab.
This iterative operation is repeated for each pair of tilt series. Once all the shared markers are identified, the original marker sets are recollected as a unique set, and each projection maps redefined in relation to the first series a, that is Pωb→Pωb◦Tab. Those quantities are
used as inputs in a final bundle adjustment procedure for the entire system.
It is clear that having detected a maximum num-ber of markers during the single tilt series alignment is important to establish the geometrical correspondence between tilt series.
Appendix 2: Monitoring the sample deformation
Part of our present knowledge about electron beam dam-age on plastic sections derives from studies relying on tracking fiducial markers [8]. It therefore comes as no surprise that the same information is inherently con-tained in any EMT process whose alignment procedure shares the same principles. In fact, the overall quality of a reconstruction technique depends on how well the align-ment procedure compensates for sample deformation, among other issues.
We describe in this appendix how to simply extract some sample deformation parameters from the projec-tion maps {Pω}ω, once the bundle adjustment
optimiza-tion procedure has been carried out.
In our procedure, the correspondence between a point
X=(X,Y,Z) of the specimen at no tilt and a projection (4) τb=αab(τa)
τa=αba(τb).
Fig. 13 Flow chart summarizing the automation strategy for multiple tilt series. Each series i is first reconstructed independently as outlined in Fig. 11, generating multiple sets of gold marker 3D positions {Xτi
point x=(x,y) on a micrograph for a given specimen
ori-entation ω is expressed as a polynomial expansion, which
at the first-order writes:
the linear portion of this development being characterized by a set of two vectors n1,ω and n2,ω at each sample tilt.
In an ideal system, with no sample warping and optics following straight line rules, the projection map in (5) would exactly correspond to projecting the result of two simple rotations: �eZ◦Ru,θ◦ReZ,φ; the first one ReZ,φ
modeling the sample replacement between each tilt series (φ is the azimuthal angle), while the second one
Ru,θ describes the sample tilt operation within a series, u
is the tilt axis (θ is the tilt angle), and eZ the orthogonal
projection along the optic axis eZ.
At a high enough magnification to avoid any optical distortion problem, and with a small electron beam dose rate, we expect the deviations from the ideal case to be simple. In those conditions, the sample would mostly shrink with two different compression factors, a larger one γZ along the normal axis and a smaller one γ⊥ within
the specimen plane (if γ⊥≃γX ≃γY). This can be
math-ematically summarized by modeling the projection map (5) with the following:
The linear part of the affine transformation Wω which
describes the sample shrinkage is
Here, the warping transformation Wω is indexed by the
sample orientation ω=(θ,φ), but Wω really depends on
the accumulated dose and the micrograph index of the acquisition order. As the micrographs are collected, the sample will shrink, we assume exponentially, towards a stable plateau whose value is mostly a function of the electron dose rate [8].
here, γX,∞, γY,∞ and γZ,∞ are the plateau values for
both shrinkage coefficients γX, γY and γZ; iω is the index
of an electron micrograph; τX, τY and τZ are the
associ-ated shrinkage rates. Note that during the data acquisi-tion with SerialEM [14], there is always a tracking and an autofocus routine happening between two recorded micrographs. Nevertheless, we can safely assume that iω
is directly proportional to the accumulated dose.
(5)
x = tx,ω+n1X,ωX+n1Y,ωY+n1Z,ωZ+...
y = ty,ω+n2X,ωX+n2Y,ωY +n2Z,ωZ+...,
(6)
x=�e
Z◦Ru,θ ◦ReZ,φ◦Wω(X),
(7)
γX 0 0
0 γY 0
0 0 γZ
. (8)
γX = γX,∞+(1−γX,∞)e−iω/τX γY = γY,∞+(1−γY,∞)e−iω/τZ γZ = γZ,∞+(1−γZ,∞)e−iω/τZ ,
A crude linear model with no coupling between axes for the sample deformation, as outlined by the Eqs. (6) , (7) and (8), can already capture some coarse variations of the projection map throughout the tilt series. It is very clear, when monitoring the quantity:
which becomes
for the deformation model defined in Eq. (7). In this case, if there was no sample warping (γX =1, γY =1
and γZ =1), the quantity n3,ω should remain equal to 1.
On the other hand, with more shrinkage along the nor-mal axis of the section, that is 1−γX, 1−γY ≪1−γZ , n3,ω would oscillate between two curves specified by
γ⊥−2
3γZ2+γ⊥+2
1/2
/2 and γ⊥−γ⊥+, with γ⊥−=min(γX,γY)
and γ⊥+=max(γX,γY) during the multiple axis scheme
with a tilt variation between −60° and +60°.
Appendix 3: Weighted iterative approach
In this appendix, we elaborate the principles behind the weighted iterative approach.
Considering electrons traveling across a specimen, their trajectories γx,ω(t) depend on both their final
des-tination x on the detector and the specimen orientation
ω; t is a variable that parametrizes a particle position
along its path; t=t0 and t=t1 correspond to the
speci-men boundaries. The fundaspeci-mental principle of electron tomography consists in inverting the following relation:
which defines the Radon transform RŴ, Ŵ being the set
of all the possible electron trajectories; u is the volumic representation of the specimen; v is the projection micro-graph density.
The formulation of the weighted iterative approach employed in this work involves the following operator
¯ R∗
Ŵ:
X is a variable representing the 3D positions in the
specimen while Pω are the projection maps
associ-ated with trajectories γx,ω(t); for every (x,ω,t), we have
Pω(γx,ω(t))=x; finally, x,ω is a function that modulates (9) n3,ω= �n1,ω×n2,ω�
(10)
n3,ω=
(γX2cos2φ+γY2sin2φ)γZ2sin2θ+γX2γY2cos2θ 1/2
(11)
v(x,ω)=RŴu(x,ω)≡ t1
t0
u[γx,ω(t)]dt,
(12)
¯
R∗
Ŵv(X)=
Pω(X)=x
the back-projected densities depending on the position within the specimen and the source of the contribution, that is the originating micrograph.
In electron tomography, it is generally not possible to obtain the exact solution of the inverse problem outlined in Eq. (11), mostly because of the missing wedge prob-lem. The mathematical system is ill-posed, and as a result, many artifacts hamper the reconstructions obtained via standard approaches.
The motivation behind introducing the weighting parameter in Eq. (12) is to enforce constraints on the back-projection operator that will ultimately lead to reconstruction bearing minimal flaw, but still be solu-tion of Eq. (11). Possible choices for x,ω can be dictated
by physics-based arguments. For example, to reduce the streaks effects surrounding dense objects, we can choose an expression that will effectively inflate their absorbance and attenuate the bleaching effect along the rays. Such an expression can be inferred using cross-validation ideas, with for instance,
In addition, the original projection constraint along the rays must still be satisfied with:
for every micrograph pixel x and every sample
orienta-tion ω.
We have used for this work a SIRT-type iterative approach to find a solution for Eq. (11); the weighted-backprojection operator R¯∗
Ŵ being used to correct for the
discrepancies at each iteration. During the ith step, all the projections vi that correspond to the original
speci-men orientations are evaluated from the volume density
ui through Eq. (11). Next, the volume density at iteration i+1 is evaluated by using
with taking the following expression for the weighting operator in R¯∗
Ŵ,i:
with t=t1−t0; α is just a mixing parameter for
adjust-ing the convergence rate.
(13) x,ω∼ −
Pω(X)=x,ω�=ω′
v(x,ω′)dω′.
(14) t1 t0 x,ω γx,ω(t)
dt=1,
(15) ui+1=ui+αR¯∗Ŵ,i(v−vi),
(16) x,ω;i(X)=
2 �t −
ui(X) vi(x,ω)
,
Equation (16) approximates Eq. (13) and satisfies rela-tion (14). Expressed in this way, the system of Eqs. (15), (16) is similar to the adaptive approach developed in [22].
The iterative process is initialized by simply back-pro-jecting the raw electron micrographs.
Finally, we note that the weighted iterative approach described in this appendix is tightly related to the mul-tiplicative-type algorithm category in image recon-struction; for instance, the expectation maximization algorithm in emission tomography (see chap. 5 in [24]). For this latter, reconstructions are obtained by maxi-mizing a likelihood function characterizing the physical nature of the phenomenon, a Poisson distribution. The procedure is implemented through a multiplicative itera-tive scheme, and can be shown equivalent to Eq. (15) with α=1. This statistical framework is also very
appro-priate in the case of electron tomography and its underly-ing physical principles. It also offers, as discussed above in the context of cross-validation, a more refined solution to artifacts compared to more standard approaches (FBP, SIRT, etc.).
Received: 1 February 2016 Accepted: 1 June 2016
References
1. Shu, X., Lev-Ram, V., Deerinck, T.J., Qi, Y., Ramko, E.B., Davidson, M.W., Jin, Y., Ellisman, M.H., Tsien, R.Y.: A genetically encoded tag for correlated light and electron microscopy of intact cells, tissues, and organisms. PLoS Biol. 9(4), e1001041 (2011)
2. Martell, J.D., Deerinck, T.J., Sancak, Y., Poulos, T.L., Mootha, V.K., Sosinsky, G.E., Ellisman, M.H., Ting, A.Y.: Engineered ascorbate peroxidase as a genetically encoded reporter for electron microscopy. Nat. Biotechnol. 30, 1143–1148 (2012)
3. Ngo, J.T., Adams, S.R., Deerinck, T.J., Boassa, D., Rodriguez-Rivera, F., Palida, S.F., Bertozzi, C.R., Ellisman, M.H., Tsien, R.Y.: Click-EM for imaging metaboli-cally tagged non-protein biomolecules. Nat. Chem. Biol. 12(6), 459–465 (2016). doi:10.1038/nchembio.2076
4. Frank, J.: Electron Tomography: Methods for Three-Dimensional Visualiza-tion of Structure in the Cell. Springer, New York (2006)
5. McEwen, B.F., Renken, C., Marko, M., Mannella, C.: Principles and Practice in Electron Tomography, pp. 129–168. Academic Press, San Diego (2008) 6. Hawkes, P.W., Kasper, E.: Principles of Electron Optics. Academic Press Inc,
San Diego (1989)
7. Reimer, L., Kohl, H.: Transmission Electron Microscopy: Physics of Image Formation. Springer Verlag, Berlin (2008)
8. Luther, P.K.: Sample shrinkage and radiation damage of plastic sections. In: Frank, J. (ed.) Electron Tomography: Methods for Three-Dimensional Visualization of Structure in the Cell, pp. 17–40. Springer, Berlin (2006) 9. Mastronarde, D.N.: Fiducial marker and hybrid alignment methods for
sin-gle- and double-axis tomography. In: Frank, J. (ed.) Electron Tomography: Methods for Three-Dimensional Visualization of Structure in the Cell, pp. 163–185. Springer, Berlin (2006)
11. Xiao, C., Kuznetsov, Y.G., Sun, S., Hafenstein, S.L., Kostyuchenko, V.A., Chip-man, P.R., Suzan-Monti, M., Raoult, D., McPherson, A., Rossmann, M.G.: Structural studies of the giant Mimivirus. PLoS. Biol. 7(4), e1000092 (2009) 12. Klose, T., Kuznetsov, Y.G., Xiao, C., Sun, S., McPherson, A., Rossmann,
M.G.: The three-dimensional structure of Mimivirus. Intervirology 53(5), 268–273 (2010)
13. Mutsafi, Y., Shimoni, E., Shimon, A., Minsky, A.: Membrane assembly during the infection cycle of the giant Mimivirus. PLoS Pathog. 9(5), e1003367 (2013)
14. Mastronarde, D.N.: Automated electron microscope tomography using robust prediction of specimen movements. J. Struct. Biol. 152(1), 36–51 (2005)
15. Guan, H., Gordon, R.: A projection access order for speedy convergence of art (algebraic reconstruction technique): a multilevel scheme for computed tomography. Phys. Med. Biol. 39(11), 2005–2022 (1994) 16. Lawrence, A.F., Bouwer, J.C., Perkins, G., Ellisman, M.H.: Transform-based
backprojection for volume reconstruction of large format electron micro-scope tilt series. J. Struct. Biol. 154, 144–167 (2006)
17. Phan, S., Bouwer, J., Lanman, J., Terada, M., Lawrence, A.F.: Non-linear bundle adjustment for electron tomography, In: Proceedings of the 2009 WRI World Congress on Computer Science and Information Engineering-Volume 01, CSIE ’09, IEEE Computer Society, Washington, 2009, pp. 604–612
18. Phan, S., Lawrence, A., Molina, T., Lanman, J., Berlanga, M., Terada, M., Kulungowski, A., Obayashi, J., Ellisman, M.: Txbr montage reconstruction for large field electron tomography. J. Struct. Biol. 180(1), 154–164 (2012) 19. Mastronarde, D.N.: Dual-axis tomography: an approach with alignment
methods that preserve resolution. J. Struct. Biol. 120(3), 343–352 (1997) 20. Mastronarde, D.N.: Tomographic reconstruction with the imod software
package. Microsc. Microanal. 12(2), 178–179 (2006)
21. Cao, M., Takaoka, A., Zhang, H.B., Nishi, R.: An automatic method of detecting and tracking fiducial markers for alignment in electron tomog-raphy. J. Electron. Microsc. (Tokyo) 60(1), 39–46 (2011)
22. Wan, X., Zhang, F., Chu, Q., Zhang, K., Sun, F., Yuan, B., Liu, Z.: Three-dimensional reconstruction using an adaptive simultaneous algebraic reconstruction technique in electron tomography. J. Struct. Biol. 175(3), 277–287 (2011)
23. Wan, X., Phan, S., Lawrence, A., Zhang, F., Han, R., Liu, Z., Ellisman, M.: Itera-tive methods in large field electron microscope tomography. SIAM. J. Sci. Comput. 35(5), S402–S419 (2013). doi:10.1137/120881464
24. Natterer, F., Wübbeling, F.: Mathematical methods in image reconstruc-tion. Society for Industrial and Applied Mathematics (2001). http://epubs. siam.org/doi/abs/10.1137/1.9780898718324
25. Bracewell, R.N.: R. A. C., Inversion of a fan-beam scans in radio astronomy. Astrophys. J. 150, 427–434 (1967)
26. Saxton, W., Baumeister, W., Hahn, M.: Three-dimensional reconstruction of imperfect two-dimensional crystals. Ultramicroscopy 13, 57–70 (1984) 27. Penczek, P.A., Frank, J.: Resolution in electron tomography. In: Frank, J.
(ed.) Electron Tomography: Methods for Three-Dimensional Visualization of Structure in the Cell, pp. 307–330. Springer, Berlin (2006)
28. Raoult, D., Scola, B.L., Birtles, R.: The discovery and characterization of Mimivirus, the largest known virus and putative pneumonia agent. Clin. Infect. Dis. 45(1), 95–102 (2007)
29. Fotin, A., Cheng, Y., Sliz, P., Grigorieff, N., Harrison, S.C., Kirchhausen, T., Walz, T.: Molecular model for a complete clathrin lattice from electron cryomicroscopy. Nature 432(7017), 573–579 (2004)
30. Cheng, Y., Boll, W., Kirchhausen, T., Harrison, S.C., Walz, T.: Cryo-electron tomography of clathrin-coated vesicles: structural implications for coat assembly. J. Mol. Biol. 365(3), 892–899 (2007)
31. Nagayama, K.: Another 60 years in electron microscopy: development of phase-plate electron microscopy and biological applications. J. Electr. Microsc. 60(suppl 1), S43–S62 (2011)
32. Xiong, Q., Morphew, M.K., Schwartz, C.L., Hoenger, A.H., Mastronarde, D.N.: CTF determination and correction for low dose tomographic tilt series. J. Struct. Biol. 168(3), 378–387 (2009)
33. Zhou, Z.H.: Towards atomic resolution structural determination by single-particle cryo-electron microscopy. Curr. Opin. Struct. Biol. 18(2), 218–228 (2008)
34. Briggs, J.A.: Structural biology in situ—potential of subtomogram averag-ing. Curr. Opin. Struc. Biol. 23(2), 261–267 (2013). Theory and simulation/ macromolecular assemblies
35. Nicastro, D., Schwartz, C., Pierson, J., Gaudette, R., Porter, M.E., McIntosh, J.R.: The molecular architecture of axonemes revealed by cryoelectron tomography. Science 313(5789), 944–948 (2006)