Article
Application of Demand Response Strategy in Optimal
Configuration of a Standalone Wind-Solar-Battery
System
Xiaoling Yuan1, Baole Huang1, Jieyan Xu2, Haoming Liu1, Qingcheng Yao1
1 College of Energy and Electrical Engineering, Hohai University, Nanjing, China; [email protected] (X.Y); [email protected] (B.H); [email protected] (H.L); [email protected]
2 State Grid Energy Conservation Service Co., Ltd., Xicheng District, Beijing 100052, China; [email protected]
Abstract: This study presents application of demand response strategy in a standalone
wind-solar-battery hybrid energy system (HES). Inputs for the designed HES are wind speed, solar radiation, temperature and load demand which is variable with time. In this study, hourly values of meteorological data and hourly load demand are considered in one year. An improved gravitational search algorithm (IGSA) is used to optimize the configuration of the standalone wind-solar-battery hybrid power system. The optimal objectives of the system are cost of the system in life cycle, the loss of power supply probability(LPSP)and the energy excess percentage(EXC).The effect of demand response on economic benefit and energy storage allocation of the standalone wind-solar-battery system is studied. The obtained optimal configuration of the proposed HES can provide minimal energy cost with excellent performance and reduced waste and unmet load.
Keywords: multi-objective optimization; optimal configuration; improved gravitational search
algorithm (IGSA); wind-solar-battery system; demand response
1. Introduction
Energy is a vital factor for social and economic development of any country. Nowadays 80% of worldwide energy demand is met by means of fossil fuels. Therefore, researches on the development of renewable energy have generated wide spread attention recently [1-2]. Renewable energy resources have enormous potential and can meet the present world energy. They can enhance diversity in energy supply markets, secure long-term sustainable energy supply, and reduce local and global atmospheric emissions [3]. Wind and solar energy is considered the most preferred renewable energy source, and they are widely used to supply load in remote areas and non-grid areas such as independent islands [4-5]. Combining these two types of energies effectively to create a hybrid energy system can not only improve the power supply reliability but can also make full use of a variety of clean energies, while reducing energy wastage [6]. In general, multi-source hybrid energy systems have a higher quality and greater reliability than a system comprising of a single resource [7-8]. Koutroulis et al. [5] proposed a genetic algorithm (GA) based on cost minimization of a stand-alone hybrid solar-wind system in order to determine the optimal number and type of each energy source. B. Tudu et al. [9] presented a novel methodology for strategic selection of different components of PV-wind hybrid system.
In recent years, a battery energy storage system (BESS) is used in various aspects of hybrid power system. The main challenge in integrating a BESS into a hybrid power system is to evaluate an
optimum size of BESS to prevent the hybrid power system from instability and system collapse [10]. Daniel Akinyele et al. [11] presented an overview of batteries and compared their technical properties such as the cycle life, power and energy densities, and the costs. They proposed an optimal battery technology sizing and selection strategy, then assessed the environmental impact of batteries in efficiencies a typical renewable energy application by using a stand-alone PV system as a case study. In [12], a method for optimal sizing and operation of a BESS is proposed for spinning reserve in a small isolated power system. Obviously, considering BESS into a hybrid power system can overcome the stochastic availability and the unpredictable availability of renewable energy especially in the state of off-grid model. In standalone wind-solar-storage hybrid power system, Wang and Nehrir [13] proposed a standalone hybrid alternative energy system consisting of wind, PV, FC (fuel cell), electrolyzer and BAT. Wind and PV were the primary power sources of the system to take full advantage of renewable energy, and the FC-electrolyzer combination is used as a backup and a long-term storage system. A BAT bank was also used in the system for short-time backup to supply transient power. D.Suchitra et al. [8] proposed an optimally designed multi-source standalone hybrid generation system comprising of photovoltaic panels, wind turbine generators, batteries and diesel generator. Rodolfo Dufo-Lopez et al. [14] showed a multi-objective evolutionary algorithm (MOEA) for the optimization of standalone (off-grid) hybrid systems (photovoltaic-wind-diesel-battery) to minimize total net present cost (NPC) and maximize human development index (HDI) and job creation (JC). However, there are several factors that can give more consideration, the factors of storage capacity allocation, environmental problems, the full use of the complementary characteristics of wind and solar, the total investment of the system.
Further, demand response (DR) plays a key role for optimum asset utilization and to avoid or delay the need of new infrastructure investment [15]. DR programs are increasingly being deployed for various grid support functionalities, including demand shifting, power balancing, voltage/frequency control, and ancillary services [16]. M.A.Zehir et al. [17] proposed a novel retail demand response program in which the incentives are dependent on the aggregated performance of participants. Ugonna R. et al. [18] presented a method of evaluating consumer energy consumption behaviors whereby such information can be useful in designing grid network with improved active user participation in DR programs. However, the existing demand response is mainly based on the grid-connected, and less to explore the optimal configuration of stand-alone hybrid power system. This paper combines the DR with a stand-alone wind-solar-battery hybrid power system, and considers the cost of the system, the loss of power supply probability(LPSP) and the energy excess percentage(EXC), presents a method for a multi-objective optimal configuration to balance the power generation and load consumption using an improved gravitational search algorithm (IGSA). Simultaneously, this paper combines BESS and DR to carry out the comprehensive resource planning and adopts a case study to demonstrate the effectiveness of the optimization algorithm.
2. Architecture of the System
Fig.1 Structure of the standalone wind-solar-battery system 2.1 Modeling of wind turbine generator
Power output of wind turbine is calculated according to local weather conditions. At the particular wind speed, power extracted at time t is calculated as follows [19].
=
0
0
(1)
Where is rated power of wind turbine (kW), is wind speed (m/s), is cut-in speed of wind turbine (m/s), is rated speed of wind turbine(m/s), is cut-off speed of wind turbine(m/s) and is the number of wind turbines. The value of n varies from 1 to 3 and in this paper is 1[20].
The rated power of wind turbine is calculated by rated wind speed ( ), swept area of rotor (A), air density ( ), power coefficient ( ) and the efficiency (η ) associated with the energy conservation system and is given by (2).
(2) The value of for rated power output is determined by wind turbine curve.
2.2ModelingofPVpanel
The mathematical model of PV cell is approximately calculated, and the estimated solar radiation intensity in a certain time period (1h) can be simulated by a beta distribution [21].Its expression is:
t 1 (3) It is difficult to measure the actual temperature of PV panel. But it can be estimated by empirical formula testing the ambient temperature, expressed as:
30 (4) Where t is power output of photovoltaic cell at time t, is power output of PV panels in standard test condition (STC); is intensity of illumination in STC, 1000W/m2; is reference temperature in STC, 25℃; k is temperature correction coefficient, -0.0047/℃; is actual
2.3 Modeling of Battery
State of charge (SOC) of battery (indicates the amount of electricity remaining after the battery is used [22]. SOC of battery can be obtained by the method of electricity accumulation.
When the battery is discharged, the SOC at time t is:
1 1 ∆ (5) When the battery is charged, the SOC at time t is:
1 1 ∆ (6) Where 、 、 、 、 and are self discharge rate of storage battery、charging efficiency、discharging efficiency、charging power、discharge power and rated capacity respectively; ∆ is sampling step, here's 1.
2.4 Modeling of demand response load
When electricity wholesale market prices or system reliability is threatened, power users receive the power supply party leading to reduce load of direct compensation notice or signal after the electricity price rise, change the habits of its inherent power mode, to reduce or goes on a certain period of time of power load and power supply response and to ensure the stable, and curb short-term behavior of electricity price rise. With the gradual improvement of active distribution network construction, the demand response will gradually become a normal in the future.
This paper presents a strategy for a multi-objective optimal configuration according to demand response of electricity compensation. The calculation demand response compensation cost is shown in formula (7).
∑ ∙ , ∙ , (7) Where is demand response compensation cost in one day; is compensation price of unit electricity; , and , are load size and response time of the i response load respectively; is the number of response users.
Analyzing the time behavior of demand response load, adding the demand response capacity、 response times in the period and continuous response time to the contracts can improve the binding force and execution of the contract, further explore the potential of demand response.
(1) Demand response capacity constraint
0 , , , (8) Where , , is the maximum capacity of response users.
(2) Demand response times constraint.
0 , , , (9) Where , and , , are response times and the maximum response times.
(3) Response time constraint of continuous demand
3. Planning model 3.1 Objective function
(1) Total system investment (a) Equipment cost
The cost of purchasing wind turbines, photovoltaic panels, and energy storage batteries is called the initial cost, it's also the biggest, simplest, direct part of the cost, expressed as:
∑ (11) Where represents different power types, that is, wind turbines, photovoltaic panels and batteries; and represent the number and unit price of each power supply.
(b) Maintenance cost
In the whole process of wind-solar-battery hybrid power system, it is necessary to maintain the power generation unit so as to ensure the normal operation of wind turbine/photovoltaic panel and the energy storage battery, the expression is:
∑ ∑ ∆ (12) Where represents sampling time; is maintenance cost factor for each power supply, rmb/kWh; is operating power of each supply at time t, kW; ∆ represents sampling time period.
(c) Generation subsidy
Due to the wind-solar-batter hybrid power system for new energy generation, it has not become popular as conventional power generation such as firepower, and the construction cost is higher, resulting in the sale price is higher than the conventional power generation price. In order to encourage clean energy generation, the government subsidies for wind-solar power generation, generation subsidy is expressed as:
∑ ∑ ∆ (13) Where, is subsidy price for power generation of renewable energy.
(d) Demand response compensation
, (14) Where, , is conversion coefficient.
The total system investment of wind-solar-battery hybrid power generation system is:
(15) (2) LPSP
It often happens that wind-solar power generation is less than the power required by the load in wind- solar-battery hybrid power generation system, moreover, the SOC of the battery is less than the limit value (usually 0.1) and cannot be discharged. In this period, the proportion of the system cannot meet the load power demand is called the loss of power supply probability, expressed in LPSP [23], the formula is (16).
∑ ∑
∑ (16) Where, is demand load at time t.
(3) EXC
∑ ∑
∑ (17) The final optimization objective function is Eq.(18).
(18) Where and are weight vector, the values depend on the importance of the target, it is generally decided by decision makers.
3.2 Constraint condition
(1) Constraint of power balance
(19) Where , , represent power output of wind generation, photovoltaic generation and battery, is load power, Pd is DR load.
(2) Constraint of generator power output
(20) The constraint of generator power output is mainly considered to prolong the working life of power supply, , are upper and lower limits of generator power output.
(3) Capacity constraint of energy storage battery
(21)
4. Improved Gravitational Search Algorithm
Gravitational search algorithm (GSA) is proposed by Professor Esmat Rashedi of Iran [24].The algorithm is a meta heuristic intelligent optimization algorithm based on Newton's law of universal gravitation. The principle of the algorithm is that the search particles are considered as a group of objects running in space. Objects are attracted to each other by gravitational attraction, and the motion of objects follows the law of dynamics. The greater the fitness value is, the larger inertial mass of the particle is, the gravity causes objects to move toward the greatest mass, gradually approaching the optimal solution of the optimization problem.
Supposes a D-dimensional search space which includes N objects, the position of the i object is
expressed as:
, , ⋯ , , ⋯ (22)
At time t, the gravitational force of object j from object i in the k-dimension is expressed as:
, , ,
, (23) Where is a very small constant; , is inertial mass of object j; is gravitational constant. / (24)
T is maximum number of iterations.
, is Euclidean distance between objects i and objects j, expressed as:
|| , || (25) Therefore, the sum of the forces acting on the is equal to the sum of all the other objects forces act on it, the force is calculated as:.
1
1 1
/
(27)
Although compared with PSO and GA algorithm, GSA has fast convergence speed and strong global search ability, it also may fall into local solution. In this paper, parameters are changed in different stages of the optimization to improve convergence of GSA. The change of parameters not only enhances the global searching ability of the particle, but also accelerates the convergence of the algorithm. It also enhances the local search capability of the particle, improves the accuracy of the solution, and prevents the algorithm from falling into the local solution. At the same time, the gravity search algorithm also introduces the memory and group communication of particles in particle swarm algorithm to improve the effectiveness of the algorithm. The new speed and position update formula are defined as Eqs.(28)(29).
1 (28)
/ ∑ (29)
、 、 、and represent random variable between 0 and 1.
5. Demand response strategy
Demand response programs coordinating large numbers of consumers can play an important role in electricity system. Demand shifting is to make the load demand maximize close to the wind-solar power curve in time sequence. Intelligent system installed on the user side can be used to receive the incentive or price signal, trigger preprogrammed specified response strategy according to different users’ location, energy power demand and price level, and automatically adjust the load time of electricity, for example, the electricity time will shift from peak to nonpeak period. The expression as follows:
∑ | |
(30) Where T is scheduling period; is photovoltaic power generation at time t, P tw( )is wind power generation at time t; 、 、 and are post-demand response capacity、
pre-demand response capacity、transferred to the load and roll out load.
Based on the analysis of wind generation power output characteristics, load characteristics and energy storage system characteristics, the typical daily charge and discharge strategy of energy storage system in wind-solar hybrid power system can be summarized as follows:1) If the wind-solar power output is greater than the required load, the remaining energy is charged to battery until the battery is filled and the SOC reaches the upper limit, the charging is stopped; 2) If wind-solar power output is less than the required load, the demand response start and the discharge stop when the SOC reaches the lower limit .
6. Case study 6.1 Raw data
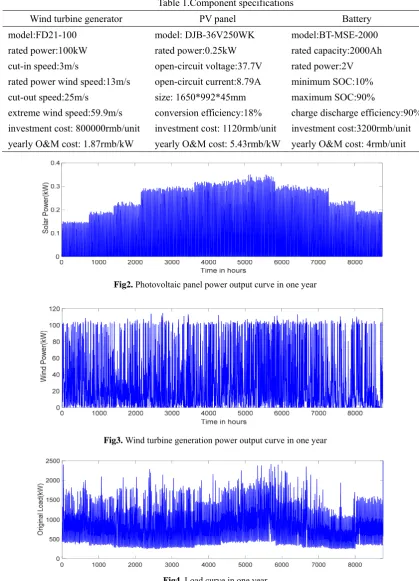
regarded as 20 years, the compensation price of DR is 0.1 rmb/kWh, the initial state of charge is 0.5 and the range of SOC is [0.1, 0.9]. The power output curve of the photovoltaic panel and wind turbine generation are shown in Fig.2-3. The distribution of the consumer power requirements is shown in Fig.4. Single unit specification of components wind turbine, PV panel and battery are presented in Table 1. In optimization algorithm, the number of population is 50, the number of generation is 200, G0 is 100 and α is 20.
Table 1.Component specifications
Wind turbine generator PV panel Battery
model:FD21-100 model: DJB-36V250WK model:BT-MSE-2000
rated power:100kW rated power:0.25kW rated capacity:2000Ah cut-in speed:3m/s open-circuit voltage:37.7V rated power:2V rated power wind speed:13m/s open-circuit current:8.79A minimum SOC:10% cut-out speed:25m/s size: 1650*992*45mm maximum SOC:90%
extreme wind speed:59.9m/s conversion efficiency:18% charge discharge efficiency:90% investment cost: 800000rmb/unit investment cost: 1120rmb/unit investment cost:3200rmb/unit
yearly O&M cost: 1.87rmb/kW yearly O&M cost: 5.43rmb/kW yearly O&M cost: 4rmb/unit
Fig2. Photovoltaic panel power output curve in one year
Fig3. Wind turbine generation power output curve in one year
6.2 Economic analysis of configuration results
IGSA is used to optimize the multi-objective system according to three schemes. Scheme 1: Planning the system without DR. Scheme 2: Based on the optimized configuration of the scheme 1, considering the demand response with different participation levels of the total load demand. Scheme 3: Optimal configuration of the system with different participation levels of the total load demand. Comparison of the optimized results and related indicators in three different schemes are shown in Table 2. The optimal configuration annual cost is shown in Table3.
Table 2 Results of the system configuration scheme Different
percentage DR
Number of
wind turbine
Number of
PV panel
Number of
Battery
DR capacity
(MWh) LPSP/% EXC/%
1 0% 15 5220 15417 0 5.74 6.42
2 5% 15 5220 15417 364.536 5.24 5.90
10% 15 5220 15417 729.071 4.74 5.37
15% 15 5220 15417 1093.607 4.24 4.84
20% 15 5220 15417 1458.143 3.74 4.32
3 5% 15 5220 13000 364.536 5.38 5.99
10% 15 5220 11076 729.071 5.00 5.54
15% 15 5220 9867 1093.607 4.57 5.06
20% 15 5220 8793 1458.143 4.13 4.58
Table 3.Yearly cost of the system (unit: Millions rmb) scheme Different
percentage DR
Annual investment
cost
Annual maintenance
cost
DR compensation
cost total investment
1 0% 8.2925 25.7987 0 30.6810
2 5% 8.2925 25.7987 0.03645 30.6445
10% 8.2925 25.7987 0.07291 30.6080 15% 8.2925 25.7987 0.1094 30.5716 20% 8.2925 25.7987 0.1458 30.5351
3 5% 7.1323 25.7890 0.03645 29.4746
10% 6.2088 25.7813 0.07291 28.5070 15% 5.6285 25.7765 0.1094 27.8854 20% 5.1130 25.7722 0.1458 27.3292
response is cost-effective for reducing the overall cost of the system.
Comparison the results of Scheme 1 and Scheme 3, with the increase of participation levels of the total load demand, the DR load is much closer to the power generation, and there is less demand for batteries, which directly leads to lower total costs. In addition, the EXC and LPSP in Scheme 3 are lower than that in Scheme 1. Due to the decrease in the number of batteries, the EXC and LPSP in Scheme 3 are higher than that in Scheme 2. In summary, demand response can effectively reduce the storage capacity of the standalone wind-solar-battery system and reduce the energy storage system maintenance, at the same time, economy and reliability of the system are improved.
(a) one year (b) one day
Fig5. Battery charge and discharge power as the DR percentage is 10%
Fig6. Load demand curve after DR with different participation level 6.3 Analysis of battery state
Take 10% of the participation level of the total load demand of Scheme 3 as an example, the convergence characteristic of the proposed project based on IGSA for the solution of objective function is effective. The performance analysis of this standalone wind-solar-battery hybrid power system for obtained optimal configuration is done for one year and the results are shown in Fig.7-9. Fig.7 shows a typical day without waste and lack of electricity. Fig. 8 shows the curve of a typical day with lack of electricity and Fig. 9 is a typical day with waste of electricity.
(a) Power from sources, load, unmet load and waste load
0 1000 2000 3000 4000 5000 6000 7000 8000
Time in hours -3000
-2000 -1000 0 1000 2000
scheme1 scheme2
B
tt
e
ry
change and dischange P
o
w
e
r (kW
)
0 2 4 6 8 10 12 14 16 18 20 22 24
Time in hours -1000
-500 0 500 1000 1500
Wind Power Solar Power
Battery charge and discharge Power Original Load
DR Load
Wind and Solar combine Power Waste Load
Unmet Load
(b) SOC of battery
Fig7. Without power waste and lack of electricity in a typical day
(a) Power from sources, load, unmet load and waste load
(b)SOC of battery
Fig8. Lack of electricity in a typical day
(a) Power from sources, load, unmet load and waste load
0 2 4 6 8 10 12 14 16 18 20 22 24
Time in hours -1000
0 1000
2000 Wind Power Solar Power
Battery charge and discharge Power Original Load
DR Load
Wind and Solar combine Power Waste Load
Unmet Load
(b) SOC of battery
Fig9. Waste of electricity in a typical day
It can be depicted that the standalone wind-solar-battery system are able to meet the user load completely as shown in Fig.7 (a). The load demand is higher than wind-solar power during 0:00-10:00 and the battery discharge power is sufficient to meet the load at the time as shown in Fig.7 (b). During 10:00-16:00, the wind-solar power output is higher than the load, excess power is charged to the battery to avoid waste. After18:00, the wind-solar power output reduces and cannot meet the load demand, the battery keeps discharging to maintain the system stability.
In the typical day with lack of electricity, the wind-solar power cannot meet the daily load, and the battery’s discharge cannot meet the daily lack of electricity, the SOC is in a low state as shown in Fig.8 (b). For the period from 0:00 to 10:00, the battery stop charging and there is an unmet load as shown in Fig.8 (a). During 10:00-24:00, the system began to resume stable operation. In the typical day with waste of electricity, the renewable energy is plentiful and the daily load is smooth as shown in Fig.9 (a). For the period from 1:00 to 11:00, the wind-solar power is higher than the load and the battery keeps charging to balance the system. After 11:00, the battery is fully charged as shown in Fig.9 (b) and the excess power cannot be charged to the battery, this causes waste during 11:00-18:00. After 18:00, the wind-solar power output is lower than the load and the battery discharge to maintain the continuity of power supply.
The total wind-solar-battery power generation with DR can basically maintain stable operation of the system, except in some periods at noon time and night time when wind-solar power is not available. Analysis of the results shows that the configured system can meet the normal operation of remote area or isolated island.
7. Conclusions
References
1. Luna-Rubio R, Trejo-Perea M, Vargas-Vázquez D, et al. Optimal sizing of renewable hybrids energy systems: A review of methodologies. Solar Energy, 2012, 86(4):1077-1088.
2. Sadeghi S, Ameri M. Multiobjective Optimization of PV-Bat-SOFC Hybrid System: Effect of Different Fuels Used in Solid Oxide Fuel Cell. Journal of Energy Engineering, 2014, 140(2):04013022.
3. Baghaee H R, Gharehpetian G B, Kaviani A K. Three dimensional Pareto Optimal solution to design a hybrid stand-alone wind/PV generation system with hydrogen energy storage using multi-objective Particle Swarm Optimization. Renewable Energy and Distributed Generation. IEEE, 2012:80-85.
4. Nasiraghdam H, Jadid S. Optimal hybrid PV/WT/FC sizing and distribution system reconfiguration using multi-objective artificial bee colony (MOABC) algorithm. Solar Energy, 2012, 86(10):3057-3071.
5. Koutroulis E, Kolokotsa D, Potirakis A, et al. Methodology for optimal sizing of stand-alone photovoltaic/wind-generator systems using genetic algorithms. Solar Energy, 2006, 80(9):1072-1088.
6. Ma G, Xu G, Chen Y, et al. Multi-objective optimal configuration method for a standalone wind–solar–battery hybrid power system. IET Renewable Power Generation, 2017, 11(1):194-202
7. Dalton G J, Lockington D A, Baldock T E. Case study feasibility analysis of renewable energy supply options for small to medium-sized tourist accommodations. Renewable Energy, 2009, 34(4):1134-1144.
8. Suchitra D, Jegatheesan R, Deepika T J. Optimal design of hybrid power generation system and its integration in the distribution network. International Journal of Electrical Power & Energy Systems, 2016, 82:136-149.
9. Tudu B, Mandal K K, Chakraborty N. A novel strategy for determination of optimal sizing of PV-wind hybrid system. International Conference on Control, Instrumentation, Energy & Communication. IEEE, 2016:451-455.
10. Kerdphol T, Fuji K, Mitani Y, et al. Optimization of a battery energy storage system using particle swarm optimization for stand-alone microgrids. International Journal of Electrical Power & Energy Systems, 2016, 81:32-39.
11. Akinyele D, Belikov J, Levron Y. Battery Storage Technologies for Electrical Applications: Impact in Stand-Alone Photovoltaic Systems. Energies, 2017.
12. Mercier P, Cherkaoui R, Oudalov A. Optimizing a Battery Energy Storage System for Frequency Control Application in an Isolated Power System. IEEE Transactions on Power Systems, 2009, 24(3):1469-1477.
13. Wang C, Nehrir M H. Power Management of a Stand-Alone Wind/Photovoltaic/Fuel Cell Energy System. IEEE Transactions on Energy Conversion, 2008, 23(3):957-967.)
14. Dufo-López R, Cristóbal-Monreal I R, Yusta J M. Optimisation of PV-wind-diesel-battery stand-alone systems to minimise cost and maximise human development index and job creation. Renewable Energy, 2016, 94:280-293.
15. Bhattarai B, Levesque M, Bak-Jensen B, et al. Design and Co-simulation of Hierarchical Architecture for Demand Response Control and Coordination. IEEE Transactions on Industrial Informatics, 2017, PP(99):1806-1816.
for the Definition of Demand-Response Programs. IEEE Transactions on Industrial Informatics, 2016, 12(3):952-961.
17. MA Zehir, MH Wevers, A Batman,et al. A novel incentive-based retail demand response program for collaborative participation of small customer. IEEE Manchester PowerTech,2017,pp.1-6.
18. UR Anuebunwa,HS Rajamani,P Pillai,et al. Evaluation of user participation capabilities in demand response programs for smart home application. 2017 IEEE PES PowerAfrica,2017,pp:483-488.
19. Suhane P, Rangnekar S, Mittal A, et al. Sizing and performance analysis of standalone wind-photovoltaic based hybrid energy system using ant colony optimization. IET Renewable Power Generation, 2016, 10(7):964-972.
20. Karaki S H, Chedid R B, Ramadan R. Probabilistic performance assessment of autonomous solar-wind energy conversion systems. Energy Conversion IEEE Transactions on, 1999, 14(3):766-772.
21. Yang H, Lu L, Zhou W. A novel optimization sizing model for hybrid solar-wind power generation system. Solar Energy, 2007, 81(1):76-84.
22. DING Ming,WANG Bo,ZHAO Bo,et al. Configuration Optimization of Capacity of Standalone PV-Wind-Diesel-Battery Hybrid Microgrid.Power System Technology,2013,37(3):575-581.
23. Luna-Rubio R, Trejo-Perea M, Vargas-Vázquez D, et al. Optimal sizing of renewable hybrids energy systems: A review of methodologies. Solar Energy, 2012, 86(4):1077-1088.
24. Rashedi E, Nezamabadi-Pour H, Saryazdi S. GSA: a gravitational search algorithm. Information sciences, 2009, 179(13): 2232-2248.
![A two dimensional coordination polymer: poly[[bis[μ2 N ethyl N (pyridin 4 ylmethyl)dithiocarbamato κ3N:S,S′]cadmium(II)] 3 methylpyridine monosolvate]](data:image/gif;base64,R0lGODlhAQABAIAAAP///wAAACH5BAEAAAAALAAAAAABAAEAAAICRAEAOw==)